Chemicals
Dizocilpine, hexadecyl trimethyl-ammonium bromide (HTAB), O-dianisidine dihydrochloride, and TNBS were procured from Sigma-Aldrich (Saint Louis, Missouri, USA). Dexamethasone was also purchased from Raha Pharmaceutical Company (Isfahan, Iran).
The ELISA (enzyme-linked immunosorbent assay) kits for mouse TNF-α, IL-1β and IL-6 were bought from Boster company (Pleasanton, CA, USA). Diethyl ether oxide and formalin solution (35%) were supplied by Merck (Darmstadt, Germany). L-glutamic acid was purchased from MP biomedical company (Netherland).
Animals
Swiss albino male mice (25 - 30 g) were used in the experiments. The animal room was maintained at 22 ˚C – 23 ˚C and 12:12 h light/dark cycle. The mice were fasted 16-18 hours prior to TNBS instillation. Thereafter, the animals were fed with standard pelleted chow and tap water ad libitum. All experiments were performed after receiving approval from the Ethics Committee of the Isfahan University of Medical Sciences, Isfahan, Iran.
Experimental groups
The mice were randomly distributed into following groups: Sham (normal mice treated with normal saline) and TNBS-induced colitis groups treated with vehicle (colitis control) or with dizocilpine (0.1, 1 and 5 mg/kg, i.p.), L-glutamic acid (2 g/kg, p.o.) or dexamethasone (1 mg/kg, i.p.). L-glutamic acid was used as a NMDA receptor agonist (
16). Colitis was induced in mice by a single intra-rectal instillation of 0.1 mL TNBS/Ethanol (50/50 v/v, 40mg/kg).
Sham group received intra-colonic normal saline (0.9%) in an equivalent volume. Each group composed of 6 mice. The animals were treated once daily starting 24 h before induction of colitis and continued for 4 days until the animals were sacrificed at the day fifth (
17).
Animal weight assessment
The animals were weighted each day just before the time of drug administration, during the experiments.
Colitis induction
The animals were fasted for 16-18 h before the TNBS enema. Acute colitis was induced by intracolonic instillation of TNBS with a 3 cm length tube under ether anesthesia. The animals were then kept in head down position for approximately 90 seconds to prevent the leakage of TNBS solution. Afterward, food and water were
ad libitum (
18).
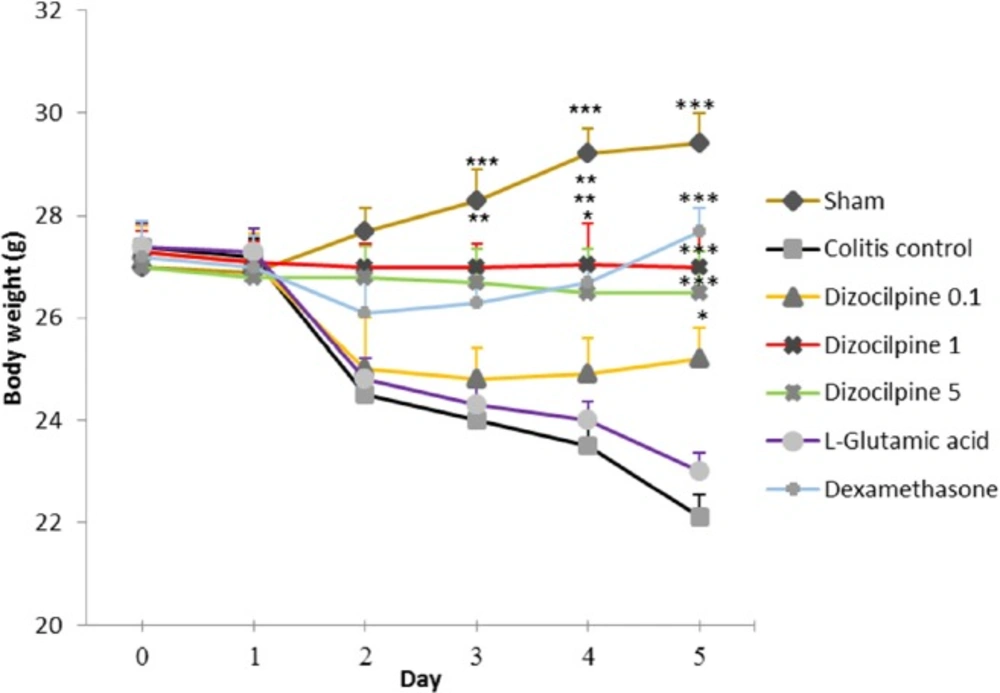
Weight change in mice with colitis treated with dizocilpine (0.1, 1 and 5 mg/kg, i.p.), L-glutamic acid (2 g/kg, p.o.) or dexamethasone (1 mg/kg, i.p.). Animals were treated 24 h prior to induction of colitis and continued daily for 4 days. Data are presented as mean ± SEM. n = 6 per group. ∗ 𝑃 < 0.05, ∗∗ 𝑃 < 0.01, ∗∗∗ 𝑃 < 0.001 vs colitis control
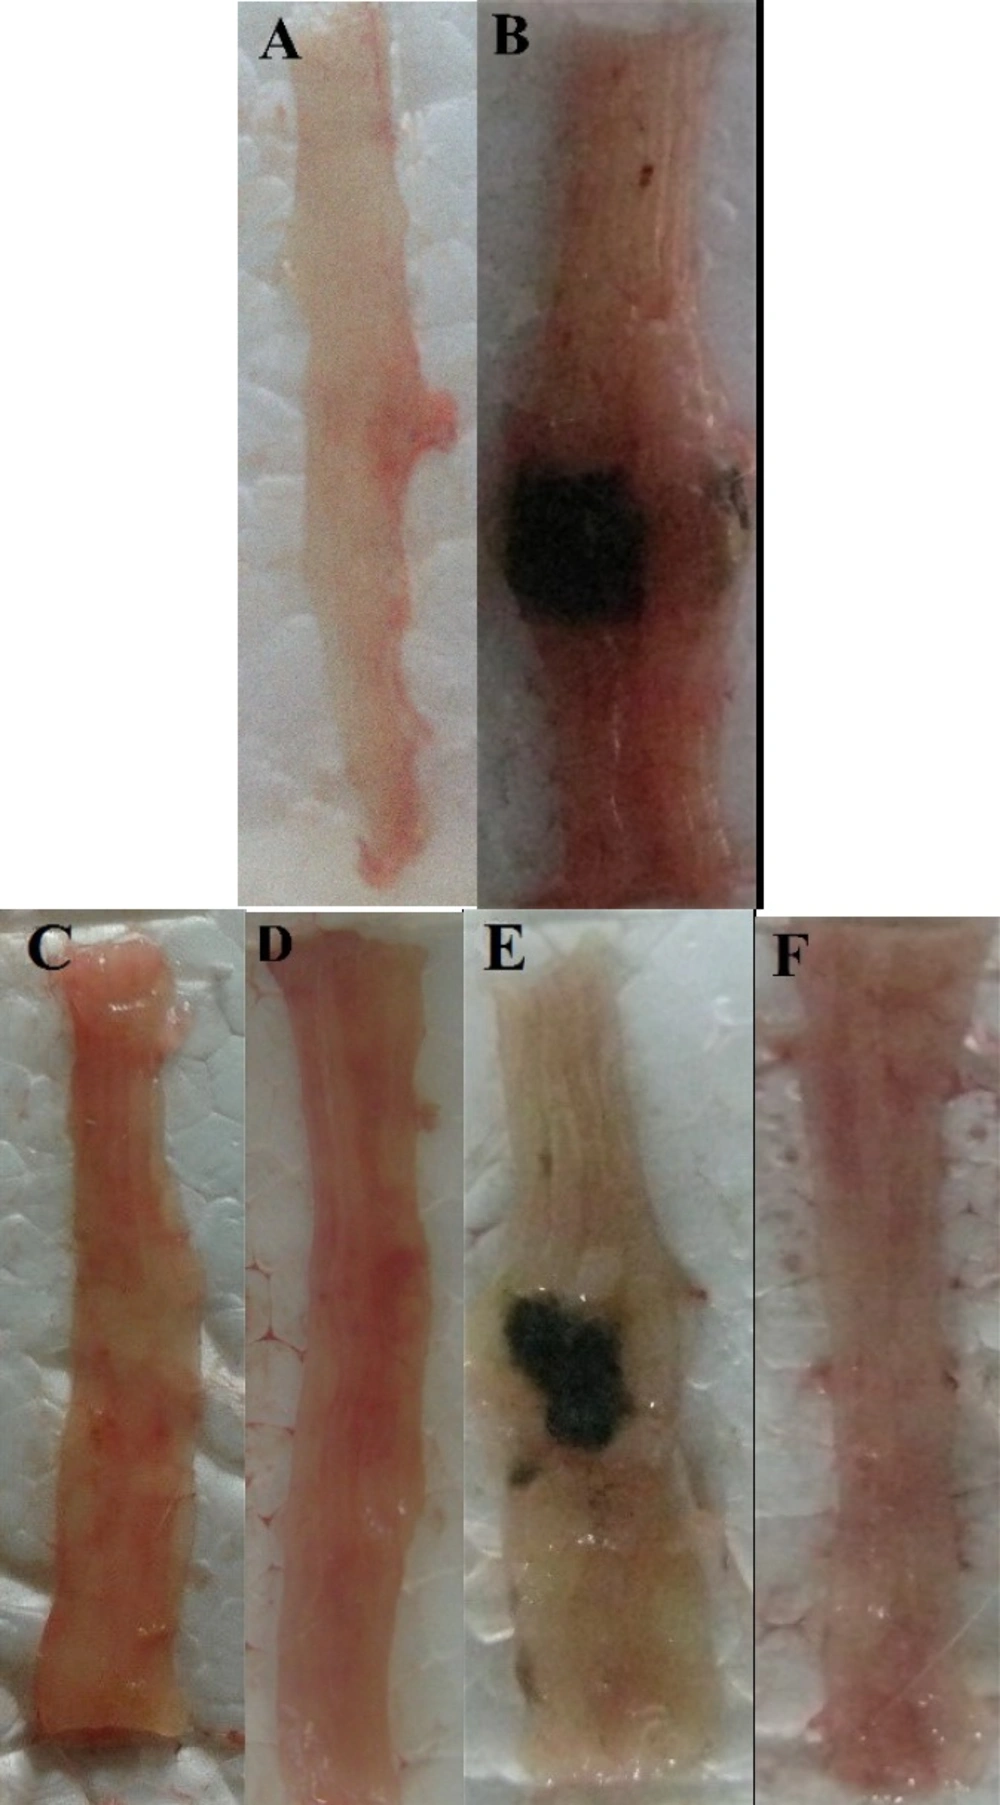
Photos of the distal colon appearance at day 5 after treatment of TNBS-induced colitis in mice. (A) Normal colon in Sham group; (B) Colitis control treated with normal saline; (C and D) Colitis treated with dizocilpine Dizocilpine has repeated and one of them should be deleted.(1 and 5 mg/kg, i.p.) (E) L-glutamic acid (2/kg, p.o.) and (F) dexamethasone (1 mg/kg, i.p.).
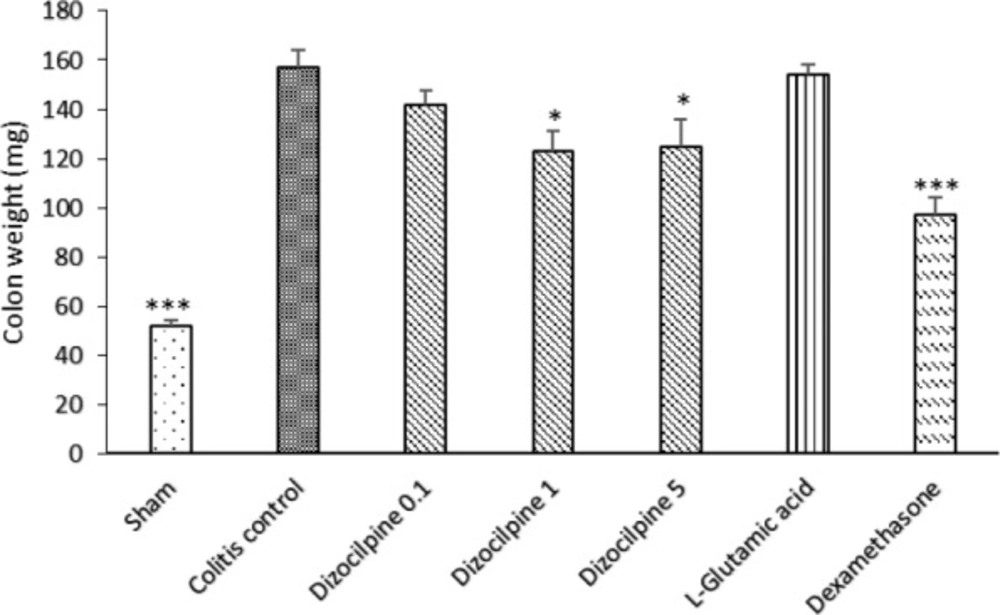
Changes in distal colon weight (3 Cm) of mice with colitis treated with dizocilpine (0.1, 1 and 5 mg/kg, i.p.), L-glutamic acid (2 g/kg, p.o.) or dexamethasone (1 mg/ kg, i.p.). Sham and colitis control groups received an equal volume of normal saline (i.p.). Animals were treated 24 h prior to induction of colitis and continued daily for 4 days. Data are presented as mean ± SEM. n = 6 per group. ∗ 𝑃 < 0.05, ∗∗∗ 𝑃 < 0.001 vs colitis control
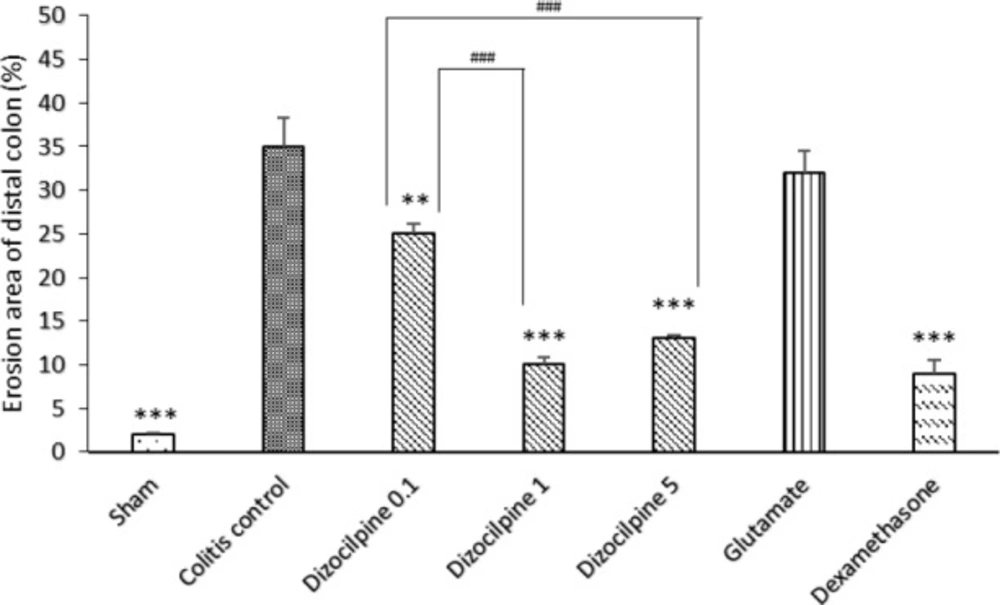
Changes in percentage of erosion area of distal colon (3 Cm) in mice with colitis treated with dizocilpine (0.1, 1 and 5 mg/kg, i.p.), L-glutamic acid (2 g/kg, p.o.) or dexamethasone (1 mg/kg, i.p.). Sham and colitis control groups received an equal volume of normal saline i.p. Animals were treated 24 h prior to induction of colitis and continued daily for 4 days. Data are presented as mean ± SEM. n = 6 per group. **𝑃 < 0.05, ∗∗∗ 𝑃 < 0.001 vs colitis control. ### 𝑃 < 0.001compared to dizocilpine 0.1mg/kg
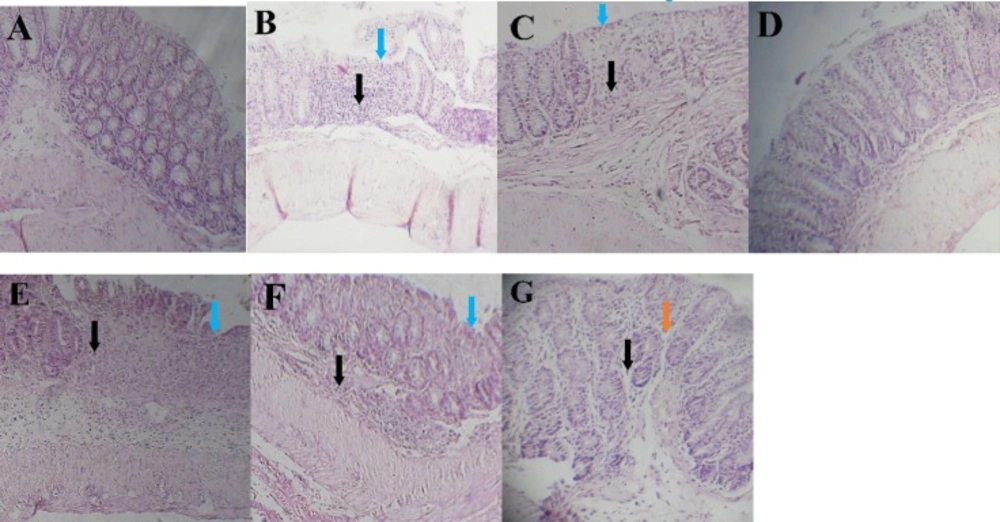
Histopathological appearance of colon sections stained by H&E technique. (A) Sham group, (B and C) Inflamed mucosa in colitis control and L-glutamic acid (2 g/kg) treated groups, respectively. It is associated with mucosal layers destruction, submucosal edema (brown arrows), severely damaged crypt, loss of epithelium (blue arrows) and leukocyte infiltration (black arrows). (d) dexamethasone (1mg/kg, i.p.), (e) dizocilpine 0.1 mg/kg, (f) dizocilpine 1 mg/kg (g) dizocilpine 5 mg/kg (i.p.) improved the extent and severity of the histopathological changes of colitis including inflammation cell infiltration and crypt damages
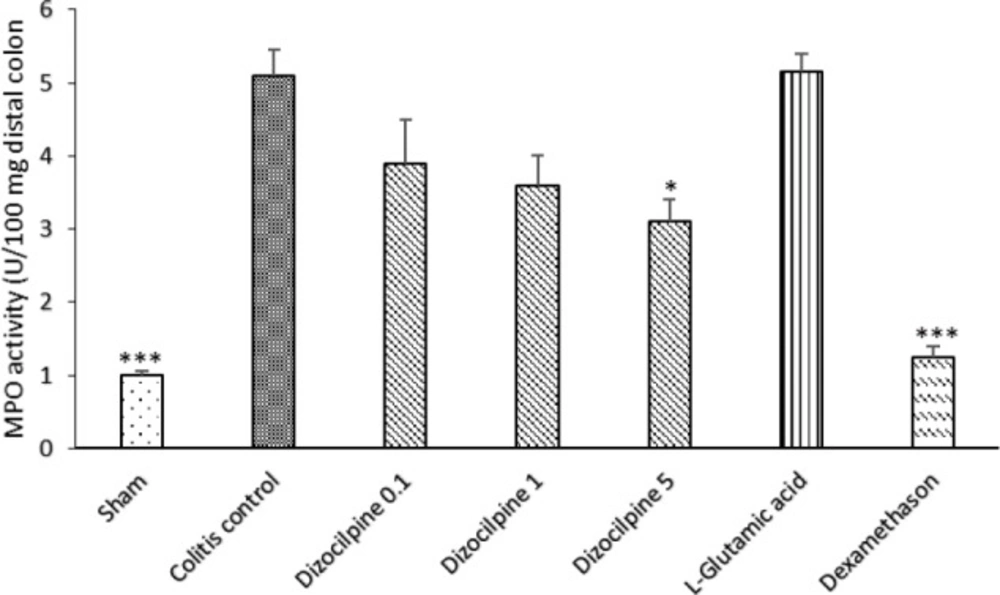
Changes in MPO activity of distal colon of mice with colitis treated with dizocilpine (0.1, 1 and 5 mg/kg, i.p.), L-glutamic acid (2 g/kg, p.o.) or dexamethasone (1 mg/ kg, i.p.). Sham and colitis control groups received an equal volume of normal saline (i.p.). Animals were treated 24 h prior to induction of colitis and continued daily for 4 days. Data are presented as mean ± SEM. n = 6 per group. ∗ 𝑃 < 0.05, ∗∗∗ 𝑃 < 0.001 vs colitis control
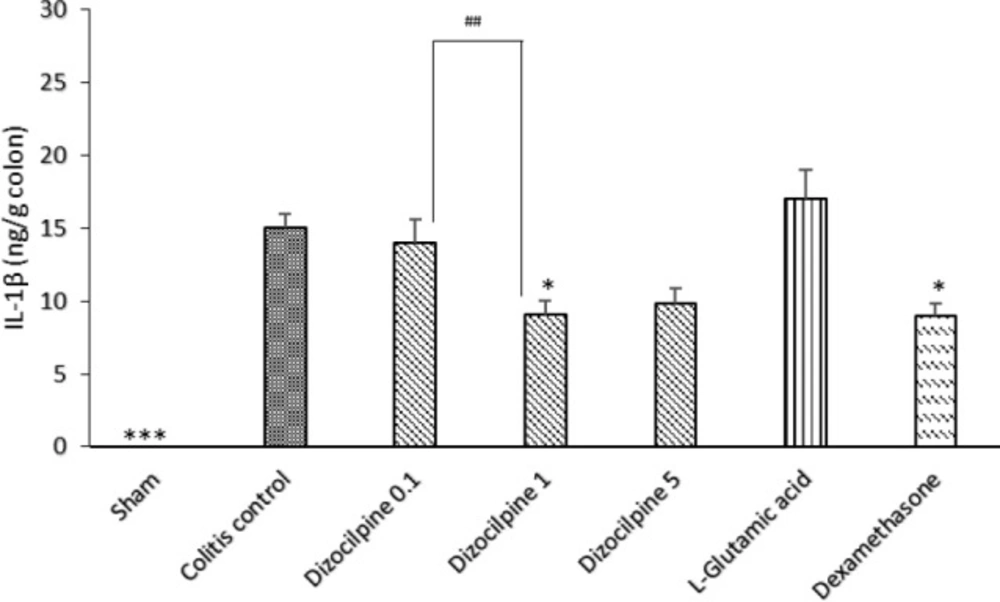
Change in colon IL-1β levels of mice with colitis treated with dizocilpine (0.1, 1 and 5 mg/kg, i.p.), L-glutamic acid (2 g/kg, p.o.) or dexamethasone (1 mg/kg, i.p.). Sham and colitis control groups received an equal volume of normal saline (i.p.). Animals were treated 24 h prior to induction of colitis and continued daily for 4 days. Data are presented as mean ± SEM. n = 6 per group. ∗ 𝑃 < 0.05, ∗∗∗ 𝑃 < 0.001 vs colitis control. ## 𝑃 < 0.05 compared to dizocilpine 0.1mg/kg
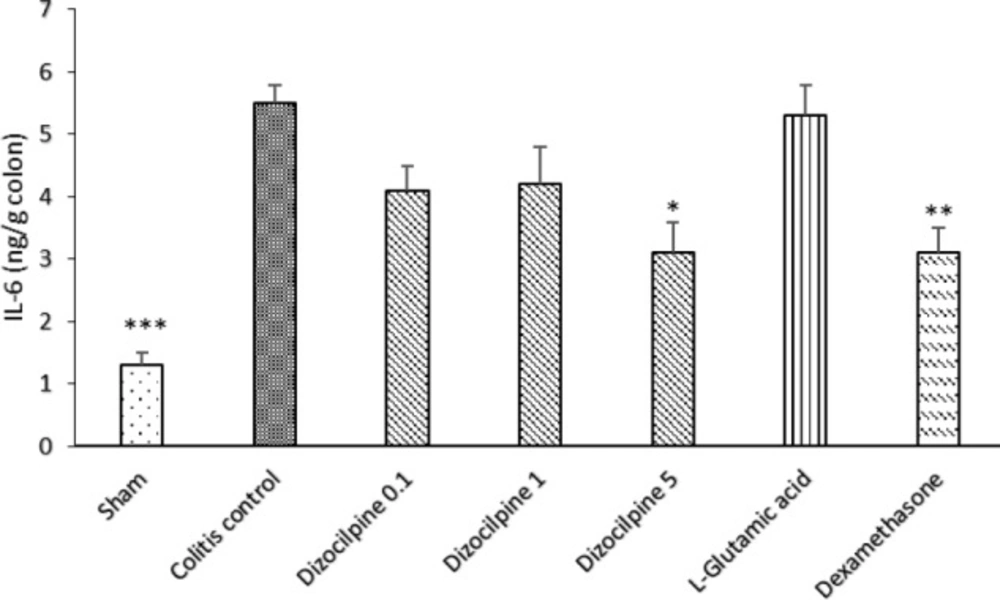
Change in colon IL-6 levels of mice with colitis treated with dizocilpine (0.1, 1 and 5 mg/kg, i.p.), L-glutamic acid (2 g/kg, p.o.) or dexamethasone (1 mg/kg, i.p.). Sham and colitis control groups received an equal volume of normal saline (i.p.). Animals were treated 24 h prior to induction of colitis and continued daily for 4 days. Data are presented as mean ± SEM. n = 6 per group. ∗ 𝑃 < 0.05, ∗∗ 𝑃 < 0.01, ∗∗∗ 𝑃 < 0.001 vs colitis control
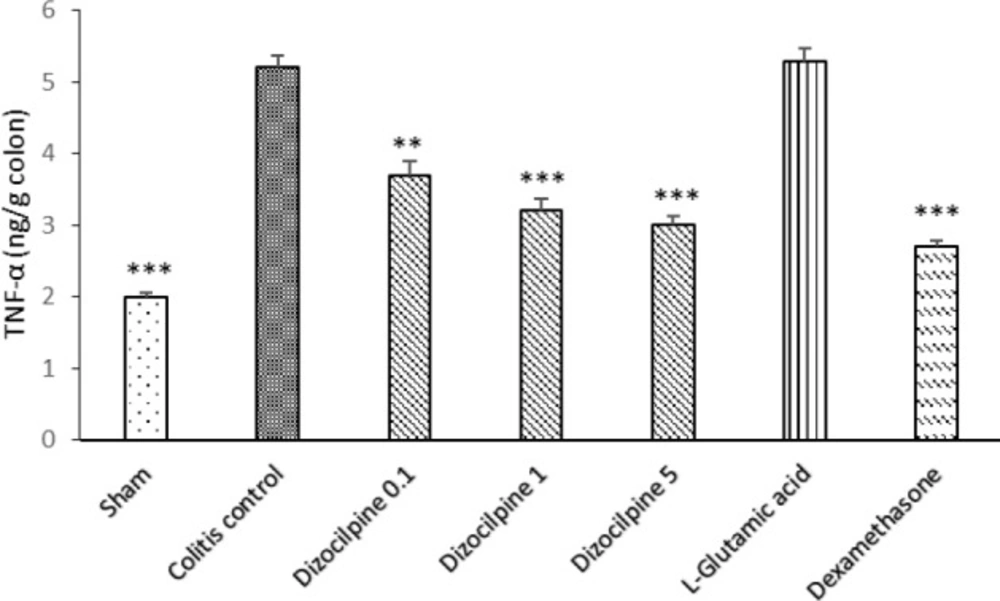
Change in colon TNF-α levels of mice with colitis treated with dizocilpine (0.1, 1 and 5 mg/kg, i.p.), L-glutamic acid (2 g/kg, p.o.) or dexamethasone (1 mg/kg, i.p.). Sham and colitis control groups received an equal volume of normal saline (i.p.). Animals were treated 24 hours prior to induction of colitis and continued daily for 4 days. Data are presented as mean ± SEM. n = 6 per group. ∗∗ 𝑃 < 0.01 and ∗∗∗ 𝑃 < 0.001 vs colitis control
| Groups | Macroscopic colitis score (0-10) | Microscopic score
|
|---|
| Inflammationseverity (0–3) | Inflammationextent (0–3) | Crypt damage(0–4) | Microscopic colitisindex |
|---|
| Sham | 0 (0-0)** | 0 (0–0)** | 0 (0–0)** | 0 (0-0)** | 0±0*** |
| Colitis control | 6 (4-8) | 3 (2-3) | 3 (2-4) | 3 (2-3) | 8.33±0.61 |
| Dizocilpine 0.1 mg/kg | 5 (4-6) | 3 (0-3) | 2.5 (1-3) | 1.5 (1-2)** | 5.83± 0.79 |
| Dizocilpine 1 mg/kg | 3 (2-4)** | 2 (1-2)* | 1.5 (1-3) | 1 (0-2)** | 4.33± 0.76** |
| Dizocilpine 5 mg/kg | 2 (0-4)** | 2 (1-2)* | 1.5 (1-2)* | 1 (0-3)* | 4± 0.45** |
| L-glutamic acid 2 g/kg | 5.5 (4-7) | 3 (1-4) | 2.5 (1-3) | 3 (2-4) | 8±0.93 |
| Dexamethasone 1mg/kg | 4 (2-6)* | 0.5 (0-1)** | 0.5 (0-2)** | 0 (0-1)* | 1.83±0.75*** |
Macroscopic assessment of colon inflammation
The mice were euthanized by ether, 24 h after final treatment. The distal colon was dissected, opened longitudinally, and then macroscopically scored and its length (cm) and weight (mg) were measured. Macroscopic scoring of colonic ulceration and inflammation was done according to Wallace
et al. (
19). Then, the colon was placed on a nonabsorbent white tissue paper and a digital imaging was recorded by a well-adjusted Canon camera (Powershot G9, 12 megapixel, Japan) to determine erosion area. Fiji-win 32 software was used for analyzing the images to measure erosion area (
20).
Then, the colon sample was cut in tree pieces. One piece was used for colon myeloperoxidase (MPO) activity measurement and other pieces for hematoxylin and eosin (H&E) staining and ELISA evaluation respectively.
Measurement of colon MPO activity
The segment specified for MPO activity assessment was immediately frozen in liquid nitrogen and stored at -70 ºC until measurement of MPO activity according to the method reported by Kim
et al. (
21).
Briefly, the colon sample was weighted and then homogenized in 1 mL of potassium phosphate buffer (pH 6, 50 mm) with 0.5% HTAB on ice by a polytron homogenizer at 30 Hz for 4 min. The homogenate was then centrifuged to obtain supernatant (4 °C, 13400g). Supernatant was collected and frozen at -70 °C until used.
Seven microliters of the sample supernatant fluid were added to phosphate-buffered saline (PBS) containing 0.167 mg/mL O-dianisidine dihydrochloride and 0.0005% hydrogen peroxide. Difference in absorbance at 450 nm was recorded at 30 min intervals for 90 second on a plate reader.
MPO activity was reported as units/100 mg of tissue. One unit of MPO activity was expressed as 1 micromole of peroxide degraded per minute at 25 οC.
Histopathological evaluation of colitis
Colon samples were fixed in formalin buffered with PBS (10%) and processed routinely and embedded in paraffin. They cut into sections 4 μm-thick using a microtome. The slides were deparaffinized in xylene and counterstained with H&E using standard techniques and scored as described previously (
22).
Cytokine measurements
The tissue concentration of pro-inflammatory cytokines including TNF-α, IL-1β and IL-6 were assessed using a commercially obtained ELISA kit (Boster company, Pleasanton, CA, USA) according to manufacturer’s protocols.
An antibody specific for each murine cytokine was pre-coated onto the microplate supplied in the kits. Briefly, standards, samples and a biotinylated secondary goat antibody were pipetted into the microplate pre-coated with antibodies specific for each cytokine and incubated at 37 °C for 60 min.
After being thrice washed with PBS, plate incubated with the avidin-biotin-peroxidase complex at 37 °C for 30 min. Following 5 times PBS washing, 100 μL of prepared tetramethylbenzidine (TMB) was added to wells. Then, absorbance was read at 450 nm after addition of TMB stop solution.
Data analysis
Parametric data have been shown as mean ± SEM and analyzed by one-way ANOVA, followed by post hoc Tukey test. Nonparametric data have been displayed as median (range) and analyzed using Kruskal-Wallis test and subsequently Mann–Whitney U test. A value of P < 0.05 was delineated as statistically significant. Statistical analyses were performed with GraphPad Prism (GraphPad software Inc, California, USA).