Patients
Patients from the Department of Internal Medicine, Slovak Medical University, and University Hospital between the January 2008 and January 2013 were included in the study. We investigated the patients with an indication for a long-term warfarin therapy (recurrent VTE and atrial fibrillation) monitored by INR. They were categorized into several groups according to 1) Age: a) older patients ≥ 65 years and b) younger patients (< 65 years); 2) Gender: a) males and b) females; 3) Body mass index (BMI): a) normal weight with BMI < 25, b) overweight /obesity with BMI 25-35, and c) morbid obesity (35 and more); 4) Markers of inherited thrombophilia (FV Leiden and/or prothrombin mutation): a) thrombophilia negative and b) thrombophilia positive; 5) Indication for warfarin: a) atrial fibrillation (AF) and b) venous thromboembolism (VTE); and 6) Co-medication with statins: a) patients using statins and b) non-taking statins. The information about inherited thrombophilia were extracted from the patient´s documentation. All patients were investigated for the presence of VKORC1 and CYP2C9 gene polymorphisms. Sensitivity to warfarin (Sensitivity) was introduced as a new variable representing the genetically determined response to warfarin. Two categories of Sensitivity were assigned: 1) sensitive patients with at least one warfarin sensitive allele and 2) non-sensitive patients with wild-type allele’s presence.
| Genotype | Alleles | N | (%) |
|---|
| VKORC1 | homozygot (GG) | 17 | (36.2) |
| heterozygot (GA) | 23 | (48.9) |
| homozygot (AA) | 7 | (14.9) |
| CYP2C9*2 | wild-type (CC) | 33 | (70.2) |
| heterozygot (CT) | 13 | (27.7) |
| homozygot (TT) | 1 | (2.1) |
| CYP2C9*3 | wild-type (AA) | 44 | (93.6) |
| heterozygot (AC) | 3 | (6.4) |
| homozygot (CC) | 0 | (0.0) |
| Categorical variable | Categories | N | WC (mg per day) (Mean ± SD) | ANOVA | Mann-Whitney test |
|---|
| (factor) | Non-sensitive | 12 | 7.50 ± 0.53 | | |
| Sensitivity | | | | < 0.001a | < 0.001a |
| Sensitive | 35 | 4.46 ± 0.29 | | |
| Non-taking | 25 | 5.21 ± 0.43 | | |
| Statins | | | | 0.568 | 0.683 |
| Taking | 18 | 5.60 ± 0.56 | | |
| Atrial fibrillation | 28 | 4.55 ± 0.35 | | |
| Indication | | | | 0.009a | 0.003a |
| Thromboembolism | 19 | 6.25 ± 0.52 | | |
| Male | 28 | 5.52 ± 0.46 | | |
| Gender | | | | 0.274 | 0.434 |
| Female | 19 | 4.81 ± 0.40 | | |
| Less than 65y | 21 | 6.05 ± 0.51 | | |
| AGE | | | | 0.019a | 0.024a |
| 65y and more | 26 | 4.57 ± 0.36 | | |
| Normal weight | 11 | 5.47 ± 0.57 | | |
Statistically significant values p < 0.05.
Result of Kruskal-Wallis test.
| Software | Intercept A | 95% CI (A) | Slope B | 95% CI (B) |
|---|
| MedCalc | 0.792 | (-0.350 to 1.721) | 0.828 | (0.632 to 1.050) |
| Analyse-It | 0.792 | (-0.171 to 1.761) | 0.828 | (0.623 to 1.006) |
| XL-STAT | 0.988 | (-0.128 to 1.781) | 0.800 | (0.608 to 1.006) |
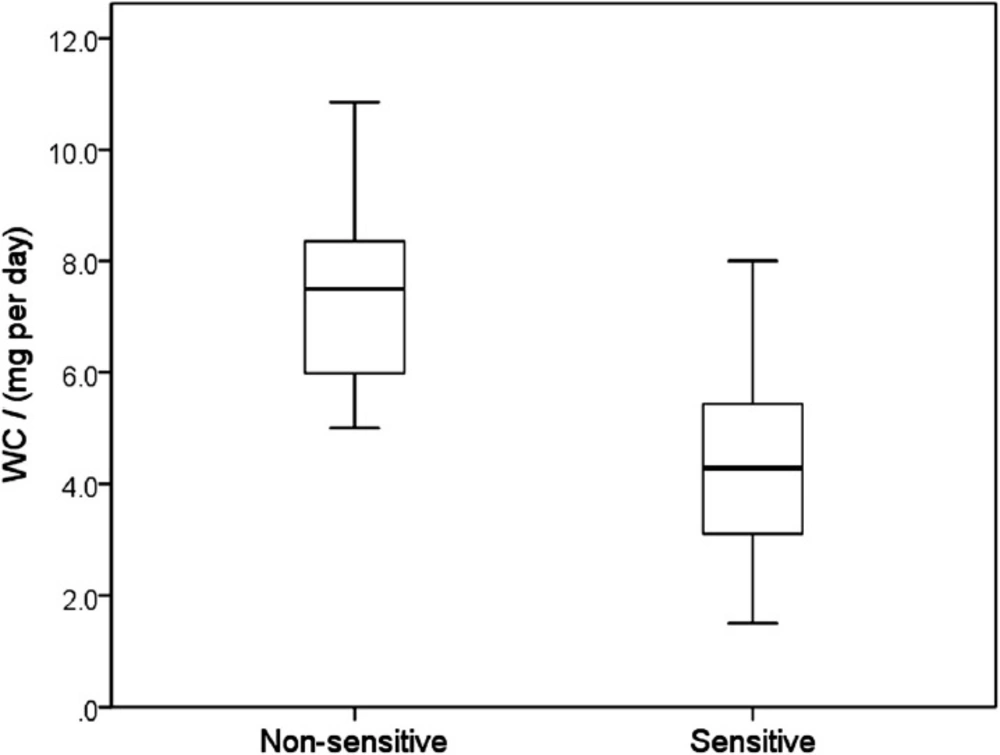
Clinically optimized warfarin dose (WC) according to Sensitivity, characterized by a presence or absence of warfarin sensitive gene polymorphisms (median, 25 – 75 percentiles, minimum and maximum values). Maximum length of each whisker is 1.5-fold the interquartile range. Sensitive patients required significantly lower warfarin doses presented by fully separated box-plots (p < 0.001)
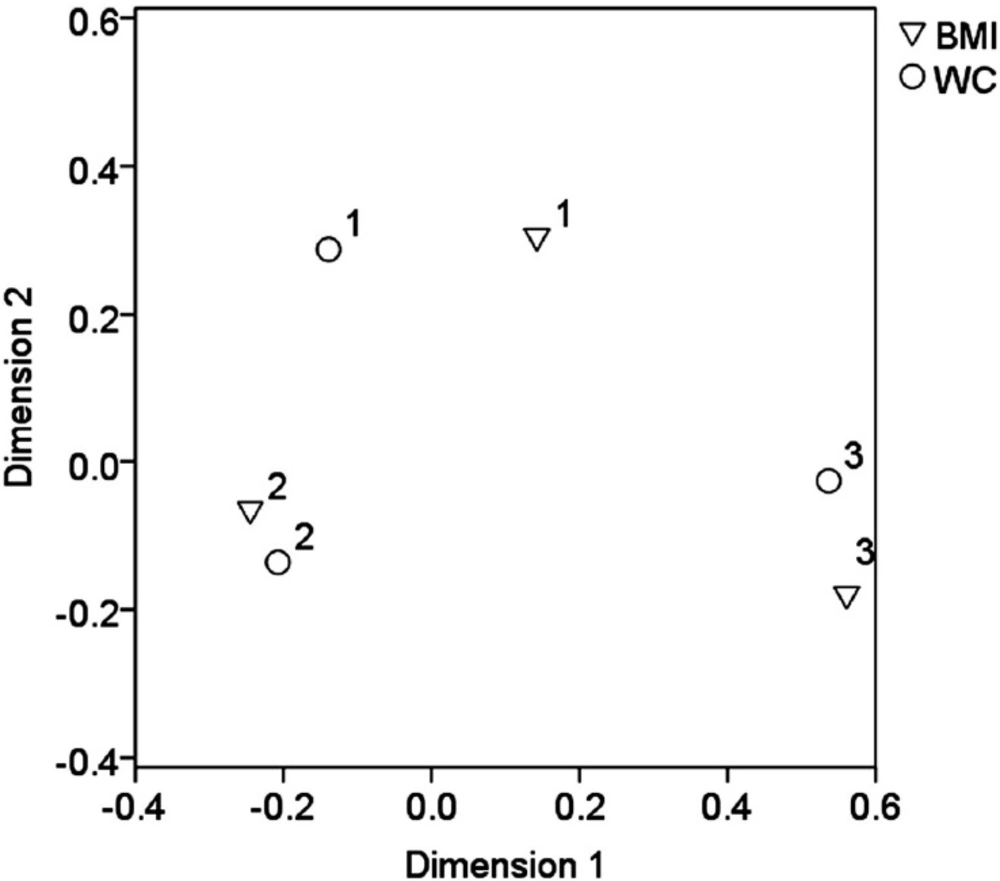
Output of correspondence analysis showing categorical variables BMI and WC in projections on the first 2 dimensions. Cluster 1 represents patients with normal weight and WC less than 3.5 mg per day, cluster 2 the patients with overweight and WC in the range 3.5 – 7.5 mg per day and cluster 3 the obesity/morbid obesity and WC equal 7.5 mg per day and more
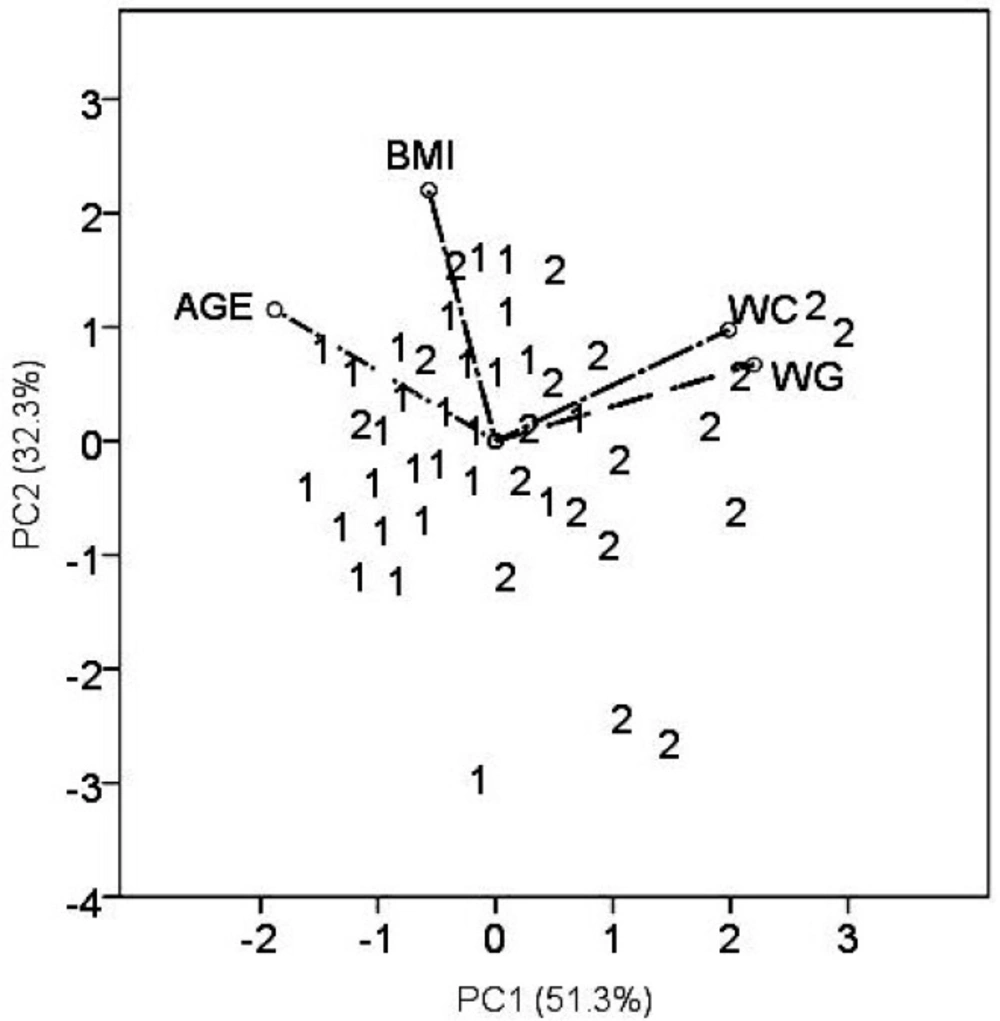
PCA biplot displaying the position of the patient’s samples as well as 4 descriptors in the plane PC2 vs. PC1. Patient’s samples are denoted according to indication for the anticoagulant therapy by numbers: 1 – atrial fibrilation and 2 – thromboembolism
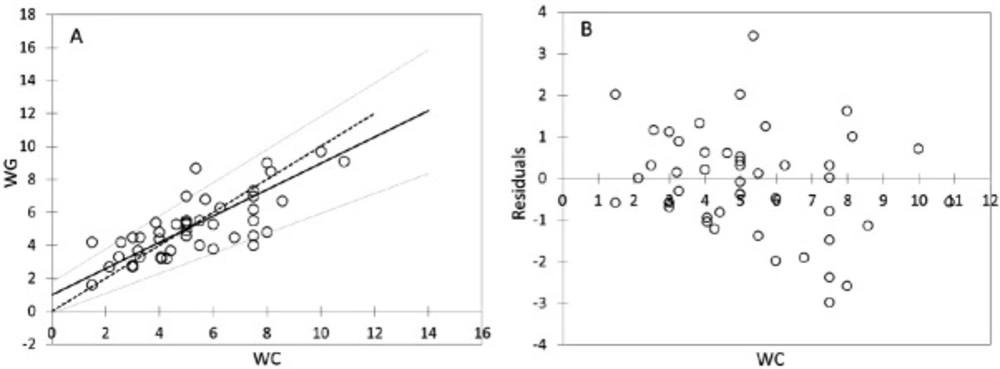
Passing-Bablock regression for comparism WC and WG, N = 47; (A) Scatter diagram with regression line (dashed line) and confidence bands for regression line. Identity line is solid. Regression line equation: y = 0.988 + 0.800x; 95% CI for intercept -0.128 to 1.781 and for slope 0.608 to 1.006 indicated good agreement. (B) Residual plot presents distribution of difference around fitted regression line
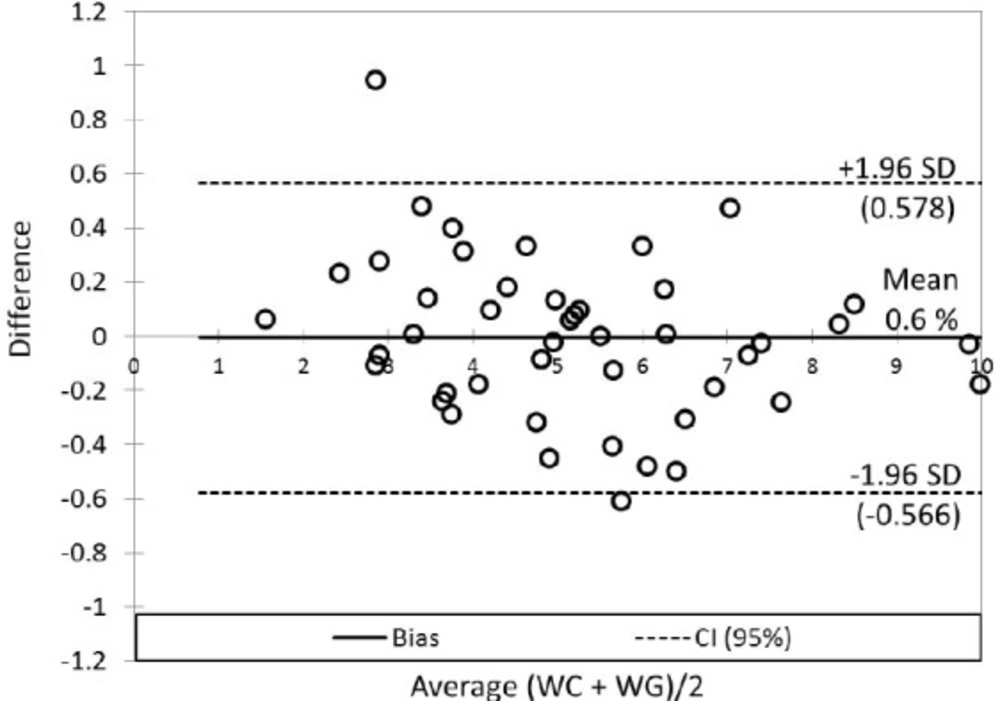
Bland-Altman plot for comparison of the relative differences between WC and WG. The 95% limits of agreement (SD, dashed lines) contain 95.7% of the difference scores (45 objects from 47). The mean difference (bias, solid line) between WC and WG was 0.006 (0.6%; 0.166 mg per day)
“WC” designates warfarin dose established by “clinical” follow up and INR monitoring. The dose was continued/increased/reduced according to actual INR in order to maintain a therapeutic range between 2.0 and 3.0. In patients using non-constant daily doses of warfarin during a week, the mean daily dose of warfarin (mg per day) was calculated from a total dose per week.
“
WG” means a dose of warfarin determined by pharmacogenetic algorithm employing publicly available program www.WarfarinDosing.org (
10). A dose is adjusted according to several variables including patient’s age, sex, ethnicity, race, weight, height, concomitant medication (statins, amiodarone, and azoles), liver comorbidity, and occurrence of polymorphisms, basal INR and a target INR of 2.5.
Thus, WC and WG were used as continuous variables (descriptors). According to the clinically determined warfarin dose (WC), the patients were divided into three categories: 1) ˂ 3.5 mg per day; 2) 3.5 − 7.5 mg per day; and 3) ≥ 7.5 mg per day. Patient’s categories according to the age, BMI, gender, indication for the treatment and concomitant therapy were used as categorical variables (factors). Only patients with a constant therapeutic range of INR between 2.0 and 3.0 were eligible for final statistical evaluation.
Laboratory testing and genetic investigation of VKORC1 and CYP2C9 polymorphisms
Prothrombin time (PT) was tested by a standard method using the reagent Thromborel®S and the BCS Coagulation Analyzer (Boehringer Coagulation System). The results were expressed in INR, which is prothrombin time ratio raised to the power of the ISI (International Sensitivity Index) value for the tissue factor reagent used in analytical system. PT testing was performed by laboratories Synlab Slovakia, s.r.o. and Medirex, s.r.o.
DNA was extracted and analysed by routine PCR analysis (NucleoSpin Blood, Macherey-Nagel). Genotyping for the CYP2C9*2 and CYP2C9*3 alleles was done by LightMix Kit human CYP 2C9*2 and CYP 2C9*3 (fy Roche) and for VKORC1 by LightMix Kit human VKORC1 C1173T and G-1639A (fy Roche) using LightCycler 2.0 (fy Roche). Genetic testing was performed in laboratories Gendiagnostica s.r.o. Bratislava Center, Slovakia and Medical Genetics, University Hospital Bratislava, Slovakia.
Statistical analysis
For normality’s testing, two methods were performed: relying on statistical tests (Shapiro-Wilk’s test) (
11) and visual inspection (Q-Q plots) (
12). The impact of the target categorical variable Sensitivity, as well as other factors, was investigated by Analysis of variance (ANOVA) and the non-parametric Kruskal-Wallis test and Mann-Whitney test (for pair-wise comparisons) (
13).
The correspondence analysis was applied for the visualization of the relationship between BMI and
WC; correlation analysis for evaluation interrelations between
WC and
WG was used; principal component analysis for data visualization was applied (
14). The comparison of
WC and
WG was performed by non-parametric Passing-Bablok method (
15). Breusch-Pagan or White tests were used for examination of heteroscedasticity (
16). Cusum test was used for the determination of linearity between
WC and
WG. Bland-Altman plot (
17) was used for visualization differences between
WC and
WG, respectively bias determination. A
p-value of less than 0.05 was considered to be statistically significant. Several commercial software packages were applied, particularly SPSS ver. 19 (
18), Analyse-It, ver. 2.12 (
19), MedCalc ver. 10.4.0.0 (
20), XLSTAT 14.4 (
21) and StataIC 12 (
22).