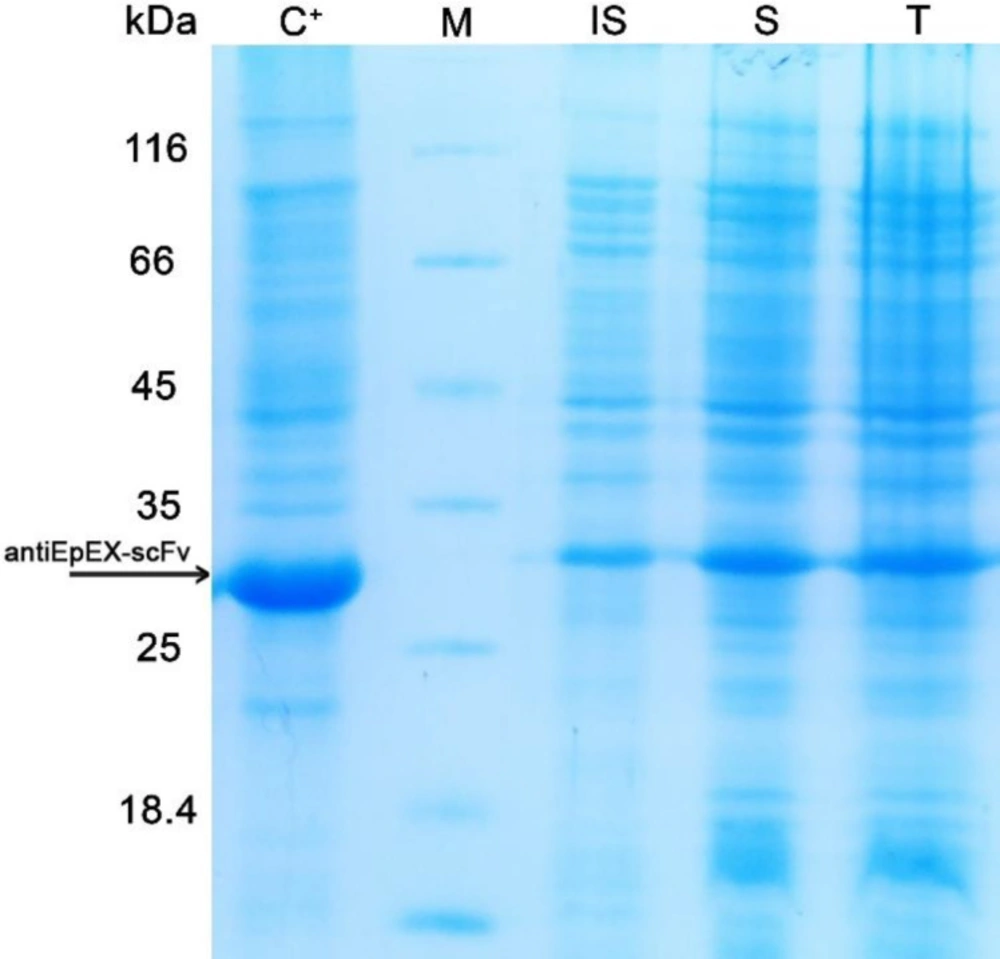
Before optimization, to examine the level of the 4D5MOC-B scFv fragment expression in
E. coli strain SHuffle™ T7, 5 mL of the pre-cultured cells harboring pET22b (+)-4D5MOC-B scFv was inoculated into 50 mL of M9 minimal medium and induced at mid-log phase (OD
600 of 0.6 nm) with 1mM IPTG at 30 ᵒC for 24 h. Following induction with IPTG, the bacterial cells were lysed by ultrasonication. The cell lysate before centrifugation, centrifugal supernatant, and pellet fractions were analyzed by SDS-PAGE. The recombinant protein was detected in both soluble and insoluble fractions (
Figure 1) and existed in soluble form as 88–90% of the total 4D5MOC-B scFv fragment.
RSM-BBD methodology was successfully utilized to investigate the individual and interaction effects of post-induction temperature, IPTG concentration, and cell density at induction time on the total 4D5MOC-B scFv fragment expression and solubility in M9 minimal medium. The three-level BBD with 15 runs was employed (
Table 2).
Table 2 summarizes the results achieved from the BBD experiments for the total 4D5MOC-B scFv fragment expression and solubility. Based on the experimental data, quadratic models represented by the following equations can describe the correlation between total 4D5MOC-B scFv fragment expression (μg/mL) (Equation 1) or solubility (Equation 2) and three various variables.
Equation 1.
Equation 2.
Where Y is the response (antiEpEX-scFv expression level), and A, B and C are letters used for IPTG concentration, OD
600nm before induction, and the temperature respectively. Based on designed experiments, a wide range of results (350.07 to 1092.55 μg/mL) was obtained for the soluble expression level and (454.667 to 1229.030 μg/mL) for the total expression level of the recombinant protein for all 15 experiments (
Table 2). The highest total protein level (1229.030 μg/mL) was obtained when cells were induced at 30 ᵒC with 0.1 mM IPTG for 24 h.
Using the Design-Expert software, quadratic regression models developed for optimization of the total 4D5MOC-B scFv fragment expression as well as solubility were confirmed by analysis of variance (ANOVA). The results of ANOVA values for solubility and protein expression (μg/mL) are represented in Supplementary
Tables 1 and
2 respectively. The F-value of the model developed for optimization of the 4D5MOC-B scFv fragment solubility (48.73) implies that the model is significant. There is only a 0.02% chance that an F-value of the proposed model can occur due to the noise. For total 4D5MOC-B scFv fragment expression, ANOVA also showed the significance level of the model (F-value = 33.66). The Low
P-value (0.0006) of the model resignifies the significance of the model. Moreover, the mathematical analysis demonstrated that the lack of fit values (
P = 0.8855, and 0.6703 for solubility and total protein expression responses respectively) of the models were not significant, indicating the suitable predictive performance of selected models. The R
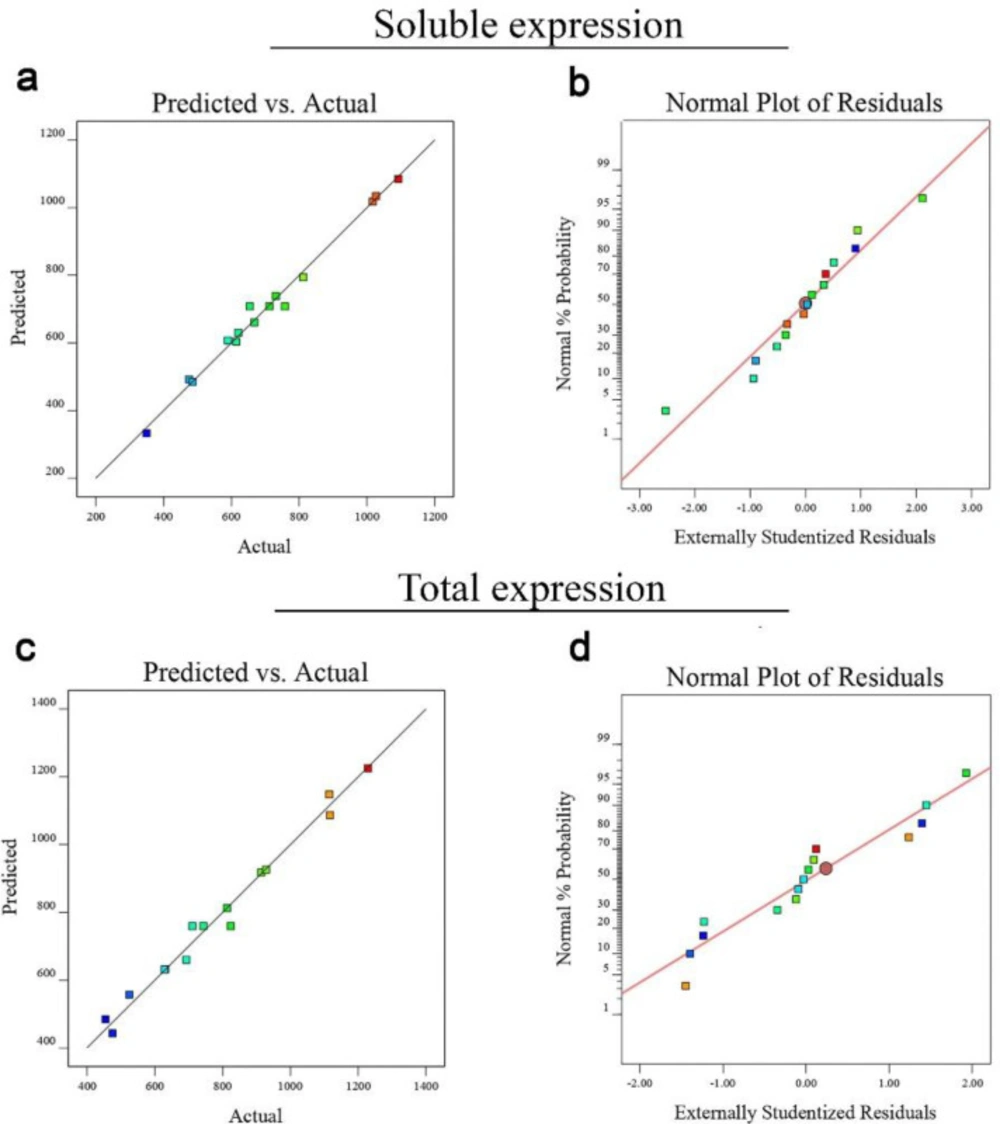
2 values for the models developed for optimization of the antiEpEX-scFv solubility and total protein expression were found to be 0.9887 and 0.9838 respectively, which show that values predicted by RSM models are very well correlated with the experimental data. Furthermore, the values of the Predicted R² are in reasonable agreement with the values of Adjusted R² in both developed models. As shown in normal probability plots of the studentized residuals, the significance and adequacy of the proposed models were also confirmed by the linear trend of data points (
Figure 2). Moreover, predicted and experimental values are in good agreement for both responses studied here (
Figures 2a and 2c). As a result, these models can be used to navigate the design space.
A
P-value less than 0.05 was considered statistically significant. For solubility response, except B2 and C2, all the linear (A, B, and C), quadratic (A
2) and interactive terms (AB, AC, and BC) were significant as observed from the
P-values of the model terms. In the case of total protein expression, all the linear terms of the model and the interactive effect of IPTG concentration- cell density before induction were found to be significant, whereas quadratic (A
2, B
2, and C
2) and the interactive effect of cell density before induction- post-induction temperature, and IPTG concentration- post-induction temperature indicated no significant impact. Furthermore, it was concluded that post-induction temperature had the largest effect on both responses, followed by IPTG concentration and OD
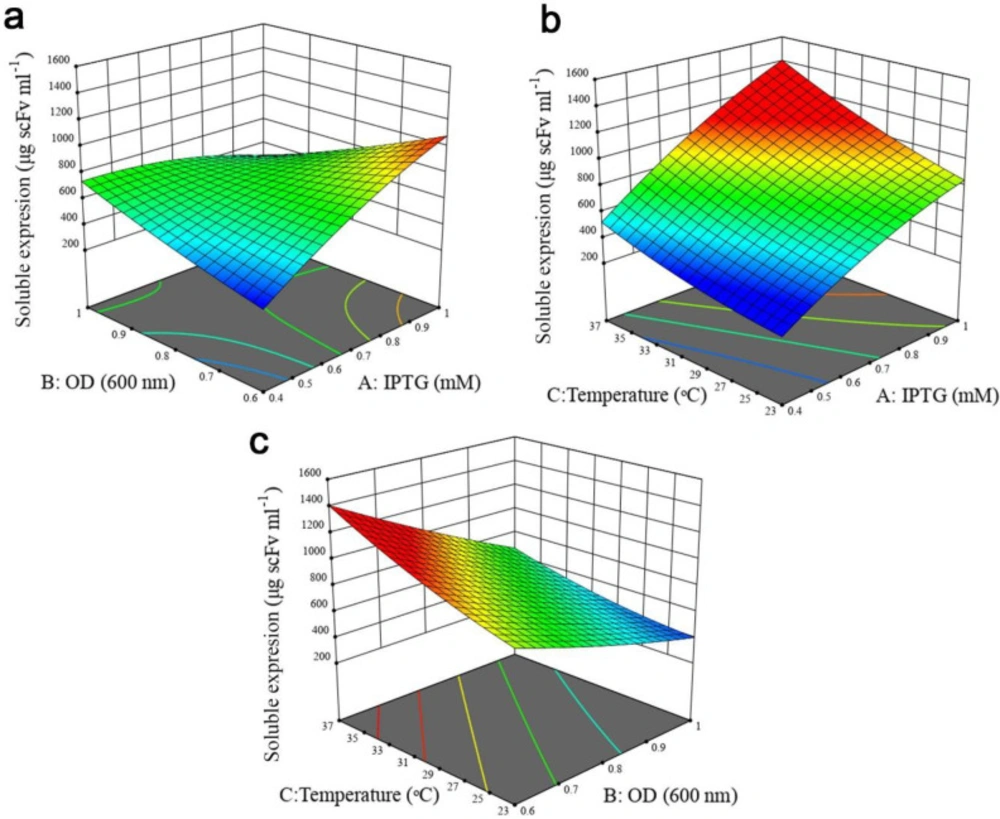
600nm before induction. The interactive effects between independent variables on two responses were studied using three-dimensional response surface graphs. Based on ANOVA results (Tables S1 and S2, Supplementary file), the interaction of IPTG concentration and OD
600nm before induction was significant (
P < 0.0001). As illustrated in
Figure 3a, when induction temperature was kept at 30 °C, protein solubility increased with both variables. Although increasing cell density before induction at lower IPTG concentration enhanced antiEpEX-scFv solubility, an increase in OD
600 at higher IPTG concentration had a negative effect on the soluble expression of the protein. According to the low
P-value (0.0161) of the coefficient AC (Table S1, Supplementary file), there is also a significant interaction between IPTG concentration and induction temperature. As depicted in
Figure 3b, antiEpEX-scFv soluble expression increased with IPTG concentration, while the increase in induction temperature had only a minor effect on protein solubility. Although increasing the temperature has a low effect on the soluble expression of the protein at lower IPTG concentration, it will be more effective at a higher concentration of the inducer. As depicted by the low
P-value of the coefficient BC of 0.0114 (Table S1, Supplementary file), there is significant interaction between these two variables. The dependency of the temperature and OD
600nm before induction on protein solubility when the concentration of IPTG was kept constant (0.7) is shown in
Figure 3c. According to this graph, more solubility was obtained by the increase in temperature, while protein soluble expression decreased with the increase in OD
600nm.
Figure 4a illustrates the positive effect of IPTG concentration and OD
600nm before induction on the total expression of recombinant protein while the temperature was kept at 30 °C. However, an increase in OD
600nm at higher IPTG concentration led to a decrease in total protein production.
Figure 4b declares the positive impact of concentration of IPTG and temperature when OD
600nm was kept constant (0.7). Total protein expression significantly was enhanced with IPTG concentration, especially when the temperature was high. Interestingly, based on ANOVA results, the interaction of these variables was insignificant due to the high
P-value of the coefficient AC (
P = 0.2654). Finally, the high
P-value of the coefficient BC of 0.0564 indicates that the interaction between OD
600 and temperature is not significant (
Table 3).
Figure 4c explains that the total protein production of the antiEpEX-scFv protein will be improved by increasing temperature while the increase in the value of the OD
600 has a negative effect on the total protein expression.
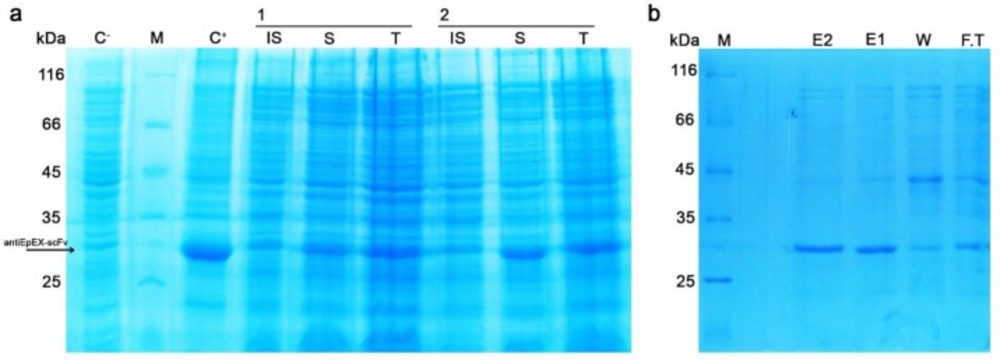
The optimal culture conditions as achieved from the solubility model at the maximum point were calculated to be as 1, and 0.7 for IPTG concentration, cell density before induction (OD
600), and post-induction temperature of 23 ᵒC, respectively. The maximum predicted value of 720.74 μg/mL was in good correlation with the experimentally obtained value 693.56 μg/mL predictable total expression value was also experimentally verified. Using the predicted optimum conditions determined by the solubility model, experiments were also conducted in duplicates for validation of the total expression model. Validation of the total expression model contributes to the total 4D5MOC-B scFv fragment expression of 842.51 μg/mL, which is close to the predicted production of 781.952 μg/mL (
Figure 5a). So, the accuracy of the BBD models was fully confirmed. Moreover, using the Ni-NTA affinity chromatography column, the recombinant antiEpEX-scFv protein was purified from soluble fraction followed by BCA analysis. 281.578 μg/mL of the soluble protein was obtained in optimum fermentation conditions (
Figure 5b).