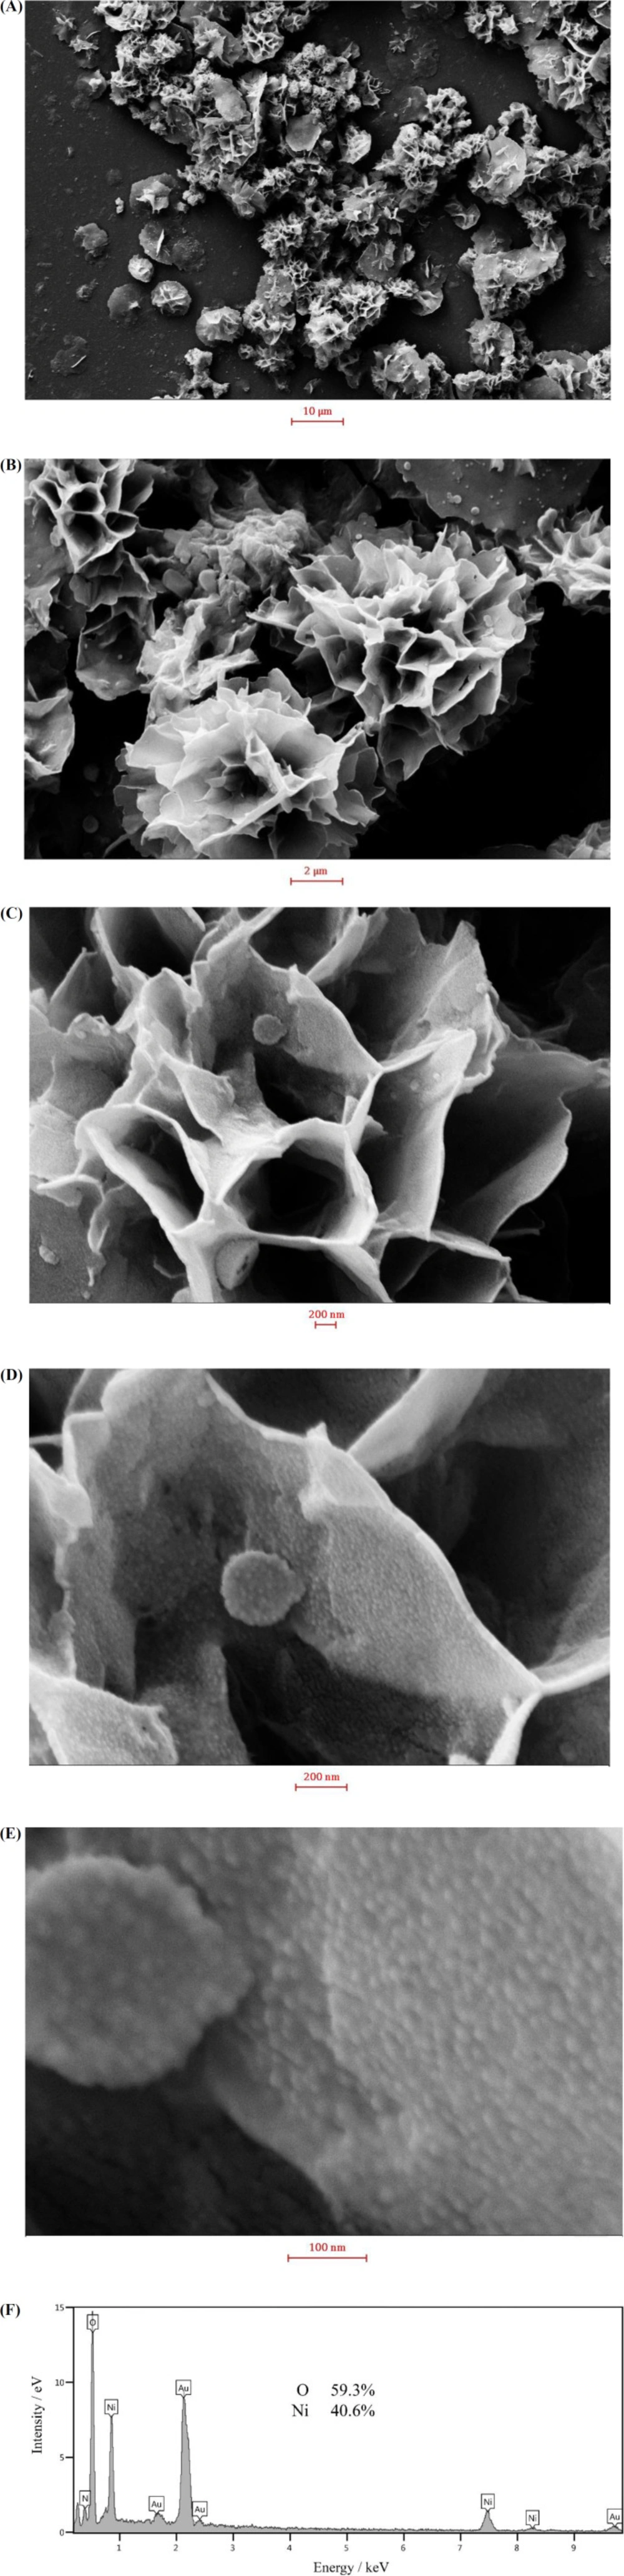
In order to investigate the morphology of the nanosheets, the synthesized nanostructures were examined by FESEM. FESEM images recorded at different magnifications and an EDS spectrum are shown in
Figure 1. At low magnifications, the nickel hydroxide particles resemble to followers comprising interwoven sheets. The sheet thickness was estimated to be 35 ± 9 nm. At high magnifications, it can be seen that the sheet surfaces are covered by very small particles of 13 ± 3 nm. This special morphology provides holes and cavities which accelerate the mass transport of species, when the nickel hydroxide sample being in contact with an electrolyte. Meanwhile, the small nanoparticles present on the sheet surfaces increase the real surface area and hence the (re)activity of nickel hydroxide. EDS spectrum of the sample confirmed the purity and the chemical composition of the prepared sample to be Ni(OH)
2. The formation of flower-like nickel hydroxide nanosheets can be explained by the wet-etching model (
38). Fluoride ions act as coordination ligands, forming holes and cavities by fluoride-mediated coordination-assisted etching during the hydrothermal process of nickel ions (
38).
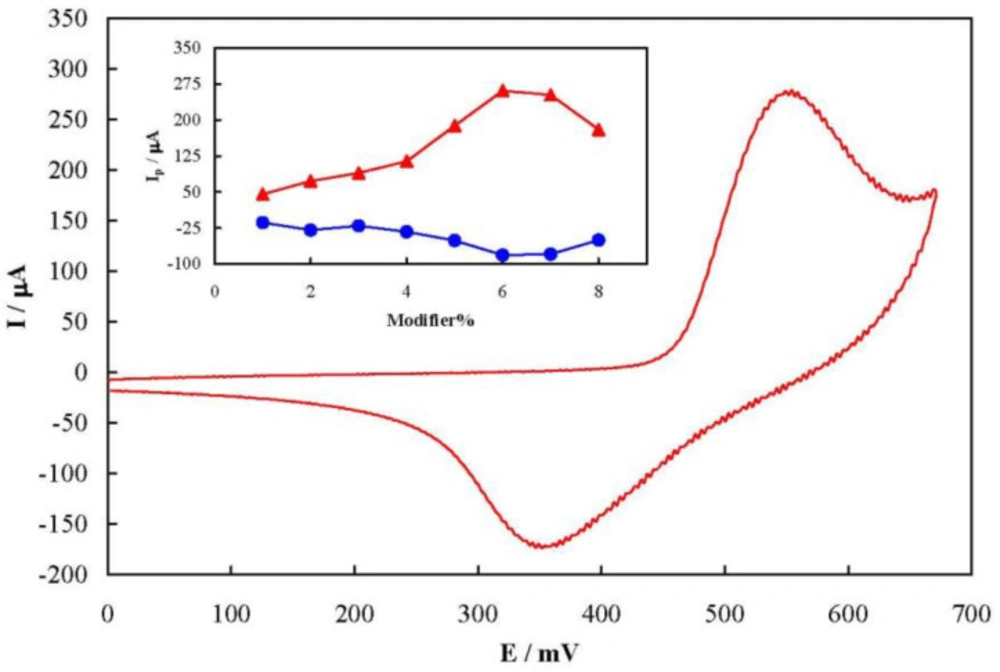
Figure 2 shows a typical cyclic voltammogram of MCPE prepared with 6% of the modifier recorded at a potential sweep rate of 50 mV sec
-1 in 100 mmol L
-1 NaOH solution. The voltammogram pattern is similar to those reported previously in which the redox process is related to the solid state Ni
2+/Ni
3+ transition in an alkaline solution (
16,
18). A pair of well-defined peaks with a mid-peak potential of 454 mV and a peak-to-peak potential separation of 200 mV appeared in the voltammogram. The peak-to-peak potential separation is higher than the theoretical value of zero indicating a quasi-reversible kinetics. The value of full width at half height of the anodic peak is estimated to be >140 mV. This is greater than the 90 mV, the theoretical value for non-interacting one-electron surface redox species (
39). Therefore, there were repulsive forces between nickelaceous species immobilized on the MCPE surface (
40).
The influence of the modifier amount on the MCPE voltammetry response is represented as dependency of the anodic and cathodic peak currents on the percentage of the modifier in MCPE in the inset of
Figure 2. Based on the results, both anodic and cathodic peak currents increased upon increment of the amount of flower-like nickel hydroxide nanosheets up to 6% in the carbon paste, followed by a decrease due to the decrement in the electrical conductivity of the paste by further increase of the nickel hydroxide nanosheets. Therefore, 6% was selected as the optimum modifier amount in the fabrication of MCPE throughout the study.
Chemical structure of famotidine.
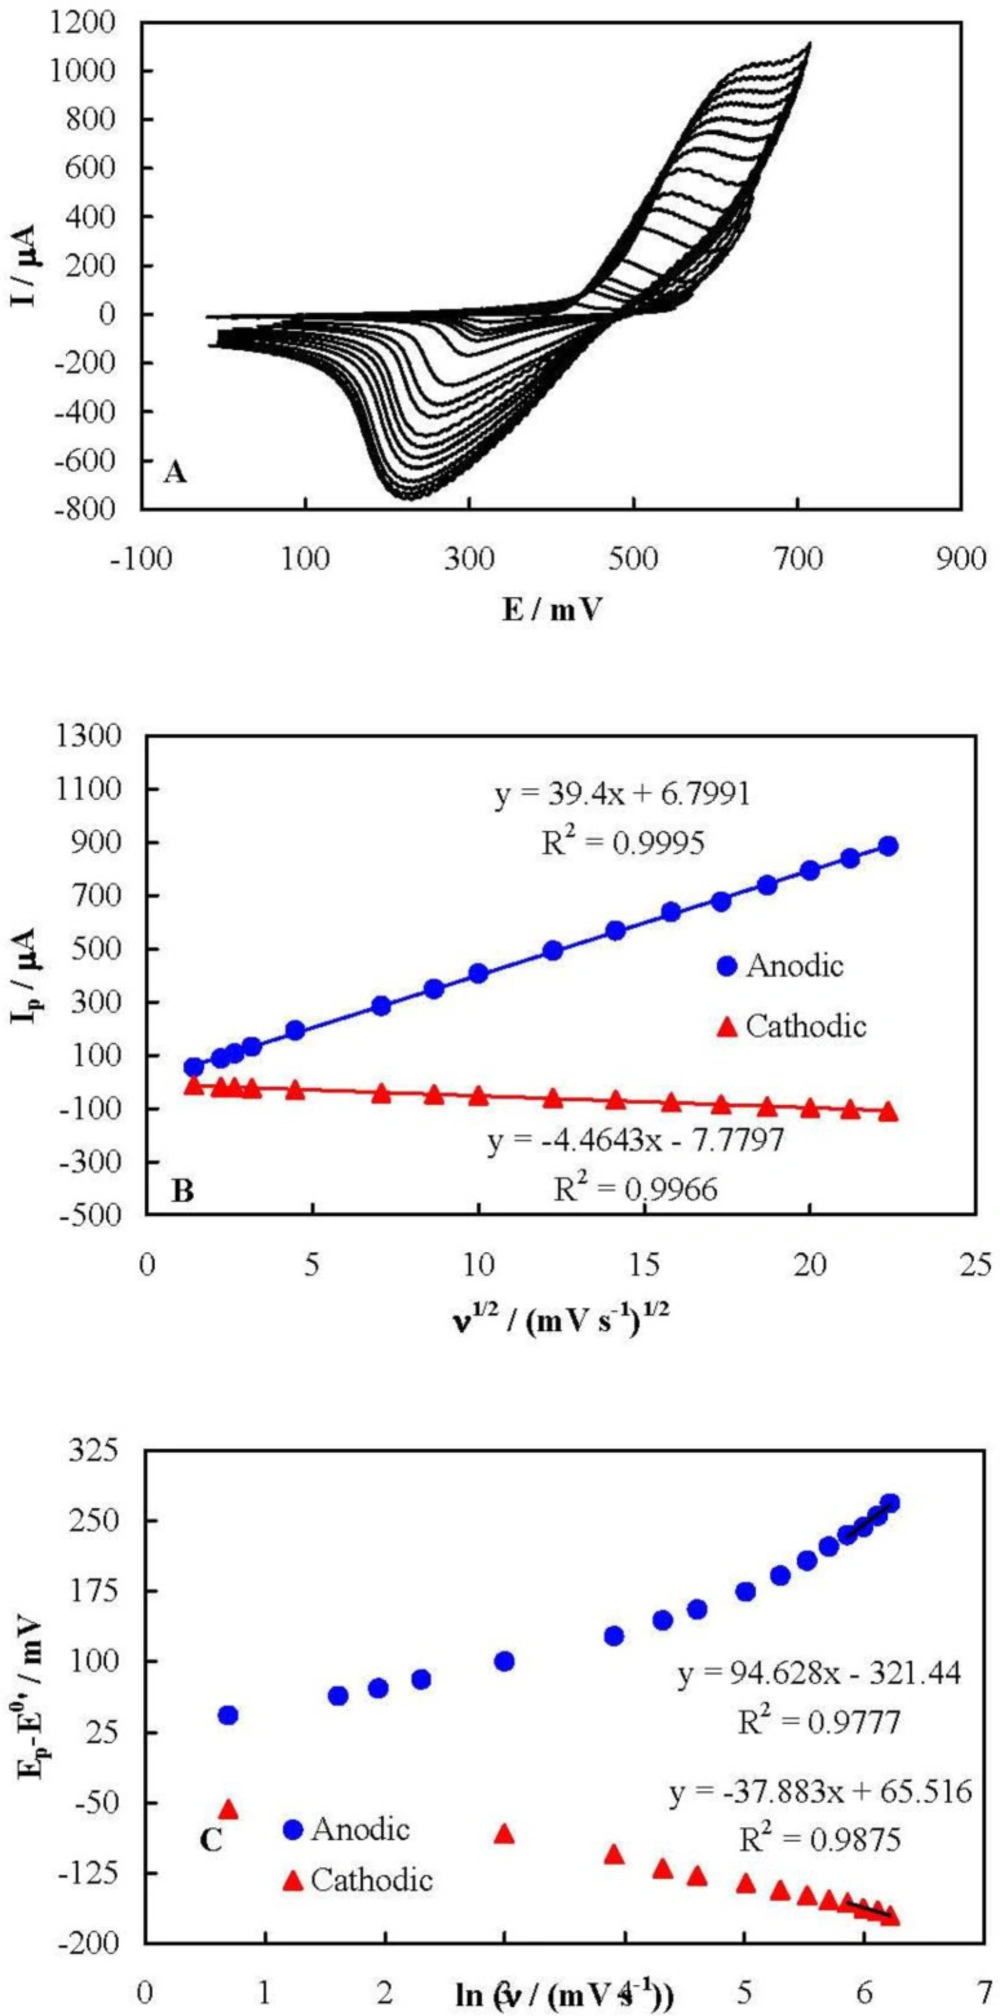
Figure 3A represents cyclic voltammograms of MCPE recorded in 100 mmol L
-1 NaOH solution at different potential sweep rates in a wide range of 2 to 500 mV sec
-1. Upon increasing the potential sweep rate, the peak current increased and the peak potential shifted in an irreversible-kinetic manner for both anodic and cathodic peaks. It can be deduced from these voltammograms that both the anodic and cathodic peak currents depended linearly on the square root of the potential sweep rate in all of the tested potential sweep rates, as shown in
Figure 3B. It should also be noted that the peak currents did not shown a linear dependency on the potential sweep rate, even at low potential sweep rate values, as is shown Figure S1 in Supplementary file. This behavior indicates that the kinetics of the redox process of the nickelaceous species on the surface of MCPE was purely controlled by diffusion without any limitation arising from the electron exchange resistance between the mediator and the underlying current collector. This implies that the flower-like nickel hydroxide nanosheets had a high electron transfer rate. It is noteworthy that there has been a limitation in the electron exchange between the nickelaceous species in some other nanostructures of nickel hydroxide, confirming from the dependency of the peak currents on the potential sweep rate at slow potential sweep rates (
16-
18). However, such a limitation was not observed here for the flower-like nickel hydroxide nanosheets.
The kinetic parameters of the nickel redox species can be obtained using the Laviron Equations (
39). When the peak-to-peak potential separation is greater than 200/n mV (n is the number of exchanged electrons), these Equations are applicable:
Epa = E0′ + X ln [(1-αs)/m] (Equation 1)
Epc = E0′ + Y ln [αs/m] (Equation 2)
ln ks = αs ln (1-αs) + (1-αs) ln αs - ln (RT/nFν) - αs (1-αs) nF(Ep-E0’)/RT (Equation 3)
X = RT/(1-/αs) nF (Equation 4)
Y = RT/αsnF (Equation 5)
m = (RT/F) (ks/nν) (Equation 6)
where E
p is the anodic or cathodic peak potentials, E
0’ is the formal potential (equal to mid-peak potential of the voltammograms recorded at low values of ν), α
s, k
s,and ν are the electron transfer coefficient, apparent charge transfer rate constant and potential sweep rate, respectively. Based on these Equations,
Figure 3C shows the plots of (Ep-E
0') on ln (ν) for both the anodic and cathodic peak potentials. (E
p-E
0') showed a linear dependency on the natural logarithm of the potential sweep rate for the potential sweep rates greater than 350 mV sec
-1. Using the slopes and intercepts of the plots and Equations 1 to 6, the values of α
s and k
s were obtained as 0.47 and 0.23 sec
-1, respectively.
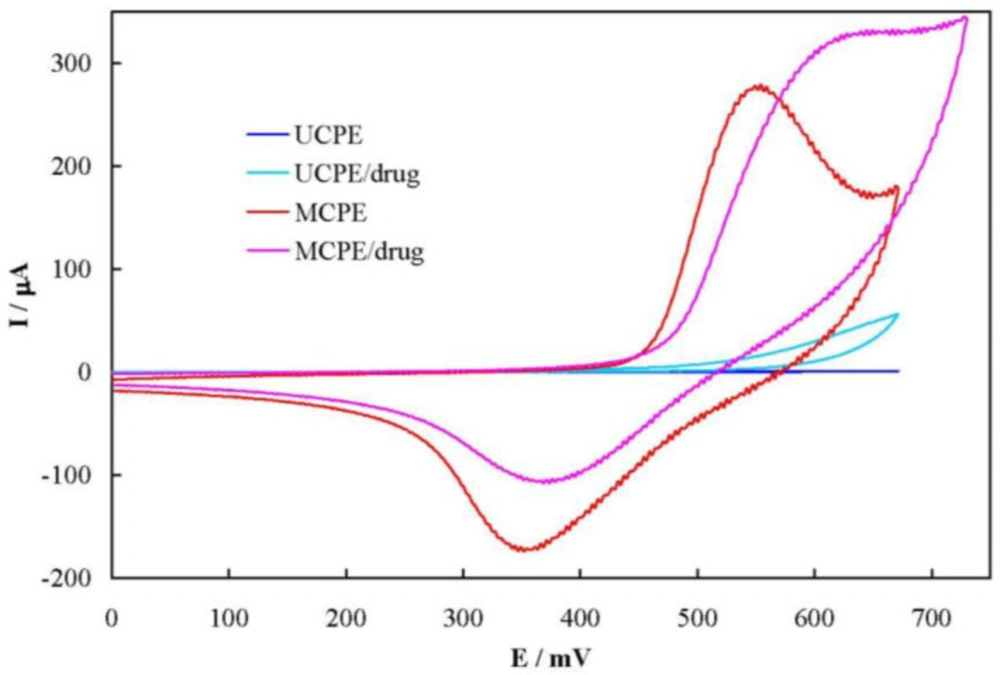
Figure 4 shows cyclic voltammograms of UCPE and MCPE in 100 mmol L
-1 NaOH solution in the absence and presence of 6.0 mmol L
-1 famotidine, recorded at the potential sweep rate of 50 mV sec
-1. For UCPE, a sluggish and ill-defined anodic peak current is appeared in the voltammogram in the presence of famotidine. Using MCPE; however, the anodic peak current and the related charge increased by 18 and 60% in the presence of the drug, respectively. In addition, MCPE shows a decrease in the corresponding cathodic current and the related charge by 37 and 63%, respectively. Based on these results, famotidine was oxidized by the higher valence nickel species (Ni
3+), resulting in formation of lower valence one (Ni
2+). Therefore, the apparent concentration of Ni
2+ increased which in turn caucused increment in the anodic peak current and charge. Similarly, the reaction between the drug and Ni
3+ continued in the backward sweep, resulting in the decrease of the Ni
3+ concentration and decrement in the cathodic peak current and charge. This mediated oxidation (EC’ mechanism) of famotidine can be continued through the external electrical circuit by prolonged application of a positive potential. The cathodic current in the reverse sweep did not disappeared, indicating that the reaction between famotidine and Ni
3+ was the rate-determining step in the overall oxidation process. Moreover, the onset potential of the anodic peak in the presence of the drug shifted toward more positive values, indicating the presence of a strong interaction between famotidine and Ni
3+ at the MCPE surface.
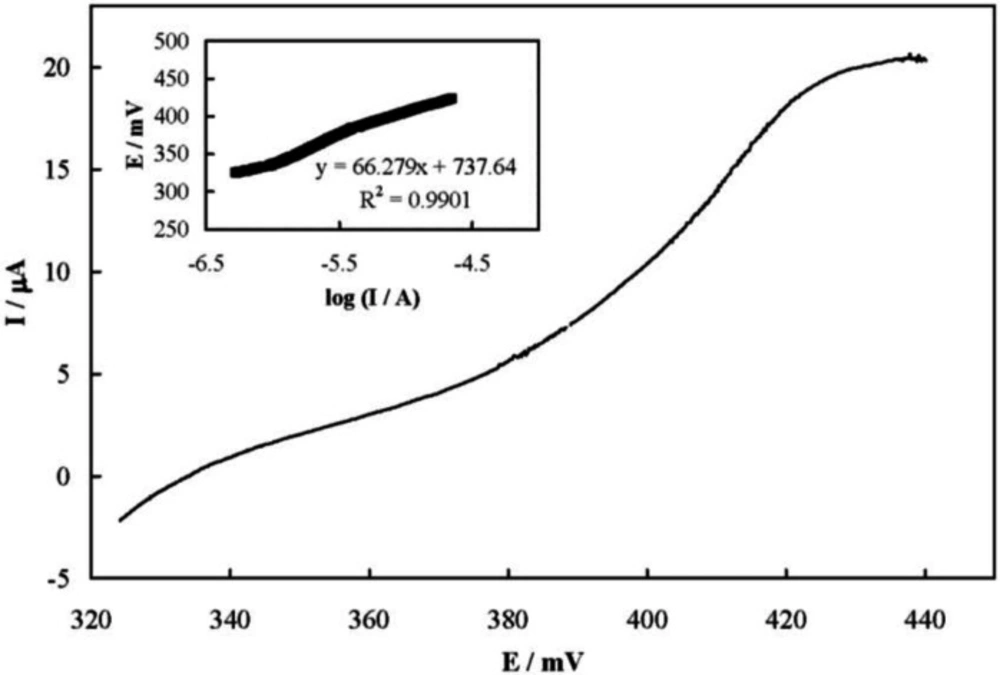
Figure 5 shows a steady-state current-potential plot recorded for the electrooxidation of famotidine on the MCPE surface which represents a S-shaped plot. The transfer coefficient of Ni
2+ oxidation in the presence of famotidine (α) was obtained from the Tafel plot to be 0.4 (inset of
Figure 5).
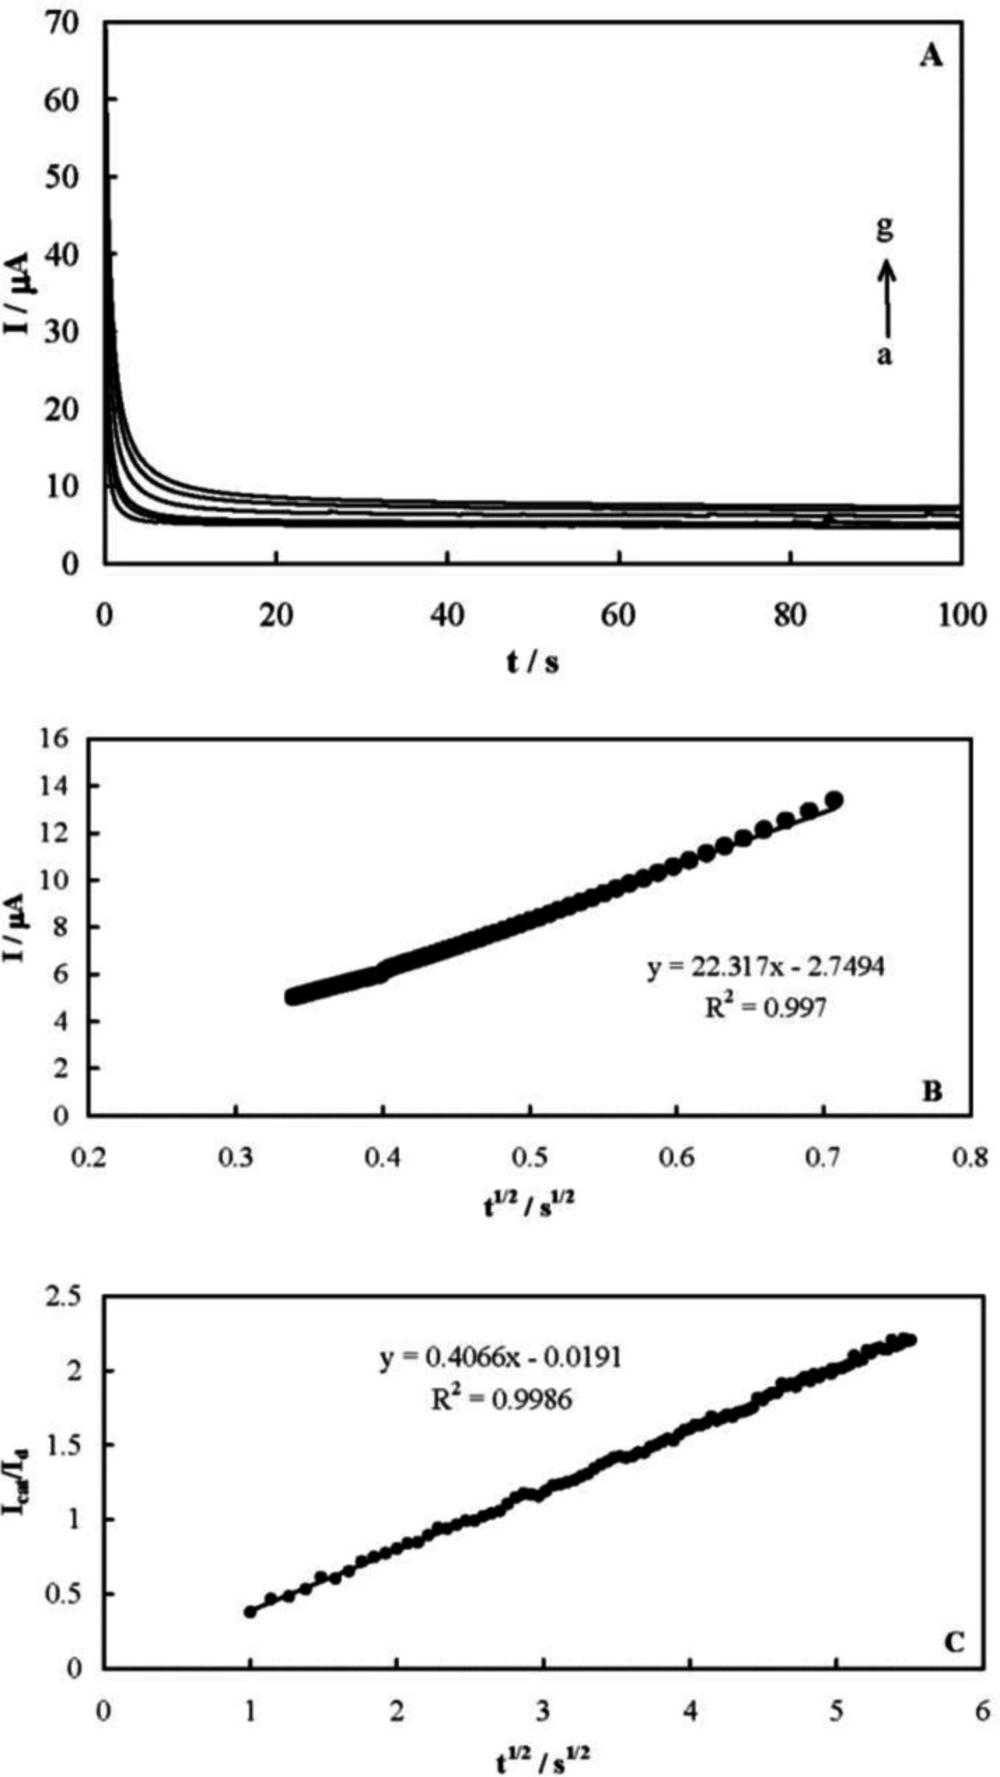
The chronoamperometric responses of MCPE were recorded to measure the catalytic rate constant of famotidine electrooxidation on the MCPE surface after setting the working electrode potential to a desired value.
Figure 6A shows the obtained chronoamperograms in the absence and presence of famotidine over a concentration range of 0.08-0.8 mmol L
-1. A potential step of 580 mV was applied during the measurements. The net currents with respect to the mines square root of time resulted in a linear dependency (
Figure 6B), indicating a diffusion-controlled process for the electrooxidation of the drug. The coefficient of diffusion of famotidine can be obtained according to the Cottrells’ Equation and using the slop of this line (
41):
I = nFAD1/2C*π-1/2 t-1/2 (Equation 7)
where D is the coefficient of diffusion and C* is the bulk concentration. A mean value for the diffusion coefficient of famotidine was measured to be 5.33 × 10⁻⁶ cm2 s-1.
The catalytic rate constant of the electrooxidation reaction can also be obtained using chronoamperometry according to (
41):
Icat/IL = γ1/2[π1/2erf (γ1/2) + exp (-γ)/γ1/2] (Equation 8)
where Icat and IL are the currents in the presence and absence of the drug, respectively, and γ = k’C*t is the argument of the error function. k’ is the catalytic rate constant and t is elapsed time. For γ > 1.5, erf(γ1/2) is almost equal to unity and the above Equation can be reduced to:
Icat/IL = γ1/2 π1/2= π1/2 (k’C*t)1/2 (Equation 9)
Based on the slope of the I
cat/I
Lvs. t
1/2 plot presented in
Figure 6C, a mean value of k’ for the electrooxidation of famotidine was obtained as 6.6 × 10
4 cm
3 mol
-1 s
-1. The following reaction mechanism is proposed based on the presented results for the mediated oxidation of famotidine on the MCPE surface. Ni
2+ oxidizes to Ni
3+ in the first step:
Ni(II) Ni(III) + e- (Equation 10)
The next step involves the oxidation of famotidine on the modified surface via the following reaction:
Ni(III) + famotidine → Product + Ni(II) (Equation 11)
As for the product(s) of the famotidine electrooxidation, the drug possesses four primary amine functional groups, which are likely oxidized to the corresponding hydroxylamine (
42):
R-NH2 + H2O→ R-NHOH + 2H+ + 2e- (Equation 12)
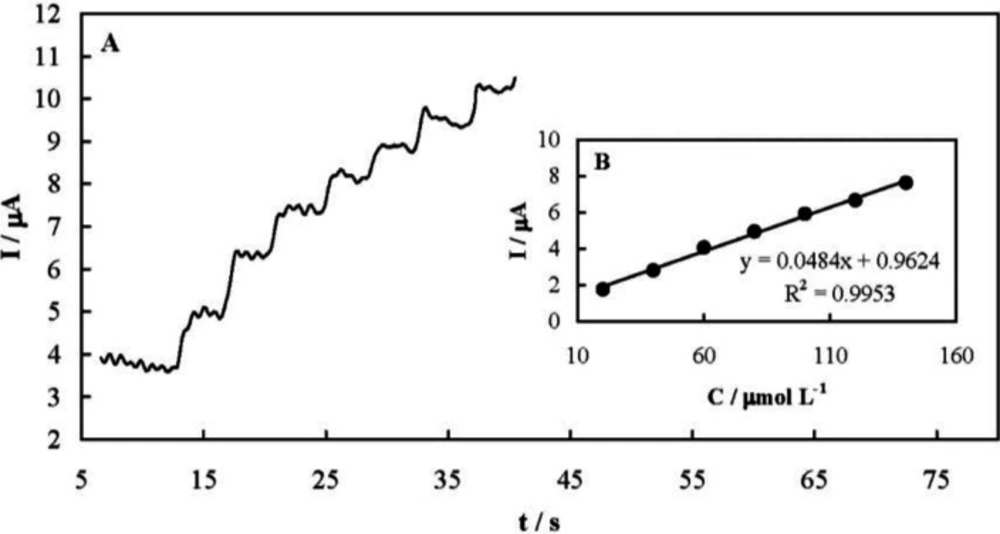
Amperometry was also employed for quantitative analysis of famotidine. Typical amperometric signals recorded upon successive famotidine increments are presented in
Figure 7A. The solution was stirred after each injection and during the amperometric signals recording. The current responses were quite fast and dependent on the drug concentration as shown in
Figure 7B. The analytical parameters of the amperometric method are presented in
Table 1. In addition,
Table 2 compares the determined analytical parameters of the developed amperometric method in this study with other reported techniques. The developed amperometric method was more simple, faster, and low-cost compared to the others.
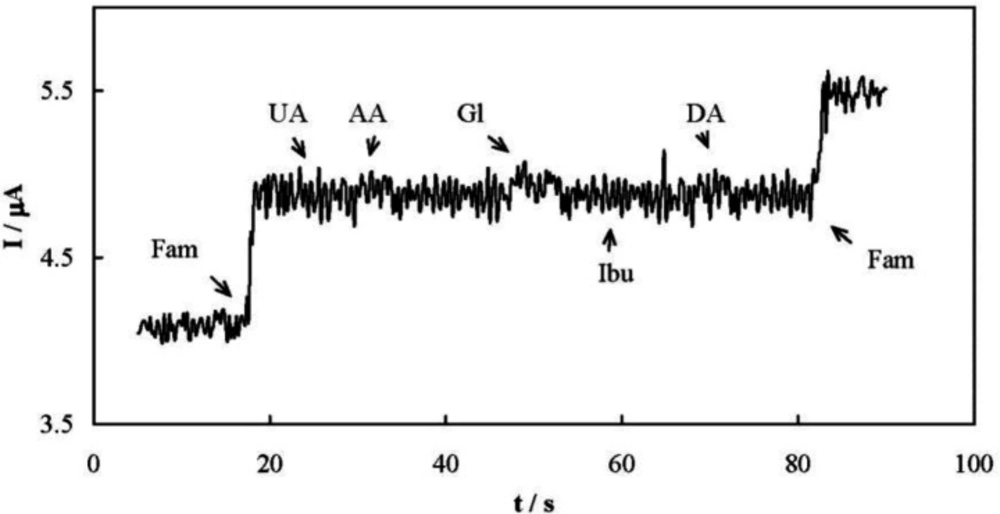
Selectivity of the amperometric method for the determination of famotidine was evaluated. One of the most important interfering species during the famotidine determination is ibuprofen, since famotidine and ibuprofen are occasionally co-formulated in a mixture. The interfering effects of uric acid, ascorbic acid, glucose, and dopamine were also checked. Ibuprofen does not possess any oxidizable functional group and therefore is not electroreactive. On the other hand, all of the interfering species are negatively charged in the supporting electrolyte. When a Nafion membrane was applied to the MCPE surface, amperometric signals did not show any chemical interference in the presence of all these compounds due to the repulsion between these anionic compounds and the Nafion membrane (
Figure 8).
The repeatability and reproducibility of the amperometric method was determined by repetitive measuring of the electrode response. Three concentrations of famotidine were analyzed by three independent measurements over one day (intra-day assay) and over three days (inter-day assay). Relative standard deviation (RSD) values of smaller than 5% were obtained for both the assays. In addition, a 20 μmol L-1 famotidine solution was analyzed three times using the same MCPE and a RSD value of 3.85% was obtained. Similar determinations were performed using three fabricated MCPE electrodes, resulting in a RSD value of 7.15%. These results suggest that the developed amperometric method exhibited desirable repeatability and reproducibility.
Application of the amperometry method for the determination of the drug in sample dosage forms was evaluated by analyzing the famotidine tablets. The amount of the drug in the tablets was determined by the amperometric method and the obtained results are presented in
Table 3. Good agreement was observed for the drug analyzed using the presented method with the nominal values.
(A-E) SEM micrographs of the synthesized nickel hydroxide nanosheets at different magnifications; (F) EDS spectrum of the electrode surface
A typical cyclic voltammogram of MCPE prepared with 6% of the modifier recorded at a potential sweep rate of 50 mV sec-1 in 100 mmol L-1 NaOH solution. Inset: dependency of the anodic and cathodic peak currents on the percentage of the modifier in MCPE
(A) cyclic voltammograms of MCPE recorded in 100 mmol L-1 NaOH solution at different potential sweep rates in a range of 2 to 500 mV sec-1, (B) dependency of anodic and cathodic peak currents on the corresponding square root of potential sweep rate; (C) dependency of anodic and cathodic peak currents on the natural logarithm of the potential sweep rate
Cyclic voltammograms of UCPE and MCPE electrodes in 100 mmol L-1 NaOH solution in the absence and presence of 6.0 mmol L-1 famotidine, recorded at the potential sweep rate of 50 mV sec-1
Steady-state current-potential (Tafel) plot recorded for the electrooxidation of famotidine on the MCPE surface
(A) The chronoamperometric response of MCPE recorded in the absence (curve a) and presence of famotidine (curves b-g) over a concentration range of 0.08-0.8 mmol L-1 with an applied potential step of 580 mV; (B) dependency of the net current versus the mines square root of time; (C) Icat/ILvs. t1/2 plot for the recorded chronoamperogram
(A) Typical amperometric response of MCPE recorded upon successive famotidine increments; (B) dependency of the amperometric response of MCPE on the successive addition of famotidine
Amperometric response of MCPE covered with a layer of Nafion membrane in the presence of various biological compounds
| Linear range/µmol L-1 | 20-140 |
|---|
| Sensitivity (Slope)/mA L mol-1 | 48.4 |
| Intercept/µA | 0.96 |
| R2 | 0.9953 |
| Standard error of slope (P = 0.005) | 1.5 |
| Standard error of intercept (P = 0.005) | 0.13 |
| Detection limit/µmol L-1 | 5.91 |
| Quantitation limit/µmol L-1 | 19.7 |
| RSDa% | 5.21 |
| Method | Electrode | Linear range | Detection limit | Matrix | Reference |
|---|
| HPLC | - | 10-100 µg mL-1 | 10 µg mL-1 | Tablet | (35) |
| Spectrophotometry | - | 2.5-25 µg mL-1 | 0.62 µg mL-1 | Tablet | (31) |
| SW AdSV | CG-MDE | 0.17-20.2 µg mL-1 | 0.02 µg mL-1 | Pure drug form | (40) |
| LS AdSV | CG-MDE | 0.34-13.5 µg mL-1 | 0.06 µg mL-1 | Pure drug form | (40) |
| HPLC | - | 0.631-252 ng mL-1 | 0.252 ng mL-1 | Plasmaa | (37) |
| HPLC | - | 0.631-252 ng mL-1 | 0.252 ng mL-1 | Plasmab | (37) |
| HPLC | - | 0.075-30.0 µg mL-1 | 0.015 µg mL-1 | Urinec | (37) |
| Spectrophotometry | - | 2-61 μg mL-1 | 0.28 μg mL-1 | Pure drug form | (32) |
| Gas chromatography | - | 80-700 ng mL-1 | 17 ng mL-1 | Pure drug form | (38) |
| HPLC with UV detection | - | 5-25 μg mL-1 | 0.134 μg mL-1 | Pure drug form | (36) |
| Spectrofluorimetry | - | 10-100 ng mL-1d | 0.79 ng mL-1e | Pure drug form | (33) |
| Spectrofluorimetry | - | 5-70 ng mL-1f | 0.74 ng mL-1g | Pure drug form | (33) |
| Spectrofluorimetry | - | 5-60 ng mL-1h | 1.71 ng mL-1i | Pure drug form | (33) |
| CZE | - | 1.5-48 μg mL-1 | 0.09 μg mL-1 | Tablet | (39) |
| Potentiometry | ISME | 3.37-337.5 mg mL-1 | - | Tablet | (34) |
| Amperometry | MCPE | 6.75-47.2 mg mL-1 | 1.99 mg mL-1 | Tablet | This study |
| Tablet | Amount labeled/mg | Amount found/mg | Bias% |
|---|
| A | 20 | 20.8 | +4.0 |
| B | 20 | 19.4 | -3.0 |
| C | 20 | 19.1 | -4.5 |