Optimization of DSPE conditions
Based on preliminary studies in this field, four key parameters were chosen for studying the impacts of the influencing parameters on the selected drugs extraction effectiveness. The variables including desorption, sorbent mass and desorption solvent composition, absorption time and volume were assessed. Some other parameters and their interactions were neglected and were kept for further studies (
4,
10).
Optimization of the sorbent mass
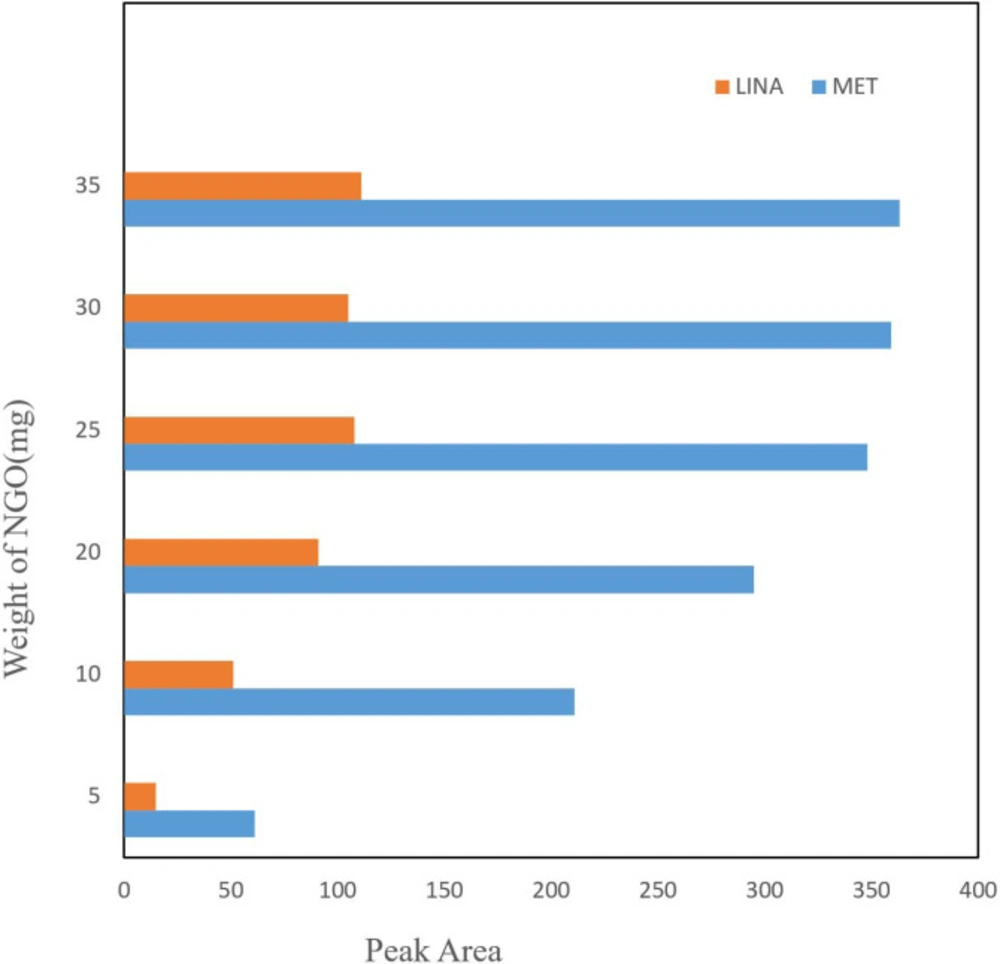
Amount of adsorbent seems to be effective on drug extraction recovery, thus the quantity of NGO was optimized in the 5-35 mg range (
Figure 2). The experiment shown that with increasing the amount of adsorption, the yield of extraction continuously improved and reached to equilibrium at 25 mg. Although increasing the adsorbent amounts up to 25 mg possibly contributed to the reaction between analyte and adsorbent by preparing an suitable surface area for adsorption of drug, in higher NGO amounts, low efficiency of extraction was observed. This could be due to NGO accumulation that decreased the surface area of operative adsorption. Subsequently, the following investigations were done by 25 mg of adsorbent.
Selection of desorption solvent composition and volume
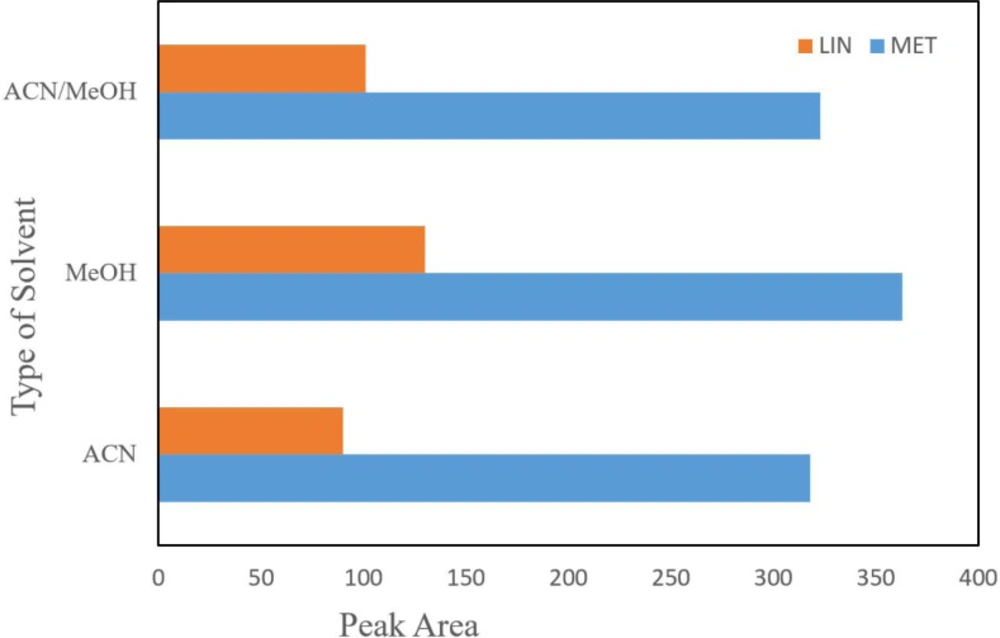
Various organic solvents including methanol, acetonitrile, and equal mixture of acetonitrile and methanol were tested for removing the analyte from NGO. According to the results, acetic methanol showed the best peak area in comparison with the others and thus acetic methanol was chosen for the following assays. Acetonitrile is a weaker polar solvent than methanol; however, due to the existence of polar functional groups on surface of NGO, it could be appropriately distributed in polar solvents. In fact, most high distribution of NGO in methanol which providing the maximum surface interaction for drug and adsorbent, maximum extraction efficiency can be carried out (
Figure 3).
Effect of adsorption and desorption time
Since the maximum efficiency of extraction is based on the extraction time to reach equilibrium, the extraction time is a significant parameter in the DSPE method. A range of time between 1 to 15 min was tested for spiked drugs in real samples. Thus, the highest peak area was achieved in 10 min and the efficiency remained constant with subsequently increases in time extraction. The cause of this phenomenon is an expression of equilibrium attainment of extraction in 10 min.
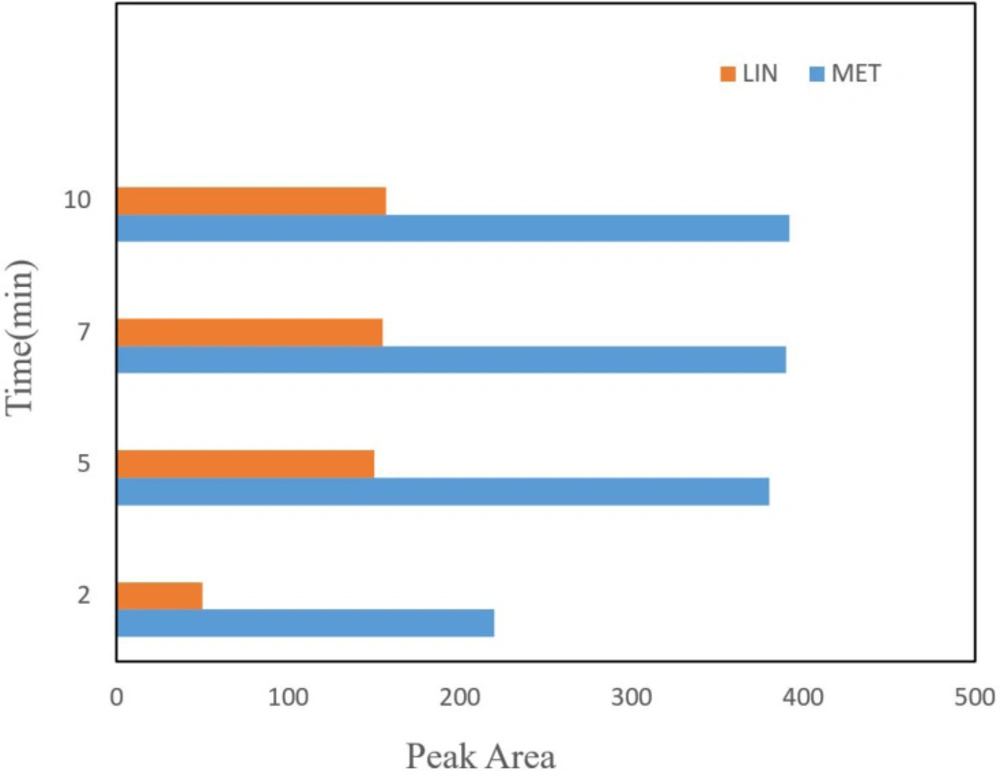
Time of desorption is another important parameter in the DSPE procedure which influence the mass of desorbed drug from the NGO areas. The amount of desorbed drug was studied in a time range between 2 to 20 min. According to the results, the extraction efficiency increased with an increase in the time up to 5 min, and then the peak area decreased (
Figure 4). Therefore, 5 min was selected for the following experiments.
LOD values for each compound was determined according to the S/N = 3 criterion and the LOQ of the assay was assessed also according to the S/N = 10 criterion. Various concentrations of LIN and MET (2, 20, 200 ngmL-1) were spiked in blank plasma samples and analyzed by implementing NGO-DSPE-HPLC-UV-Vis technique. Accuracy and precision experiments were done at three concentrations involving the calibration range.
Analytical parameters
The quality figures were measured under optimized conditions of extraction. Several quantitative factors such as the dynamic linear range, LOD (limit of detection), correlation coefficient, LOQ (limit of quantification), and RSD (relative standard deviation) were examined to validate the proposed technique (
Table 1). Different ngmL
-1 concentrations ranging from 2-200 ngmL
-1 was spiked in the blank plasma sample and tested using the proposed method. The curve of calibration was created by plotting the average of peak area in comparison to concentration and the correlation coefficient was calculated. Values of LOD for all compounds was measured according to the S/N = 3 criterion and the assay LOQ was assessed according to the S/N = 10 criterion. Different concentrations of LIN and MET (2, 20, 200 ngmL
-1) were spiked in blank plasma samples and analyzed using NGO-DSPE-HPLC-UV-Vis method. Precision and accuracy of experiments were carried out at three concentrations, covering the range of calibration (
Table 2).
NGO- DSPE -HPLC-UV-Vis applied to real sample
The proposed method was used to drug extraction from the sample of plasma to investigate the possibility of developed method to extraction and measurement of LIN and MET in real sample (
Table 3). The implementation of the suggested technique was studies using positive plasma samples.
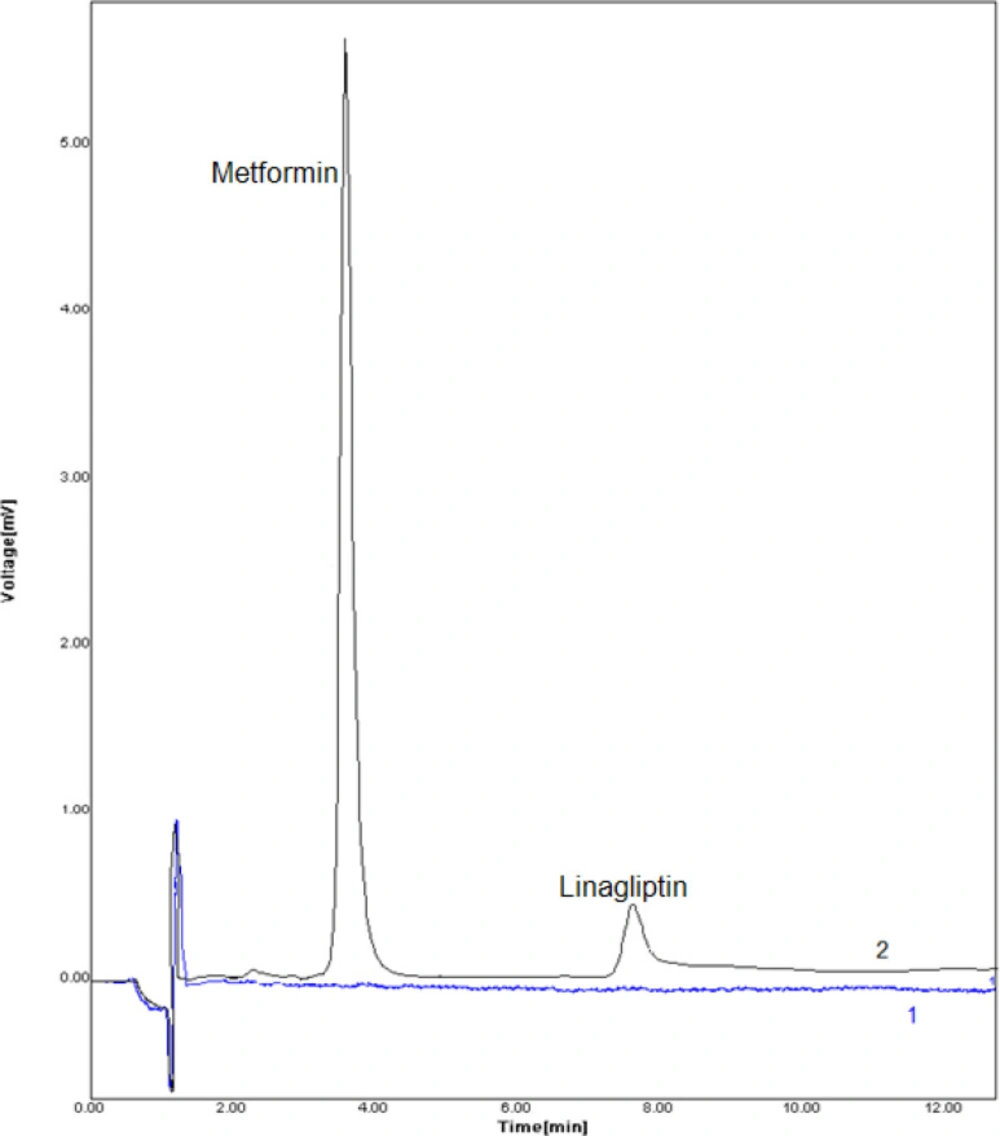
Figure 5 displays the DSPE–HPLC–UV-Vis chromatogram in blank and positive plasma sample. Considering that these drugs were not detected in the plasma samples, ngmL
-1concentrations of them were added into the samples of plasma, and process of extraction and measurement was performed according to the proposed method.
As
Table 2 shows, the experiment results of analyses of plasma sample by the suggested technique were in agreement with the spiking amounts. Moreover, relative errors were acquired less than 4.3% and 5.4% for MET and LIN, in the respective order and suggested technique showed great reproducibility for measurement of these drugs in the plasma samples with intra-day values of RSD% in the range of 3.9-6.1 and 4.5-7.9 for MET and LIN, in the respective order.
Comparison of proposed methods with previously published methods
Few researches have focused on determining the selected drugs in plasma matrices concurrently (24, 26 and 28). No result has been yet published on applying DSPE to determine LIN and MET.
Table 4 displays the suggested technique based on adsorbent NGO with DSPE pretreatment established comparable detection limits for the major of analytes.
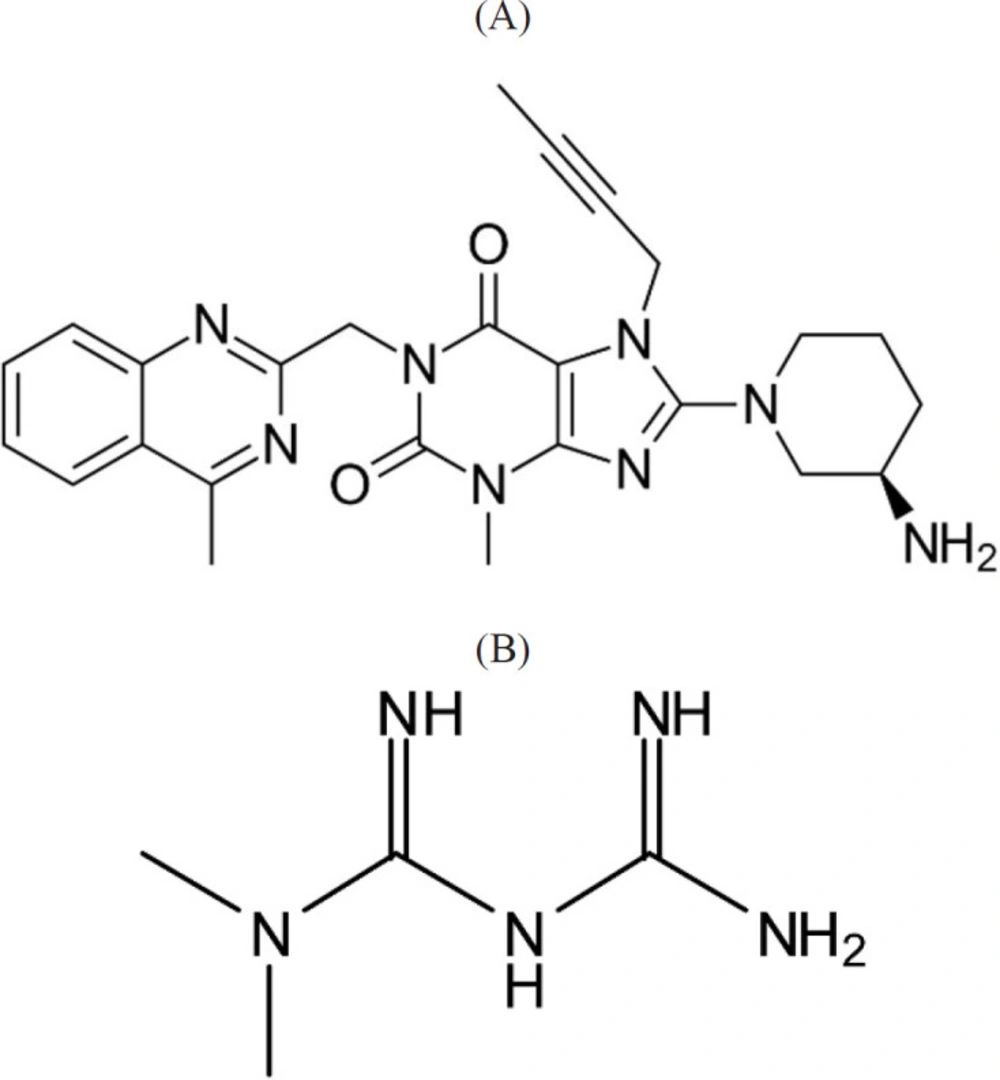
Chemical structure of (A) Linagliptin and (B) Metformin
The effect of NGO amounts on efficiency of extraction. Conditions: volume of sample = 50 mL; concentration of the LIN and MET = 100 ngmL-1; stirring time = 10 min; elution with 3 mL (2 × 1.5 mL) methanol; desorption time = 7 min
The effect of type of extraction solvent composition and volume on extraction efficiency. Conditions: weight of NGO = 25 mg; Sample volume = 50 mL; concentration of the drugs = 100 ngmL-1; stirring time = 10 min; desorption time = 7 min
The effect of different desorption time, other extraction conditions are as cited in Figure 3
Chromatograms of blank positive plasma samples. Typical chromatograms (HPLC) of (1) blank human plasma, (2) plasma sample spiked with drugs at concentration of 20.0 ngmL-1. Conditions: column LiChrosphere 100 RP 18e (125 mm × 4.0 mm, 5 μm) maintained at an ambien temperature, mobile phase methanol: phosphate buffer (potassium dihydrogen orthophosphate 0.05 M pH 4.6) (70:30 v/v) at flow rate of 0.6 mL min−1, column temperature: 25 °C, monitoring wavelength: 267 nm, injection volume: 20 μL
| RSD (%) | LOQ (ngmL-1) | LOD (ngmL-1) | Linearity (r²) | Concentration range (ngmL-1) | Analyte |
|---|
| 3.23.6 | 6.19.2 | 2.03.0 | 0.99010.9903 | 10-200010-2000 | LinagliptinMetformin |
| Metformin | Linagliptin | Analyte |
|---|
| 200 | 20 | 2 | 200 | 20 | 2 | Concentration(ngmL-1) |
| 4.5 | 5.8 | 7.9 | 3.9 | 4.5 | 6.1 | Intra-day (n = 3)Precision (RSDª) |
| 3.7 | 4.1 | 5.3 | 2.7 | 3.5 | 4.2 | Intra-day (n = 3)Accuracy (bias) |
| 1.0 | 0.8 | 0.9 | 1.1 | 0.9 | 0.8 | Inter-day (n = 3)Precision (RSDª) |
| 1.1 | 0.6 | 0.8 | 1.0 | 0.8 | 0.7 | Inter-day (n = 3)Accuracy (bias) |
| Analyte | Recovery (%) |
|---|
| Subject 1 | 96.23 for Linagliptin94.33 for Metformin |
| Subject 2 | 97.11 for Linagliptin95.03 for Metformin |
| Analyte | Extraction technique | Determnation technique | Matrix | LOD | Ref. |
|---|
| LINMET | - | RP-HPLC | Pharmaceutical dosage | 0.09 µgmL-10.06 µgmL-1 | (24) |
| LINMET | - | Spectrophotometric | Pharmaceutical dosage | 0.23 µgmL-10.77 µgmL-1 | (26) |
| LINMET | - | RP-HPLC | Pharmaceutical dosage | Not recordedNot recorded | (28) |
| LINMET | NGO- DSPE | RP-HPLC | Plasma | 2 ngmL-13 ngmL-1 | This work |