3.1. Substances and Agents
Fetal bovine serum (FBS) and Dulbecco's Modified Eagle's Medium (DMEM) were purchased from GIBCO (Invitrogen, Carlsbad, CA, USA). Trypsin-EDTA and penicillin/streptomycin antibiotics were obtained from Ideazist (Iran). Quercetin, curcumin, oleic acid, lecithin, and polyvinyl alcohol (PVA) were procured from Sigma-Aldrich (St. Louis, MO, USA). For the protein assay, the bicinchoninic acid (BCA) kit was acquired from Parstous (Mashhad, Iran). Recombinant TGF-β and a range of antibodies, including HRP Anti-Rabbit IgG peroxidase, Anti-phospho-Nrf2 (Ser40), Anti-phospho-ERK1/2 (Thr202/Tyr204), and GAPDH, were sourced from Cell Signaling Technology (Beverly, MA, USA).
3.2. Preparation of Curcumin Stock Solution
To prepare a curcumin stock solution in DMSO at an initial concentration of 50 mM, the following procedure was used: Curcumin was first dissolved at a concentration of 5 mM in DMSO. The mixture was maintained at 20°C and stored in the dark to ensure stability. The curcumin stock solution was then diluted with culture media to achieve final working concentrations of 10, 25, 50, 100, and 150 μM for cell treatments, respectively.
3.3. Preparation of Nano-Quercetin
To prepare N-QCT, a mixture of 100 mg of QCT and 4.75 grams of Compritol 888 ATO (a solid lipid, Glyceryl Dibehenate, Grabefossé) was heated to 75°C. Separately, deionized water was combined with 0.25 grams of oleic acid (as a liquid lipid) and 0.5 grams of lecithin (as an emulsifier), heated to 80°C, and stirred for 5 minutes. The mixture was then homogenized at 10000 rpm using an Elmasonic S60H homogenizer (Heidolph Schüttler, Germany).
The resulting solution and the original mixture were further sonicated using an ultrasonicator (Global Industrial, USA). To create a nanoemulsion, 4 mL of a 1% PVA solution (as a surfactant) was added to the mixture at 3°C. The mixture was again homogenized at 10000 rpm using a Heidolph homogenizer. Subsequently, the suspension was centrifuged twice for 20 minutes at 25,000 RCF and 5°C. The prepared N-QCTs were stored in sealed containers in a refrigerator until needed.
3.4. Transmission Electron Microscopy
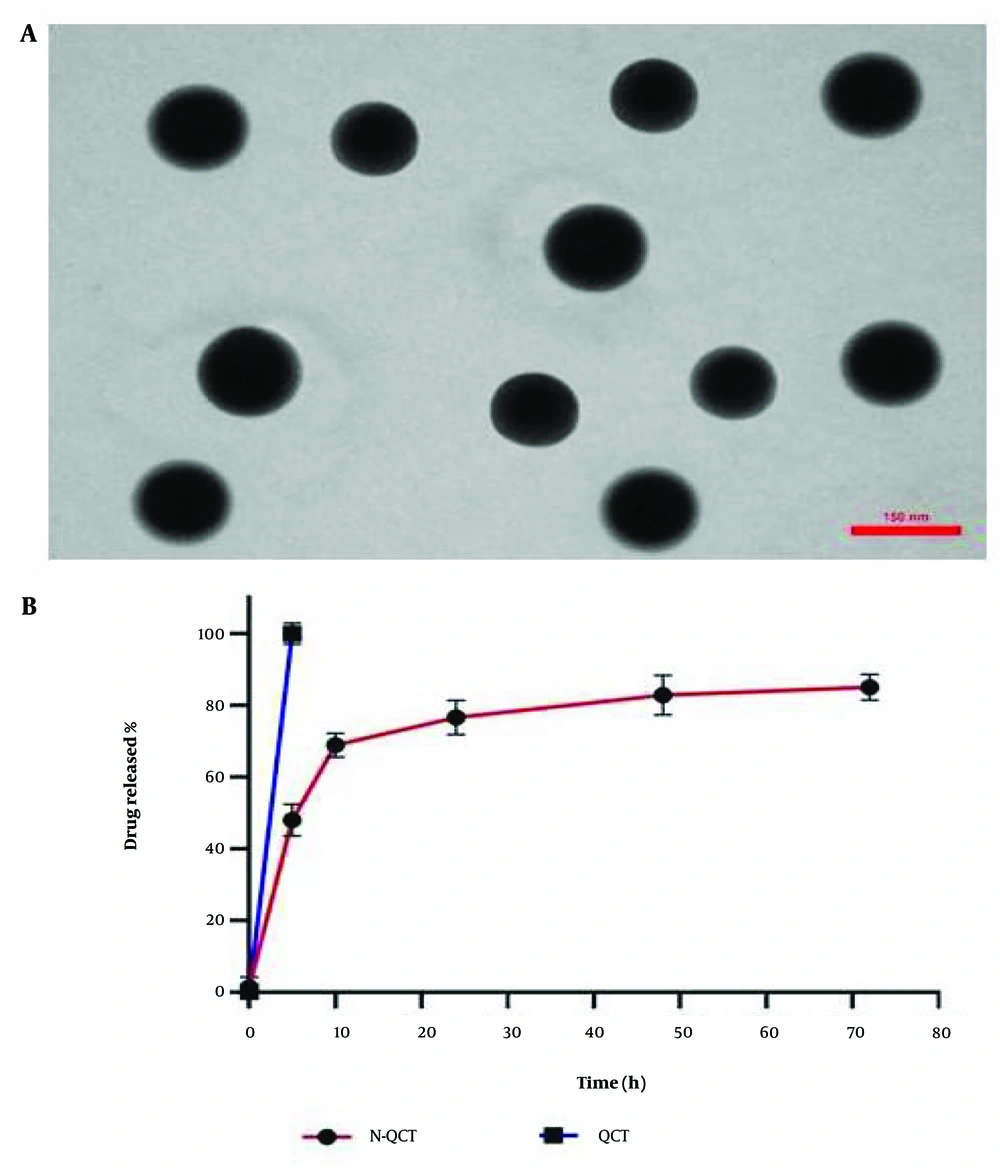
Transmission electron microscopy (TEM) was employed to analyze the SLN structure. A drop of the SLN suspension was placed onto a carbon-coated copper grid to form a thin liquid layer. The samples were air-dried for five minutes at room temperature before being analyzed by TEM.
3.5. Measuring Infrared with the Fourier Transform
FTIR spectrum analysis was performed to confirm the interactions in the N-QCT preparation using a VERTEX 70 V spectrometer (Bruker, USA). The chemical interaction between SLNs and QCT was validated based on the obtained spectra. Samples were pressed into pellets with KBr under a pressure of 200 kg/cm2. The FTIR spectra of QCT, N-QCT, and blank SLNs were recorded at a resolution of 1 cm-1, covering a range from 400 to 4000 cm-1.
3.6. Zeta Potential and Particle Dimensions of Nano-Quercetin
The N-QCTs were characterized for average particle size, zeta potential, and Polydispersity Index (PDI) using a Nanosizer and Zetasizer (Malvern, England). The morphology was examined with a transmission electron microscope (ZEISS LEO 906 E, Germany). For sample preparation, a thin layer of SLN suspension was deposited onto a carbon-coated copper grid. The samples were air-dried at room temperature for five minutes after removing excess liquid with paper filters. The size and shape of the SLNs on these dried samples were then measured and observed using the transmission electron microscope.
3.7. Encapsulation Efficiency In Vitro
The N-QCT suspension was centrifuged at 25000 rpm for 25 minutes, and the quantity of QCT in the supernatant was measured using a UV spectrophotometer (Pharmacia Biotech, USA, Ultraspec 3000) at a wavelength of 256 nm. The encapsulation efficiency (EE) was calculated using the following formula:
EE (%) = 100 (Initial drug concentration - Not included drug concentration)/Initial drug concentration
To calculate the drug loading (DL), N-QCT was first dissolved in methanol, and the amount of QCT in the solution was then measured with the spectrophotometer at 256 nm. Drug loading (DL) was calculated using the formula:
Where, Wi represents the weight of the initial drug, Wf represents the weight of the drug remaining after the free drug is removed from the supernatant, and Wl is the weight of the lipid used to produce the nanoparticles.
3.8. Drug Release In Vitro
The release of QCT from N-QCT was assessed using the dialysis bag method. A phosphate buffer solution (pH 7.4) with a molecular weight cutoff of 12000 Da (Sigma-Aldrich, USA) was used as the receptor phase, maintained at 37°C. Samples were collected at regular intervals and analyzed spectrophotometrically at 256 nm.
3.9. Experimental Design for Vascular Smooth Muscle Cells Culture and Treatment
Human VSMCs were purchased from the Pasteur Institute in Tehran, Iran. The VSMC culture was supplemented with 100 U/mL streptomycin, 100 mg/mL penicillin, and 10% FBS. The VSMCs were maintained at 37°C in a humidified atmosphere with 5% CO2. After seeding, the cells were divided into several groups: (1) Control group (media only), (2) N-QCT-only group, (3) curcumin-only group, (4) TGF-β-treated group, (5) N-QCT in the TGF-β-induced VSMC group, (6) curcumin in the TGF-β-induced VSMC group, and (7) combination of N-QCT and curcumin in the TGF-β-induced VSMC group. In this experiment, the effects of N-QCT and curcumin on VSMCs were also evaluated in the absence of TGF-β stimulation, serving as control groups (groups 2 and 3).
3.10. In Vitro Cytotoxicity Assay
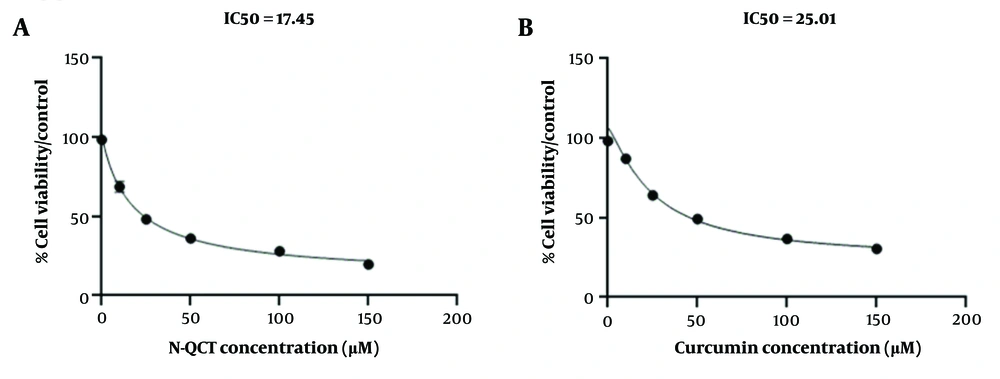
The MTT assay was used to assess the viability of VSMCs. The VSMCs were seeded in 96-well plates at a density of 5 × 10³ cells per well and incubated overnight at 37°C in a 5% CO₂ atmosphere to facilitate cell adhesion. The cells were then cultured for an additional 24 and 48 hours with various concentrations of N-QCT (10, 25, 50, 100, and 150 μM) and curcumin (10, 25, 50, 100, and 150 μM). After treatment, the media was aspirated, and 0.5 mg/mL MTT solution was added to the cells. The plates were incubated in the dark for four hours. Following incubation, the formazan crystals formed were dissolved by adding 150 μL of dimethyl sulfoxide (DMSO) (Merck, Darmstadt, Germany) to each well. The plates were shaken for fifteen minutes, and the optical density (OD) of each well was measured at 570 nm using a BioTek ELx800 microplate reader (Winooski, Vermont, USA). The percentage of cell viability was calculated by comparing the absorbance of treated cells with that of untreated control cells. Data analysis and determination of the half-maximal inhibitory concentration (IC₅₀) were performed using GraphPad Prism version 8.0 (La Jolla, CA). This software was used to process the experimental data and calculate the IC₅₀ values for curcumin and N-QCT treatments.
3.11. Investigation of Combination Index
CompuSyn (Chou and Martin, 2005; Compusyn Inc., USA) was used to calculate the CI and evaluate the cooperative relationship between curcumin and N-QCT. Combination Index values > 1 and < 1 indicate antagonism and synergy, respectively, while CI = 1 indicates additive effects. The Chou method was applied for CI analysis (
28,
29).
CI = D1/Dx1 + D2/Dx2
The IC₅₀ values D
1 and D
2 of each combination drug are determined by calculating the mole fraction of the IC₅₀ value; the IC₅₀ values of a single drug are denoted as Dx
1 and Dx
2 (
28). Furthermore, the CI has four classifications based on values: High synergism (CI between 0.1 and 0.3), moderate synergism (CI between 0.3 and 0.7), mild synergism (CI between 0.7 and 0.85), and no synergism (CI between 0.85 and 1.0).
3.12. Detection of Reactive Oxygen Species Production
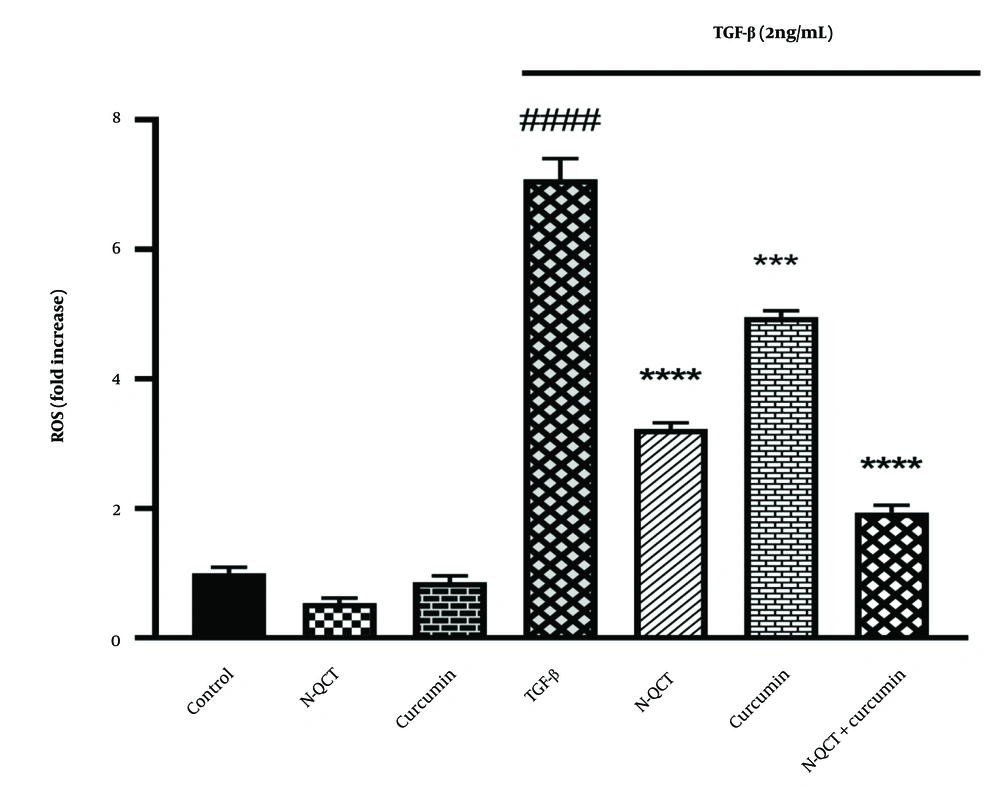
The ROS assay was performed using the 2′,7′-dichlorodihydrofluorescein (H₂DCF) probe and a fluorimetric technique to measure the production of 7′-dichlorofluorescein (DCF), indicative of H₂O₂ levels produced by the cells. The fluorescence emitted by DCF was measured at 500 and 600 nm. Human VSMCs were cultured in 12-well plates and treated with TGF-β (2 ng/mL), N-QCT, curcumin, and a combination of both. After a 24-hour incubation, H₂DCF solution (25 μM) was added, and fluorescence was measured using a spectrofluorometer (Cary, Australia) with excitation at 485 nm and emission at 535 nm.
3.13. Quantitative Real-Time Polymerase Chain Reaction
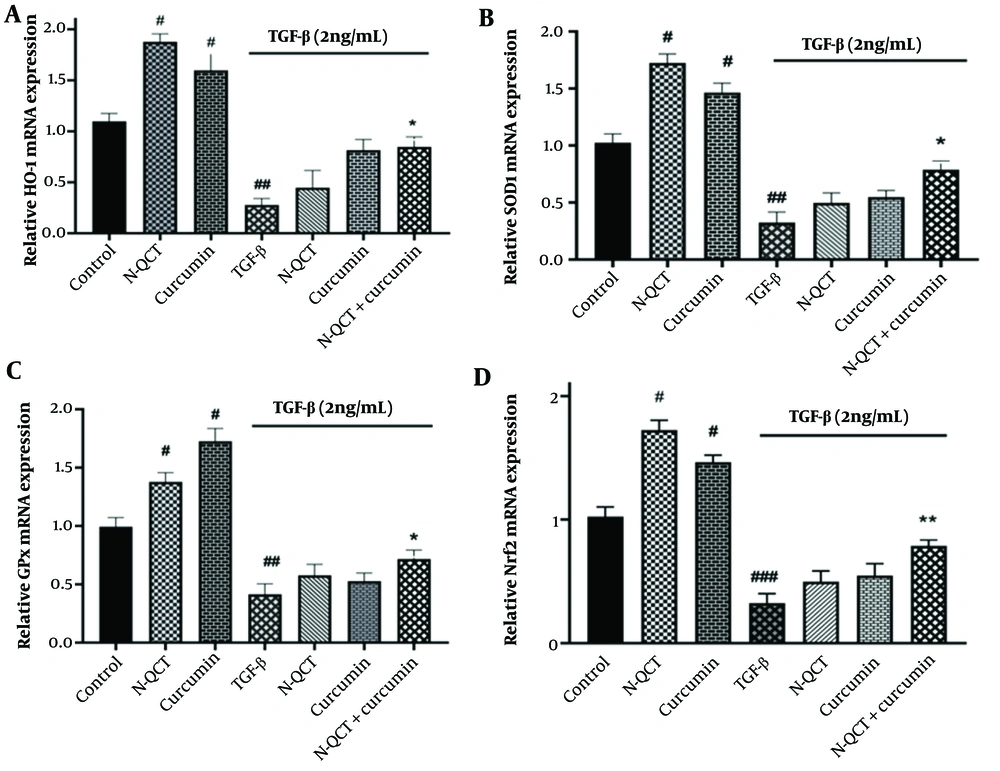
The real-time PCR technique (Amplicon, Denmark) was used to determine the expression of genes encoding NOX1, NOX2, NOX4, Nrf2, and antioxidant enzymes. After collecting the cells, total RNA was extracted using an RNA isolation kit (Yectatajhizazma) following the manufacturer's instructions. RNA concentration and purity were determined by measuring absorbance at A260 nm/A280 nm using a Nanodrop 2000 (Thermo Fisher Scientific). cDNA synthesis was then performed using a cDNA synthesis kit (Yectatajhizazma, Iran). The primers listed in
Table 1 were used for gene expression, and real-time PCR amplification was performed using a Biosystem (initial denaturation at 95°C for 15 minutes, followed by 40 cycles of 15 seconds at 95°C and 1 minute at 60°C for denaturation and annealing, respectively). GAPDH primers were used as the housekeeping gene (F: 5'-CATCACTGCCACCCAGAAGACTG-3', R: 5'-ATGCCAGTGAGCTTCCCGTTCAG-3'). The comparative delta-delta cycle threshold (ΔΔCt) method was employed to assess the fold variation in mRNA expression from the qRT-PCR tests.
| Target Gene | Primer Sequence 5 to 3 | Gene Bank Accession Number | Length, bp |
|---|
| NOX1 | F-GGTTTTACCGCTCCCAGCAGAA | NM_007052 | 101 |
| R-CTTCCATGCTGAAGCCACGCTT |
| NOX2 | F-CTCTGAACTTGGAGACAGGCAAA | NM_000397 | 131 |
| R-CACAGCGTGATGACAACTCCAG |
| NOX4 | F-GCCAGAGTATCACTACCTCCAC | NM_016931 | 112 |
| R-CTCGGAGGTAAGCCAAGAGTGT |
| Nrf2 | F-AGGTTGGAGCTGTTGATCTGT | NM_001145412.3 | 138 |
| R-AATCCATGTCCCTTGACAGCA |
| SOD-1 | F-GGCAATGTGACTGCTGACAA | NM_000454.4 | 116 |
| R-GCTTTTTCATGGACCACCAGT |
| HO-1 | F-CCAGGCAGAGAATGCTGAGTTC | NM_002133 | 143 |
| R-AAGACTGGGCTCTCCTTGTTGC |
| GPx | F-GTGCTCGGCTTCCCGTGCAAC | NM_000581 | 122 |
| R-CTCGAAGAGCATGAAGTTGGGC |
Abbreviations: NOX, NADPH oxidases; Nrf2, nuclear transcription factor erythroid 2-related factor.
3.14. Western Blot Technique
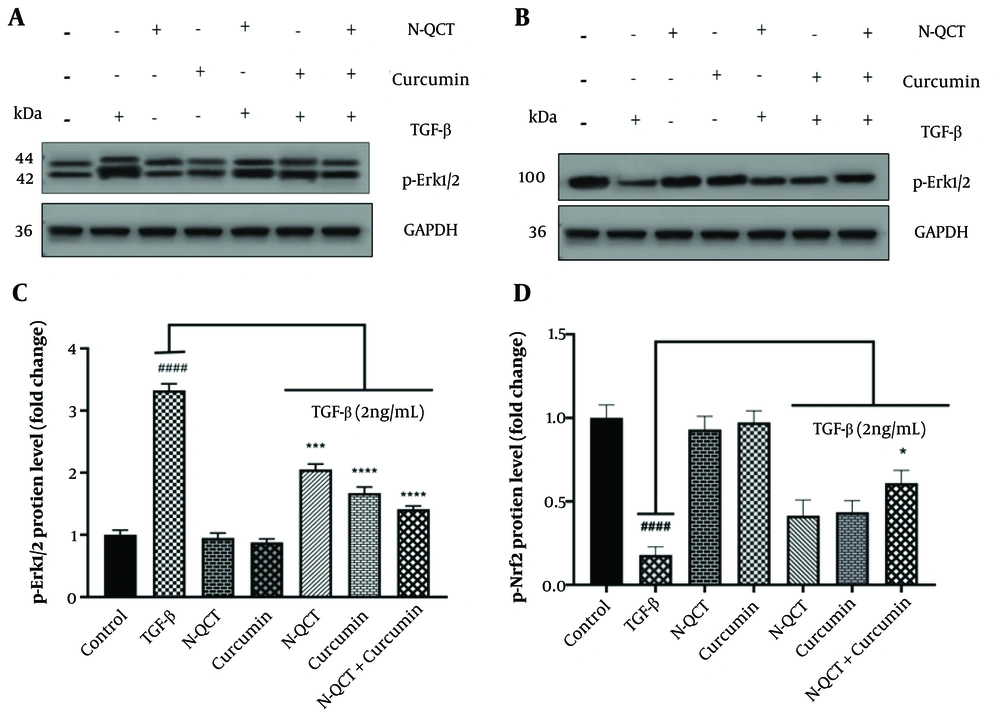
The study involved VSMC cells exposed to various treatments for 48 hours, including N-QCT and curcumin. The cells were then lysed using RIPA lysis buffer containing a protease inhibitor to prevent protein degradation. Proteins were separated using SDS-PAGE and transferred to a polyvinylidene fluoride (PVDF) membrane for 120 minutes. The membrane was blocked for 75 minutes with Tris-buffered saline containing 0.1% Tween 20 (TBST) and 5% nonfat dry milk. Specific primary antibodies against Erk1/2 (1:1000; sc-514302), Nrf2 (1:1000; #12721), and GAPDH (1:1000; sc-5174) (Santa Cruz Biotechnology, USA) were incubated on the membrane overnight at 4°C. The membrane was then exposed to a goat anti-rabbit IgG secondary antibody conjugated with peroxidase for 1 hour at room temperature. Protein bands were detected using the Enhanced Chemiluminescence (ECL) kit from Abcam, which facilitates protein detection via chemiluminescence. The intensity of the protein bands was quantified using the ImageJ program developed by the National Institutes of Health (NIH), allowing for the analysis of protein expression levels.
3.15. Statistical Analysis
The results of the three independent experiments were presented as the mean ± standard error of the mean (SEM). Data were managed and analyzed using GraphPad Prism. ANOVA was used to examine the data, and P < 0.05 and P < 0.01 were considered statistically significant. A post hoc least significant difference (LSD) analysis was then performed.


![mRNA expression levels of NADPH oxidases (NOX) genes [NOX1, NOX2, and NOX4, labeled as (A), (B), and (C), respectively] in vascular smooth muscle cells (VSMCs), with and without TGF-β (2 ng/mL), following treatment with nano-quercetin (N-QCT), curcumin, or a combination of both. Statistical significance is indicated as follows: # (#### P < 0.0001) for comparisons between the TGF-β-stimulated group and control cells, and * P < 0.05, *** P < 0.001, **** P < 0.0001 for comparisons between other treatment groups and the TGF-β-treated cells (mean ± SD). The results were analyzed after three repetitions.](https://brieflands.com/journals/ijpr/articles/151428/figures/ijpr-151428-i004-F4-preview.webp "mRNA expression levels of NADPH oxidases (NOX) genes [NOX1, NOX2, and NOX4, labeled as (A), (B), and (C), respectively] in vascular smooth muscle cells (VSMCs), with and without TGF-β (2 ng/mL), following treatment with nano-quercetin (N-QCT), curcumin, or a combination of both. Statistical significance is indicated as follows: # (#### P < 0.0001) for comparisons between the TGF-β-stimulated group and control cells, and * P < 0.05, *** P < 0.001, **** P < 0.0001 for comparisons between other treatment groups and the TGF-β-treated cells (mean ± SD). The results were analyzed after three repetitions.")