


1. Background
2. Objectives
3. Methods
3.1. Animals and Experimental Designs
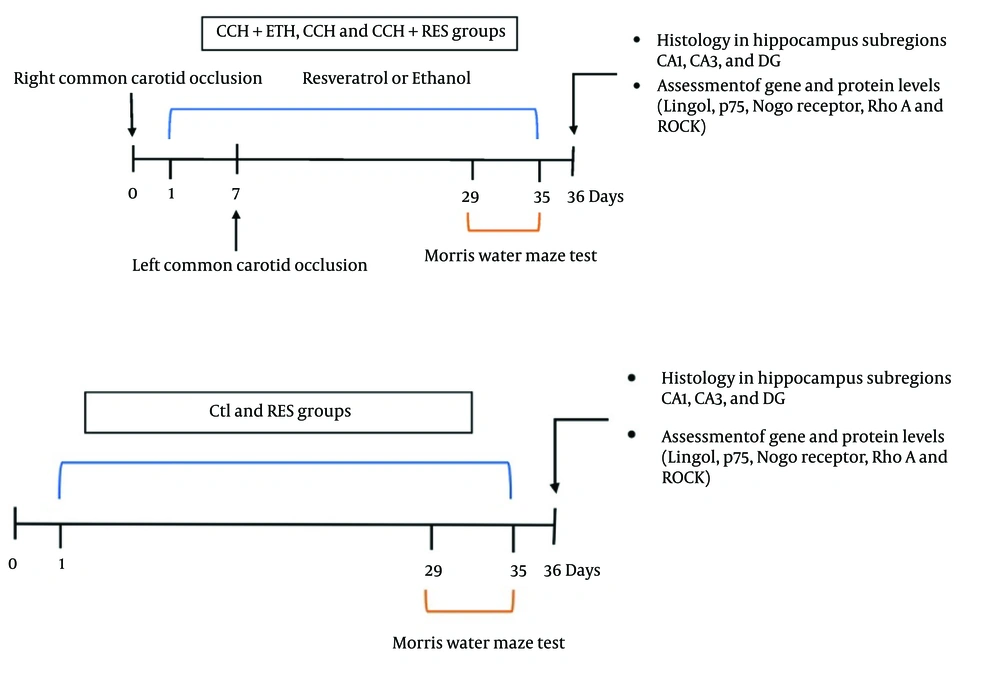
Experimental design–chronic cerebral hypoperfusion (CCH) model was induced by bilateral carotid artery occlusion (2VO). Rats received resveratrol (RES; 5 mg/kg, i.p.) or ethanol daily for 35 days following surgery. Day 0 refers to the day of the surgery.
3.2. Induction of Bilateral Carotid Artery Occlusion (Chronic Cerebral Hypoperfusion Model)
3.3. Behavioral Assessment
3.3.1. Morris Water Maze Test
3.4. Histological Assessment
3.5. Western Blot Analysis
3.6. RNA Extraction and Real-time RT-PCR Analysis
| Variables | Sequence |
|---|---|
| Lingo-1 | |
| Forward | 5′-GGGACAGACAGACGGAAAGC-3′ |
| Reverse | 5′-CCGTCTCCTCCTACAACACC-3′ |
| Nogo receptor (NgR1) | |
| Forward | 5′-ATGCTACAATGAGCCCAAGG-3 |
| Reverse | 5′-GAGCTGTGCATTATCGCTGA-3 |
| NGFR p75 | |
| Forward | GTGATGGCAACCTCTACAGT-3′-5′ |
| Reverse | 5′-TCTCCACAATGTCAGCTCTC-3′ |
| Rho A | |
| Forward | 5′-CGTTAGTCCACGGTCTGGTC-3′ |
| Reverse | 5′-CAGCCATTGCTCAGGCAAC-3′ |
| ROCK | |
| Forward | 5′-GAAGAGCAGCAGAAGTGGGT-3′ |
| Reverse | 5′-GGCAGTTAGCTAGGTTTGTTTGG-3′ |
| B-actin | |
| Forward | 5′-CTCTCTTCCAGCCTTCCTTC-3′ |
| Reverse | 5′-GGTCTTTACGGATGTCAACG-3′ |
3.7. Statistical Analysis
4. Results
4.1. Resveratrol-Alleviated Deficits in Spatial Learning and Memory in Rats Following Chronic Cerebral Hypoperfusion
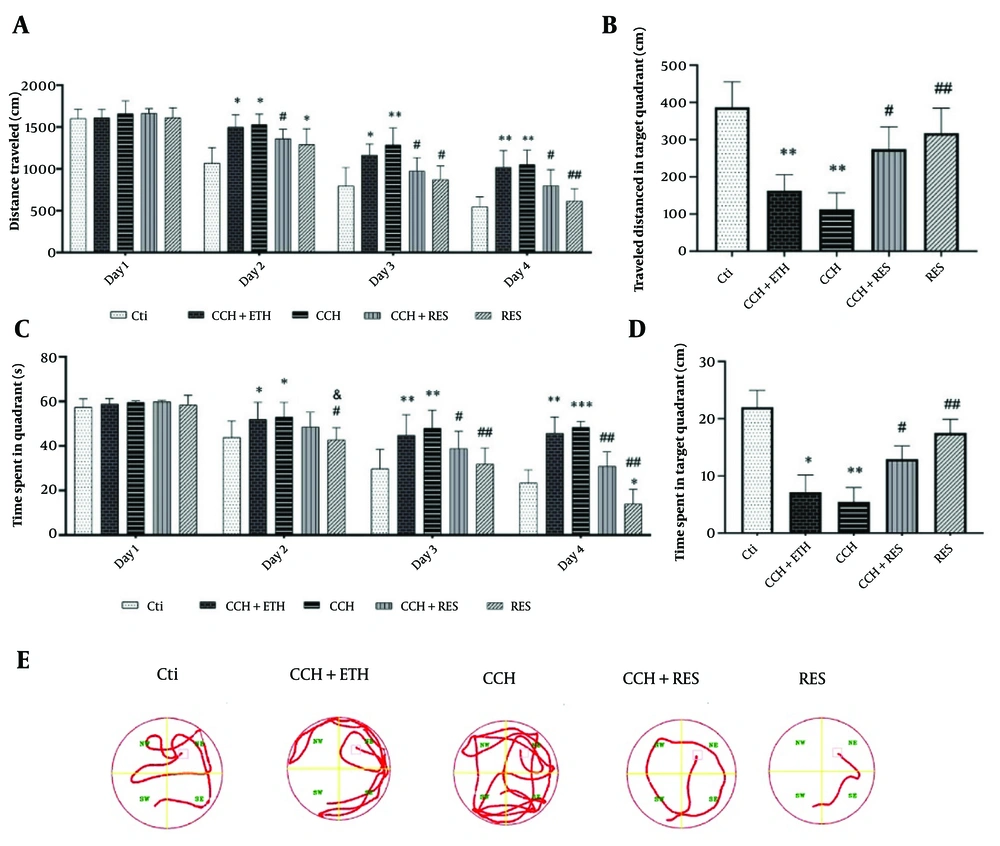
The effects of resveratrol (RES) treatment on spatial learning and memory in rats following chronic cerebral hypoperfusion (CCH) in the Morris Water Maze (MWM) test – A, the distance traveled during the training days; B, the distance traveled in the target quadrant without a platform; C, the time spent during the training days; D, the time spent in the target quadrant without a platform; and E, representative pathways on the last day of training trials. Data are expressed as mean ± SEM (n = 12/group). Differences between groups were determined by ANOVA followed by Tukey's test; * P < 0.05, ** P < 0.01, and *** P < 0.001 vs. Control (Ctl); & P < 0.05 vs. CCH + Ethanol (CCH+ETH); # P < 0.05 and ## P < 0.01 vs. CCH.
4.2. Resveratrol Treatment Reduced Protein and mRNA Expression Levels of Lingo-1 in Rats Following Chronic Cerebral Hypoperfusion
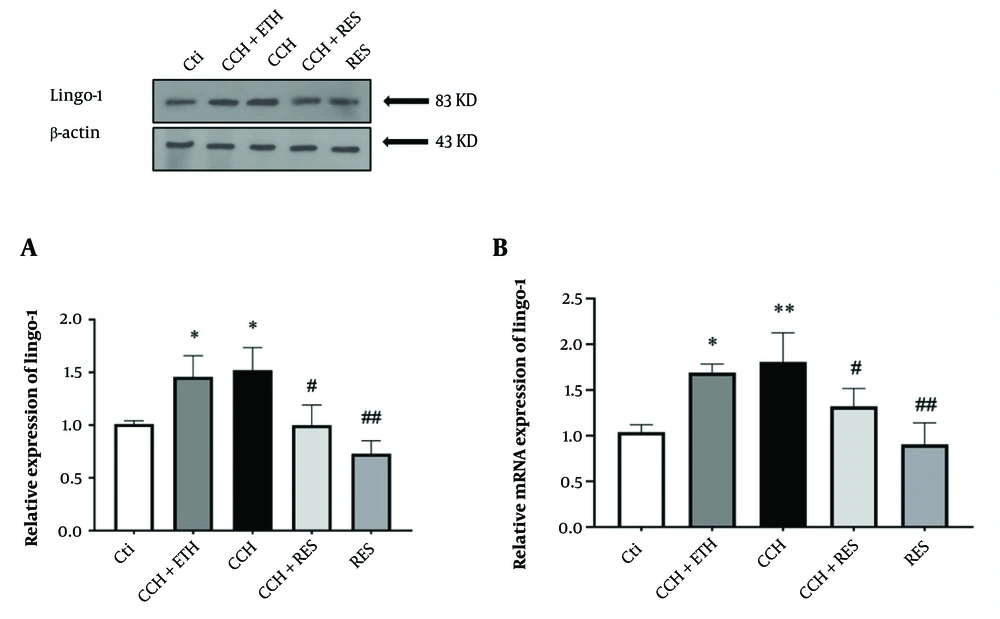
Lingo-1 expression – the protein (A) and mRNA (B) expression levels of Lingo-1 in the hippocampus were assessed in the following groups: Control (Ctl), chronic cerebral hypoperfusion (CCH), CCH + Ethanol (ETH), CCH + Resveratrol (RES) and RES. Results were normalized to β-actin expression. Data are expressed as mean ± SEM (n = 6); * P < 0.05 vs. Ctl, # P < 0.05 and ## P < 0.01 vs. CCH group.
4.3. Resveratrol Treatment Reduced Protein and mRNA Expression Levels of NgR1 in Rats Following Chronic Cerebral Hypoperfusion
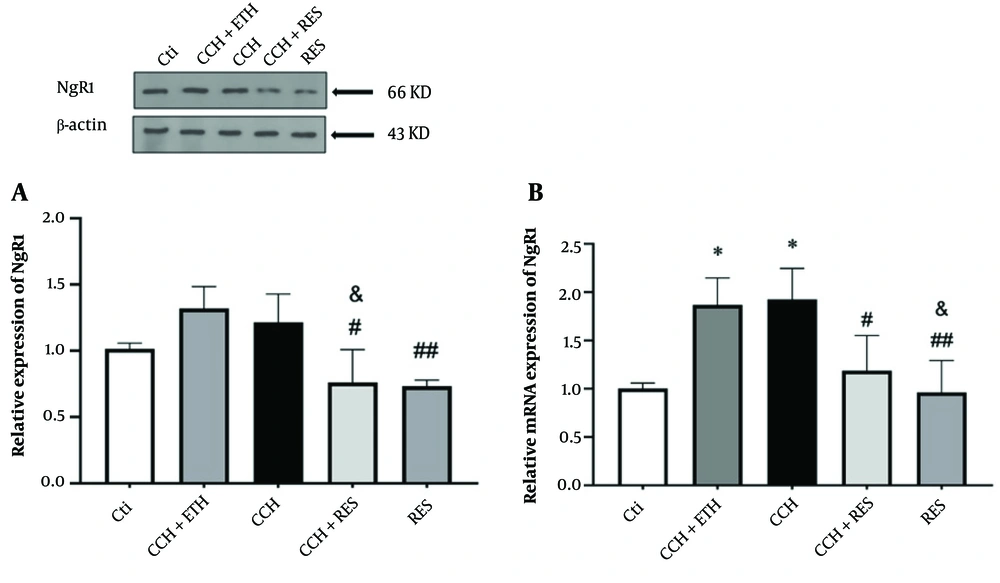
NgR1 expression – the protein (A) and mRNA (B) expression levels of NgR1 in the hippocampus were assessed in the following groups: Control (Ctl), chronic cerebral hypoperfusion (CCH), CCH + Ethanol (CCH + ETH), CCH+Resveratrol (CCH + RES) and resveratrol (RES). Results were normalized to β-actin expression. Data are expressed as mean ± SEM (n = 6); * P < 0.05 vs. Ctl, & P < 0.05 vs. CCH+ETH, # P < 0.05 and ## P < 0.01 vs. CCH group.
4.4. Resveratrol Treatment Reduced Protein and mRNA Expression Levels of P75 in Rats Following Chronic Cerebral Hypoperfusion
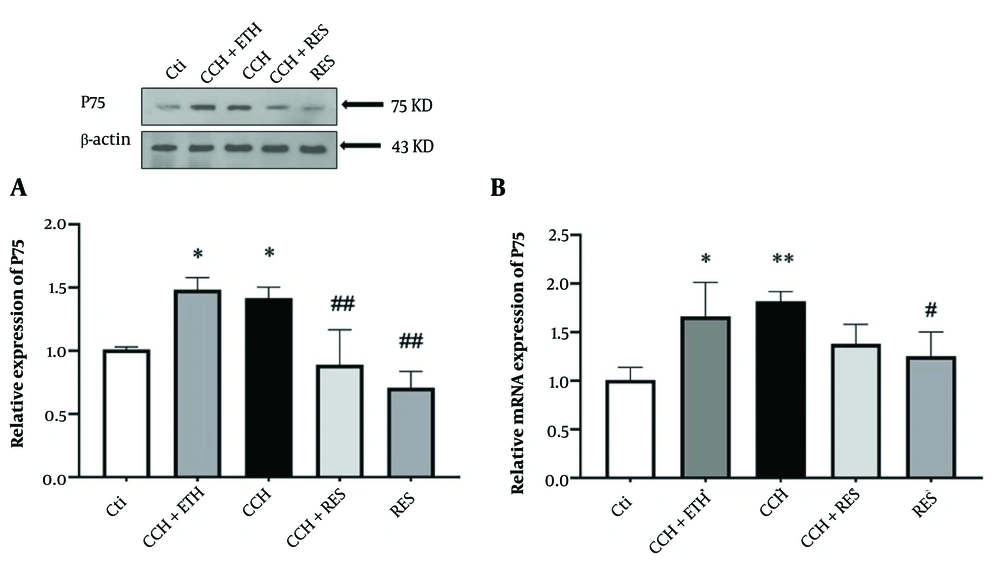
P75 expression – the protein (A) and mRNA (B) expression levels of P75 in the hippocampus were assessed in the following groups: Control (Ctl), chronic cerebral hypoperfusion (CCH), CCH + ethanol (ETH), CCH + resveratrol (RES) and RES. Results were normalized to β-actin expression. Data are expressed as mean ± SEM (n = 6); * P < 0.05 and ** P < 0.01 vs. Ctl, # P < 0.05 and ## P < 0.01 vs. CCH group.
4.5. Resveratrol Treatment Reduced Protein and mRNA Expression Levels of RhoA in Rats Following Chronic Cerebral Hypoperfusion
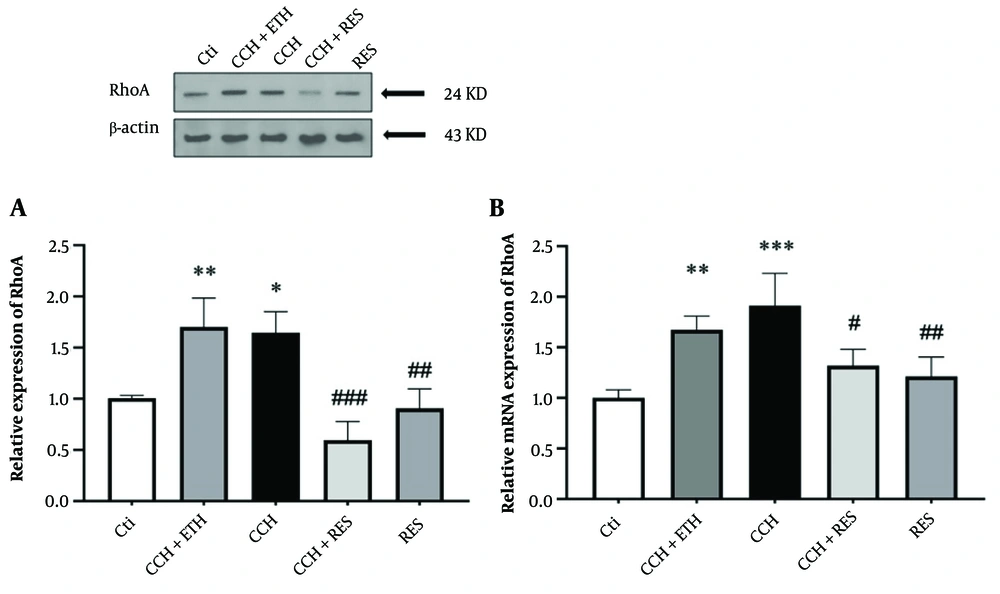
RhoA expression – the protein (A) and mRNA (B) expression levels of RhoA in the hippocampus were assessed in the following groups: Control (Ctl), chronic cerebral hypoperfusion (CCH), CCH + ethanol (ETH), CCH + resveratrol (RES) and RES. Results were normalized to β-actin expression. Data are expressed as mean ± SEM (n = 6); * P < 0.05, ** P < 0.01 and *** P < 0.001 vs. Ctl, # P < 0.05, ## P < 0.01 and ### P < 0.001 vs. CCH.
4.6. Resveratrol Treatment Reduced Protein and mRNA Expression Level of ROCK2 in Rats Following Chronic Cerebral Hypoperfusion
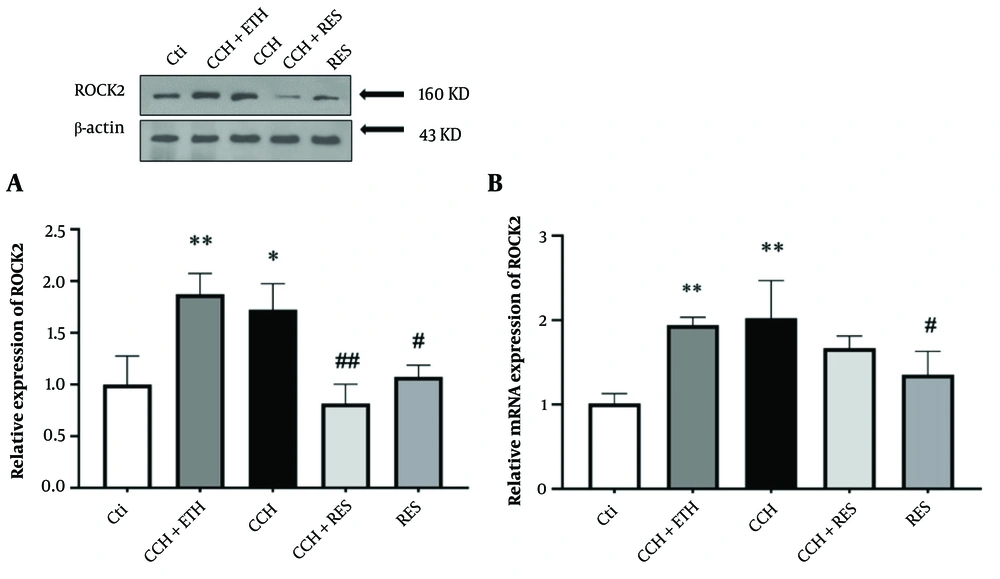
Rock2 expression – the protein (A) and mRNA (B) expression levels of ROCK2 in the hippocampus were assessed in the following groups: Control (Ctl), chronic cerebral hypoperfusion (CCH), CCH + ethanol (ETH), CCH + resveratrol (RES) and RES. Results were normalized to β-actin expression. Data are expressed as mean ± SEM (n = 6); * P < 0.05 and ** P < 0.01 vs. Ctl, # P < 0.05 and ## P < 0.01 vs. CCH.
4.7. Histopathologic Assessment
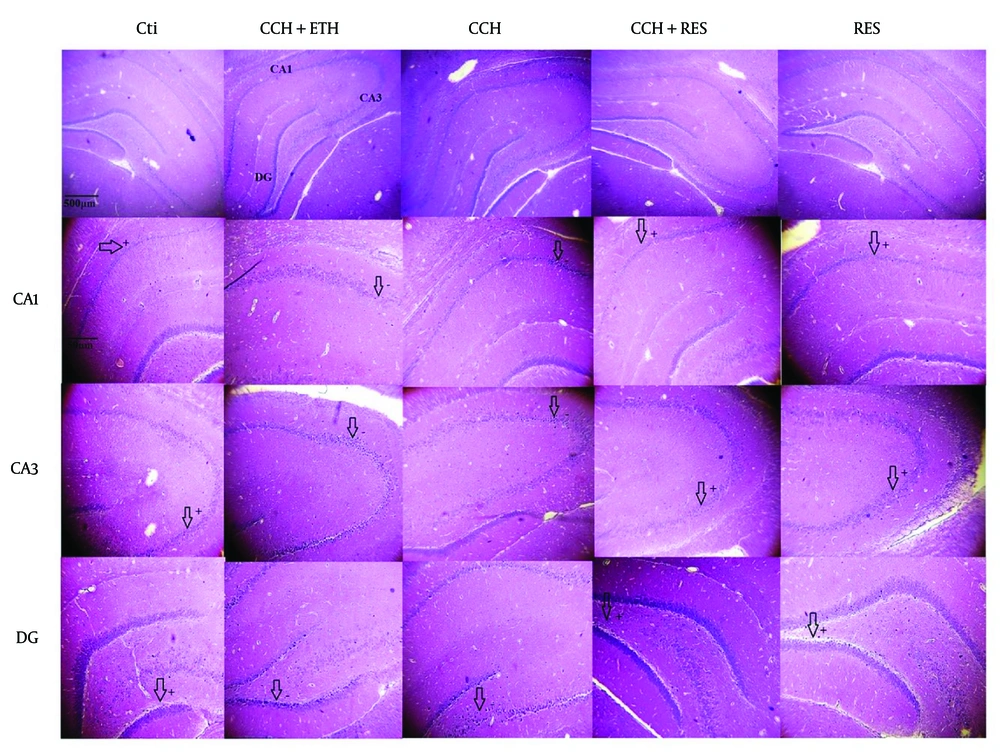
H&E staining in the CA1, CA3 and dentate gyrus (DG) of the rat hippocampus – neuronal death in the hippocampus was assessed in the following groups: Control (Ctl), chronic cerebral hypoperfusion (CCH), CCH + ethanol (ETH), CCH + resveratrol (RES) and RES groups. In the Ctl group, the cytoplasm is stained, and the nuclei are not fragmented in CA1, CA3 and DG. However, neurons are degenerated, and the nuclei are dense in CA1, CA3 and DG in the CCH and CCH + ETH groups. Resveratrol prevented CCH-induced neuronal death in the hippocampus. (Magnification 40X, 400X, scale bar = 200 µm or 50 µm).



