4.2. Fourier-Transform Infrared Results and Interpretation
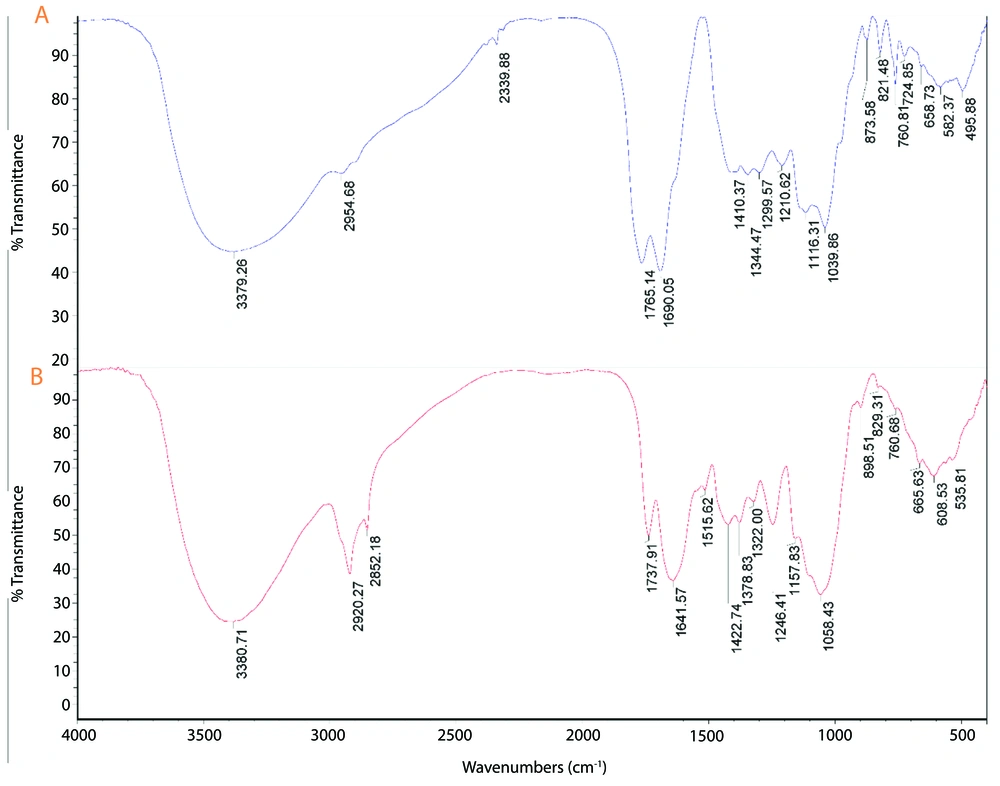
The FTIR spectrum of the plant extract exhibits characteristic peaks at various wavenumbers, indicating the presence of multiple functional groups (
Figure 2). Notable peaks include those at 535.81 cm
-1, 608.53 cm
-1, and 665.63 cm
-1, which are likely associated with C-H bending vibrations (
33). Peaks at 760.68 cm
-1 and 829.31 cm
-1 correspond to aromatic C-H bending, while the peaks at 1058.43 cm
-1 and 1157.83 cm
-1 are indicative of C-O stretching and C-O-C stretching vibrations, respectively (
34). The presence of peaks at 1246.41 cm
-1 and 1322.00 cm
-1 suggests C-N stretching and C-H bending vibrations. Additionally, the peaks at 1641.57 cm
-1 and 1737.91 cm
-1 correspond to the amide I band (C=O stretching) and carbonyl stretching vibrations, respectively (
35). The broad peak at 3380.71 cm
-1 is attributed to O-H stretching vibrations, indicating the presence of hydroxyl groups (
36).
Fourier-transform infrared spectroscopy (FTIR) spectra of A, the plant extract; and B, biosynthesized gold nanoparticles (AuNPs). The spectra display characteristic peaks corresponding to various functional groups.
4.3. Electronic Microscopy and Spectrophotometric Analysis Results of Biosynthesized Gold Nanoparticle
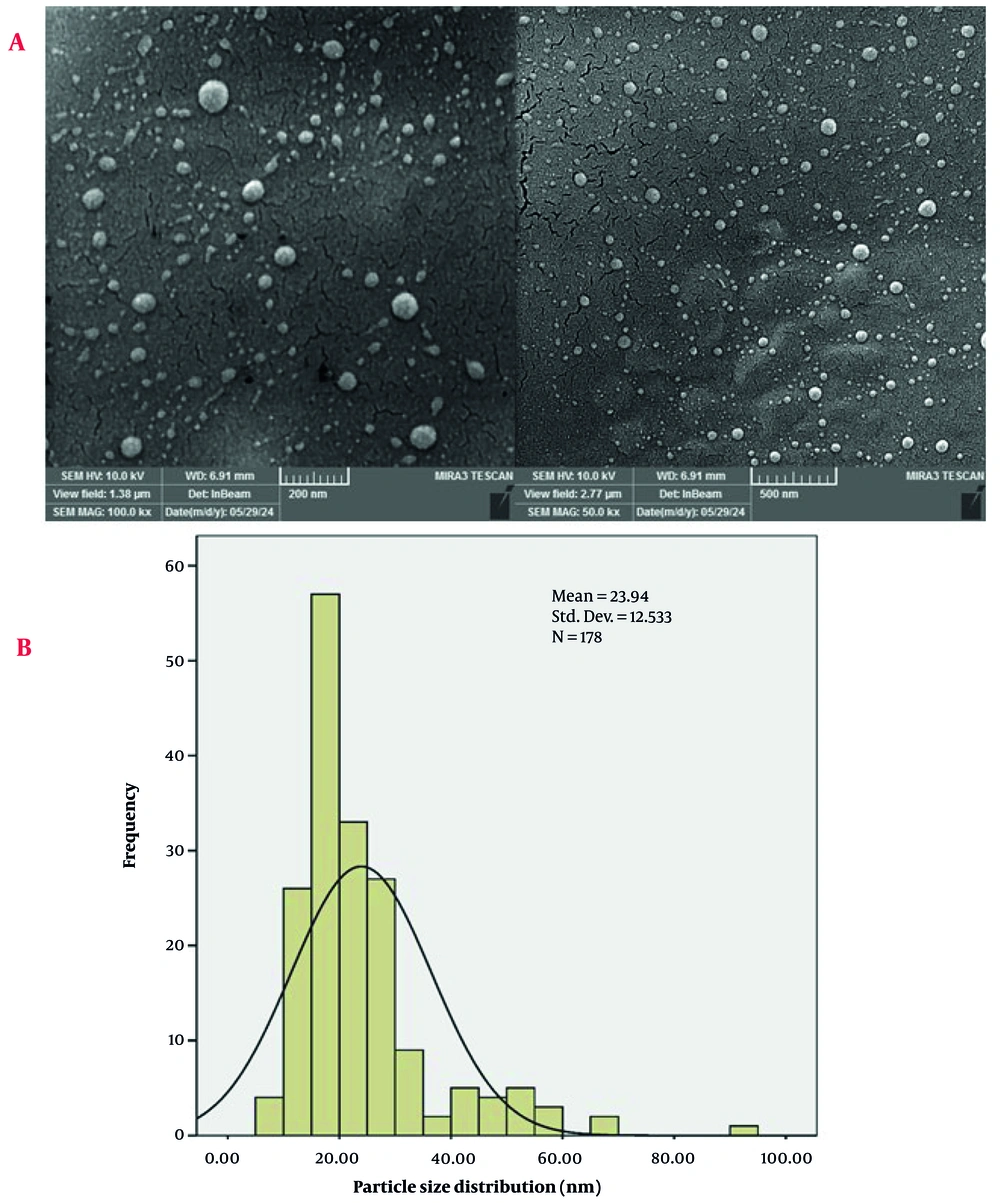
The FESEM images of the AuNPs provide detailed insights into their morphology and distribution (
Figure 3). The high-magnification image on the left, with a scale of 200 nm, reveals that the AuNPs are predominantly spherical. The particles appear to be well-dispersed with minimal agglomeration, indicating a uniform synthesis process. The surface of the nanoparticles is smooth, which is characteristic of high-purity AuNPs.
A, Field emission scanning electron microscopy (FESEM) images of gold nanoparticles (AuNPs) show the spherical morphology and smooth surface of the AuNPs; B, particle size distribution (PSD) of AuNPs
The particle size distribution (PSD) of the AuNPs was analyzed using FESEM images, with measurements conducted using ImageJ software and statistical analysis performed with SPSS software (
Figure 3). The histogram overlaid with a bell curve represents the frequency of particles within specific size ranges, indicating a normal distribution of particle sizes. The mean particle size of approximately 23.94 nm suggests that the majority of the AuNPs are within the nanoscale range, consistent with the high-resolution FESEM images. The standard deviation of 12.533 nm indicates some variability in particle sizes, which is typical for nanoparticles synthesized through green synthesis methods (
37-
39). This variability can be attributed to factors such as the dose of the reducing agent, reaction time, and temperature during the synthesis process.
The PSD analysis reveals that the AuNPs exhibit a relatively narrow size distribution, with most particles falling within the range of 10 to 40 nm. The bell curve suggests a normal distribution, indicating that the synthesis method produces nanoparticles with consistent sizes. The presence of a few larger particles, as indicated by the tail of the distribution, may be due to occasional agglomeration or variations in the synthesis conditions. Hence, the PSD analysis, combined with the FESEM images, confirms the successful synthesis of AuNPs with a mean size of 23.94 nm and a relatively narrow size distribution. This consistency in particle size enhances the potential applicability of the AuNPs in various fields, including catalysis, electronics, and biomedicine (
40-
43).
The difference between the PSD mean particle size (23.94 nm) and the crystallite size (8.31 nm) suggests that each gold nanoparticle is likely composed of multiple crystallites (
44,
45). This is a common observation in nanomaterials, where individual nanoparticles can consist of several smaller crystalline regions. The larger particle size from the PSD analysis also accounts for any surface coatings or organic residues from the plant extract, which are not considered in the crystallite size calculation (
46,
47).
The lower magnification image on the right, with a scale of 500 nm, provides a broader view of the nanoparticle distribution across the surface. This image shows that the AuNPs are evenly distributed, forming a relatively homogeneous layer. The absence of large aggregates suggests that the synthesis method effectively prevents particle agglomeration, which is crucial for maintaining the exclusive activity of nanoparticles (
48,
49). The uniform distribution and spherical morphology of the AuNPs are essential for their potential applications (
50-
52). Therefore, the FESEM images confirm the successful synthesis of high-quality AuNPs with desirable morphological characteristics.
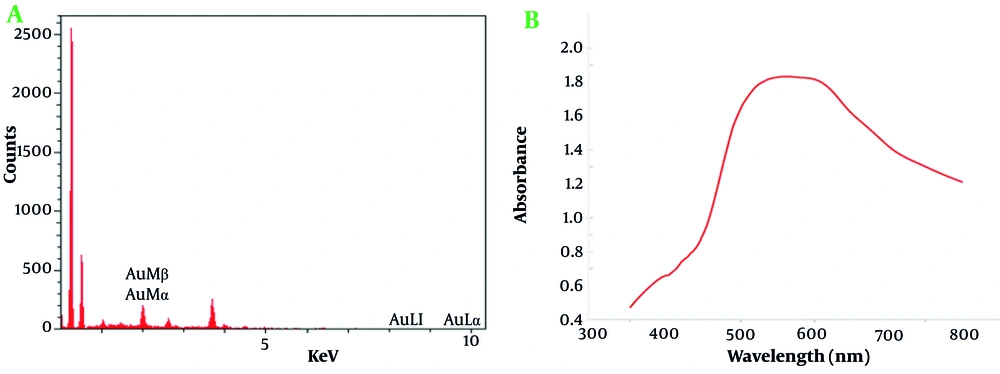
The energy-dispersive x-ray spectroscopy (EDX) analysis (
Figure 4) conducted on the AuNPs reveals critical details about their elemental composition, confirming the high purity and concentration of gold within the sample. The EDX spectrum exhibits distinct energy peaks specifically associated with gold, including Au Mβ, Au Mα, Au Ll, and Au La lines. These characteristic peaks, unique to gold, substantiate the successful synthesis of AuNPs with a notable degree of purity, an essential requirement for advanced nanotechnology applications. The Au La line displayed an intensity of 3.6 with a relative error of 1.48%, signifying a robust signal that supports the presence of gold with minimal background interference. Gold was quantified at 100% by both weight and atomic percent, with no significant detection of other elements, validating the high purity of the AuNPs. The PAP (Phi-Rho-Z) correction was applied, enhancing the reliability of the data by compensating for any potential matrix effects.
A, Energy-dispersive x-ray spectroscopy (EDX) spectrum of gold nanoparticles (AuNPs). The spectrum confirms the presence and high purity of gold in the nanoparticles; B, UV/Vis absorption spectrum of AuNPs
The EDX analysis included a preliminary scan for other potential elements to confirm the purity of the sample. Elements such as iron (Fe), tantalum (Ta), iridium (Ir), dysprosium (Dy), rhenium (Re), and osmium (Os) were flagged with a 100% detection probability in general identification algorithms. However, these elements were absent from the actual sample spectrum, with no peaks of significant intensity, reinforcing the conclusion that the AuNPs were devoid of notable impurities.
In this analysis, an accelerating voltage of 15.0 kV was used to generate definitive energy peaks in EDX spectroscopy, enhancing elemental analysis reliability. A beam current of 10,000 nA provided a high signal-to-noise ratio for precise gold peak detection with minimal background interference. The analysis at 35,000x magnification allowed detailed visualization of the nanoparticle composition. Both live and preset times were 10 seconds, optimizing high-resolution spectra capture while minimizing noise. The detector, equipped with a 0.1 µm dead layer, minimized interferences for accurate low-energy x-ray detection. A 20 µm gold layer on the detector enhanced sensitivity to gold emissions, and a 10 mm2 active area provided clear spectral results. The silicon detector crystal, 3.0 µm thick with a 15 nm aluminum coating, was ideal for detecting x-rays across gold’s energy range.
The UV/Vis absorption spectrum of AuNPs provides valuable information about their optical properties and size distribution. The spectrum displays a distinct peak in the absorbance curve around the 520 - 540 nm range, which is characteristic of the surface plasmon resonance (SPR) of AuNPs (
Figure 4). This SPR peak arises due to the collective oscillation of conduction electrons on the nanoparticle surface when exposed to light, and it is a key feature of metallic nanoparticles (
53).