


1. Background
2. Objectives
3. Methods
3.1. Data Acquisition
3.2. Differential Expression Analysis
3.3. Weighted Co-expression Network Analysis Analysis
3.4. GO and KEGG Analysis
3.5. Protein-Protein Interaction Network and Identification of Hub Genes
3.6. Support Vector Machine-Recursive Feature Elimination
3.7. Immunocyte Infiltration Analysis
3.8. Single-Cell Transcriptomic and Intercellular Communication Analysis
3.9. Multiplex Immunohistochemical Analysis
3.10. Software and Package Versions
4. Results
4.1. Identification of Key Genes in Diabetic Foot Ulcers
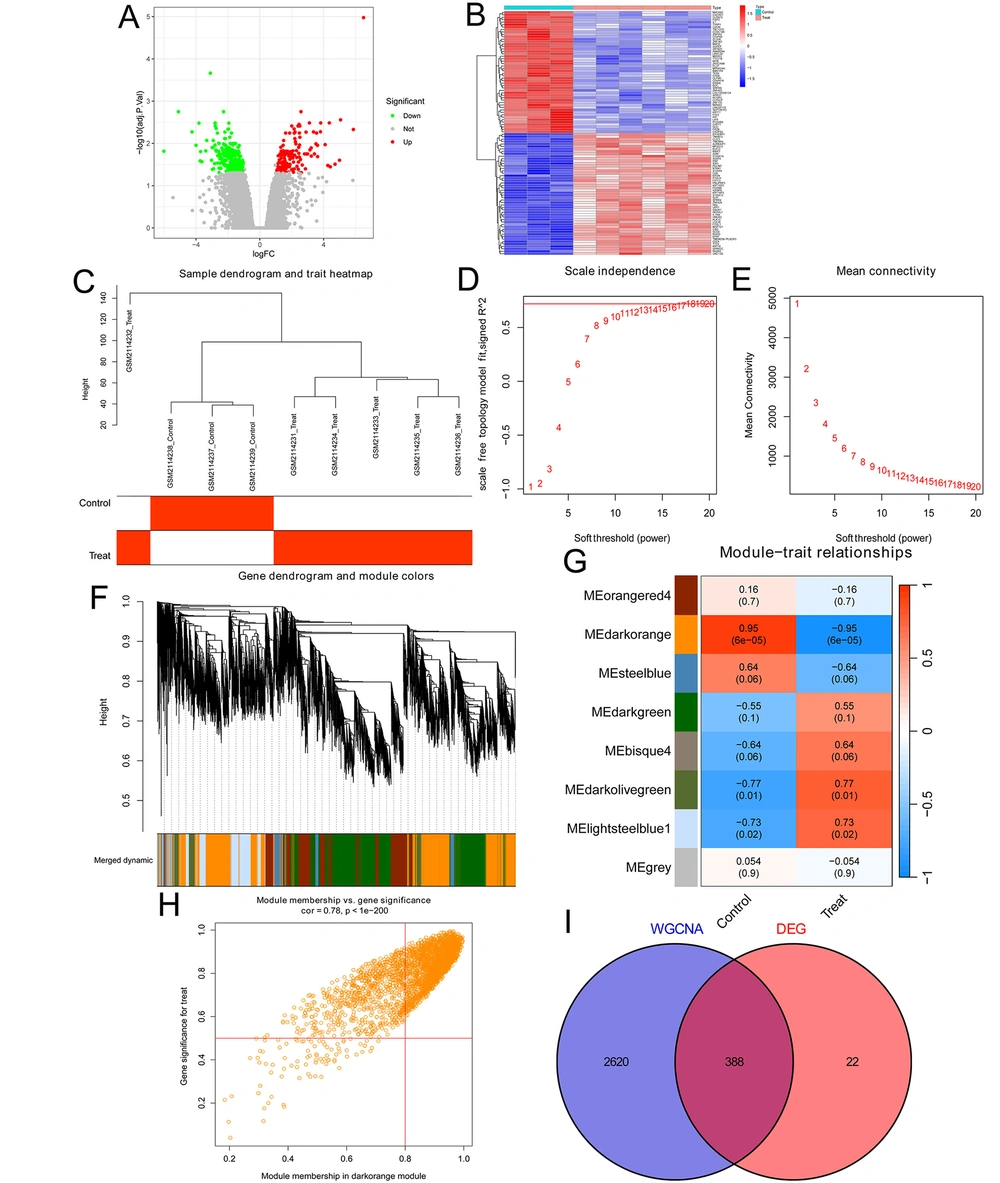
Identification of key genes in diabetic foot ulcers (DFUs): A, the volcano plot showed all DEGs with over a 2.0-fold change between 3 diabetic foot skin (DFS) tissues and 6 DFU tissues in the GSE80178 DFU datasets. 142 upregulated genes are marked in red, and 268 downregulated genes are marked in green; B, the cluster heat map showed the expression of the top 50 and bottom 50 DEGs; C, the sample clustering tree of 3 DFS tissues and 6 DFU tissues; D, analysis of the Scale-Free Index for various soft-threshold powers; E, analysis of the mean connectivity for various soft-threshold powers; F, dendrogram of genes clustered based on the measurement of dissimilarity. The color band shows the results of identifying modules and merging similar modules; G, heatmap of the correlation between the module eigengenes and DFUs; H, analysis of gene significance for DFUs and module membership in the dark orange module; I, Venn diagram showing the intersection of the DEGs in the DFUs and the DFU-associated genes in the dark orange module.
4.2. Constructing Protein-Protein Interaction Network and Identifying Specific Biomarkers in Diabetic Foot Ulcers
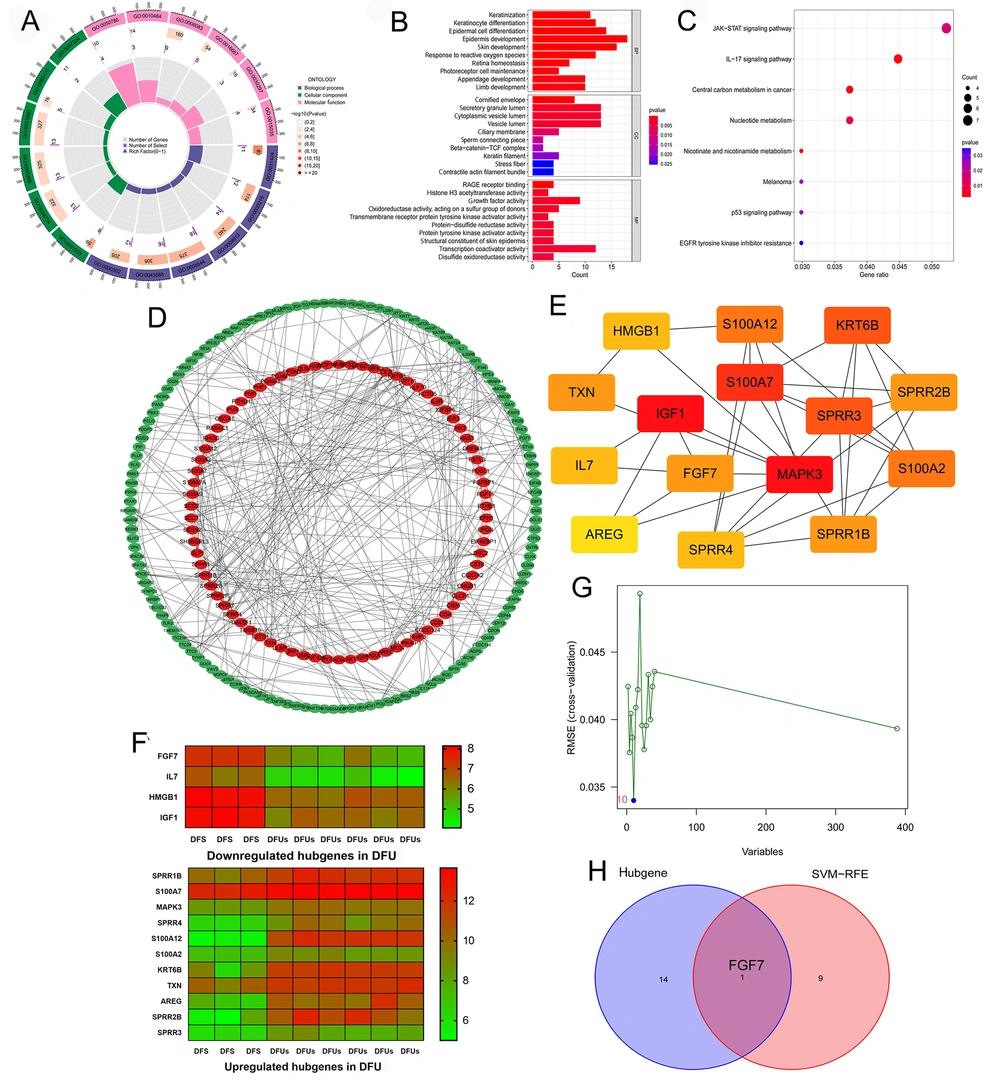
Constructing protein-protein interaction (PPI) network and identifying specific biomarkers in diabetic foot ulcers (DFUs): A, GO enrichment analysis of the 388 key genes. BP, CC, and molecular function (MF) are displayed in different colors, respectively. All genes and the number of key genes of DFUs involved in different cell functions are also displayed; B, GO enrichment analysis of the 388 key genes, showing the top ten cell functions of BP, CC, and MF involved in these key genes; C, KEGG enrichment analysis of the 388 key genes showcased the signaling pathways involved in these key genes; D, the PPI network of the 388 key genes was constructed using the STRING website and Cytoscape software; E, the cytoHubba plugin in Cytoscape software identified the 15 network hub genes, and the network diagram of these hub genes is shown; F, the expression of 15 hub genes in DFS and DFUs from the GSE80178 datasets; G, support vector machine-recursive feature elimination (SVM-RFE) was used to screen out the potential diagnostic biomarkers of DFUs among 388 key genes, and 10 genes were identified as diagnostic biomarkers for DFUs; H, the intersection of the results of hub genes and SVM-RFE.
4.3. Single-Cell Transcriptomic and Immune Cell Analysis of Diabetic Foot Ulcers
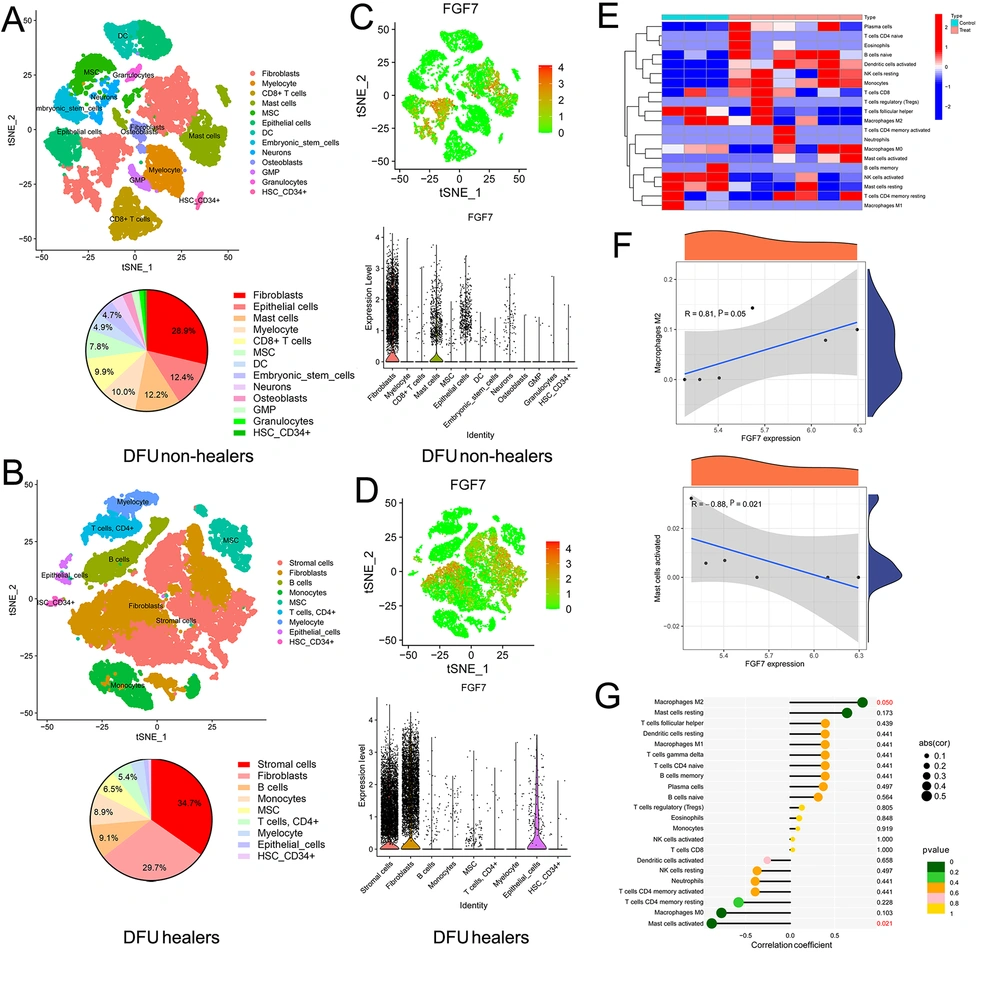
Single-cell transcriptomic and immune cell analysis of diabetic foot ulcers (DFUs): A, the cellular landscape of DFU non-healers by analyzing single-cell transcriptomic datasets of DFUs (GSE165816). The cell clusters were annotated according to various canonical markers based on the expression of specific markers, and we also calculated the proportion of different cells; B, the cellular landscape of DFU healers. We annotated various cell clusters according to the expression of specific markers and calculated the proportion of different cells; C, the expression of FGF7 in different cells of DFU non-healers; D, the expression of FGF7 in different cells of DFU healers; E, analysis of immune cell levels in 3 diabetic foot skin (DFS) tissues and 6 DFU tissues based on DFU datasets; F, correlation analysis between the expression of FGF7 and the level of M2 macrophages, and the correlation between the expression of FGF7 and the level of activated mast cells; G, the lollipop chart shows the correlation between the expression of FGF7 and all immune cells.
4.4. Deciphering Intercellular Communication in Diabetic Foot Ulcers Healers and Diabetic Foot Ulcers Non-healers
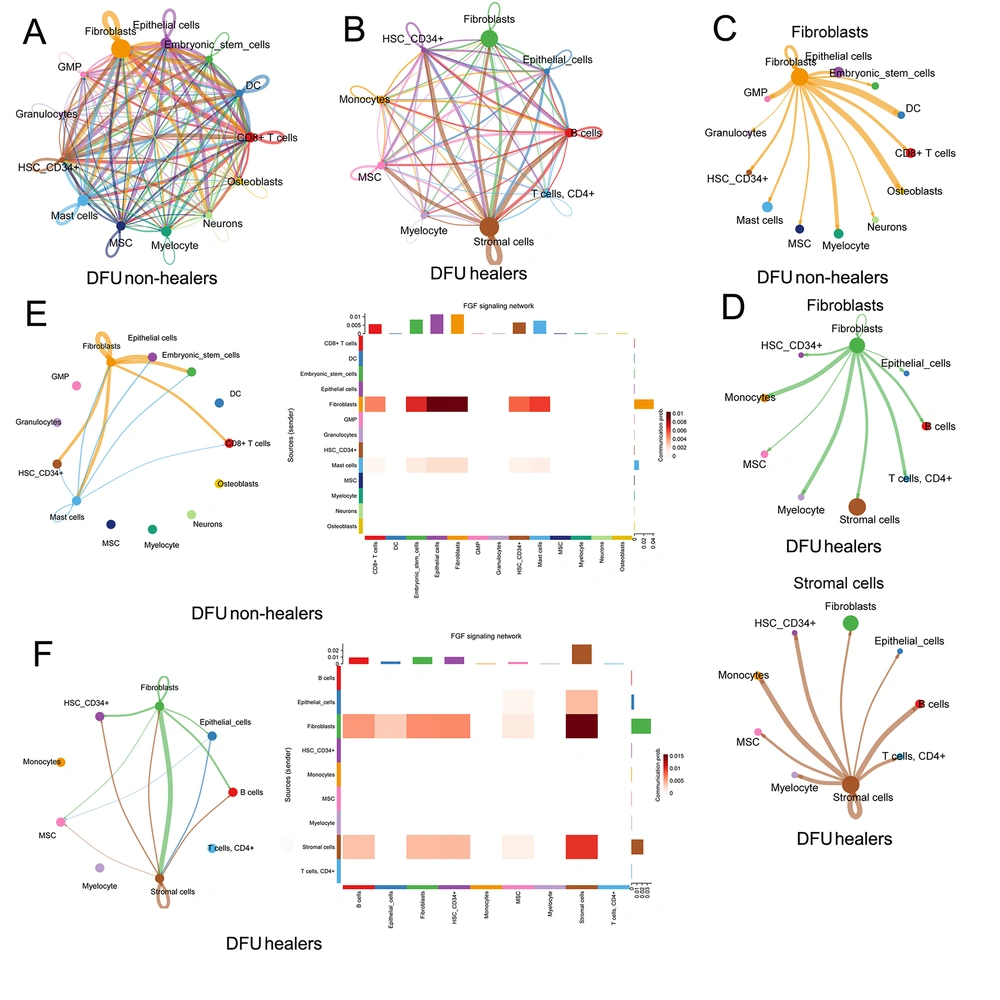
Deciphering intercellular communication in diabetic foot ulcer (DFU) healers and DFU non-healers: A, all the potential intercellular communication networks in DFU non-healers; B, all intercellular communication networks in DFU healers; C, the intercellular communication pathways between fibroblasts and other cells in DFU non-healers; D, the intercellular communication pathways between fibroblasts and stromal cells and other cells in DFU healers; E, intercellular fibroblast growth factor (FGF) signaling network involving FGF7 in DFU non-healers; F, intercellular FGF signaling network involving FGF7 in DFU healers.
4.5. Exploring the Fibroblast Growth Factor Pathway of Diabetic Foot Ulcers Involved by FGF7 and mIHC Validation
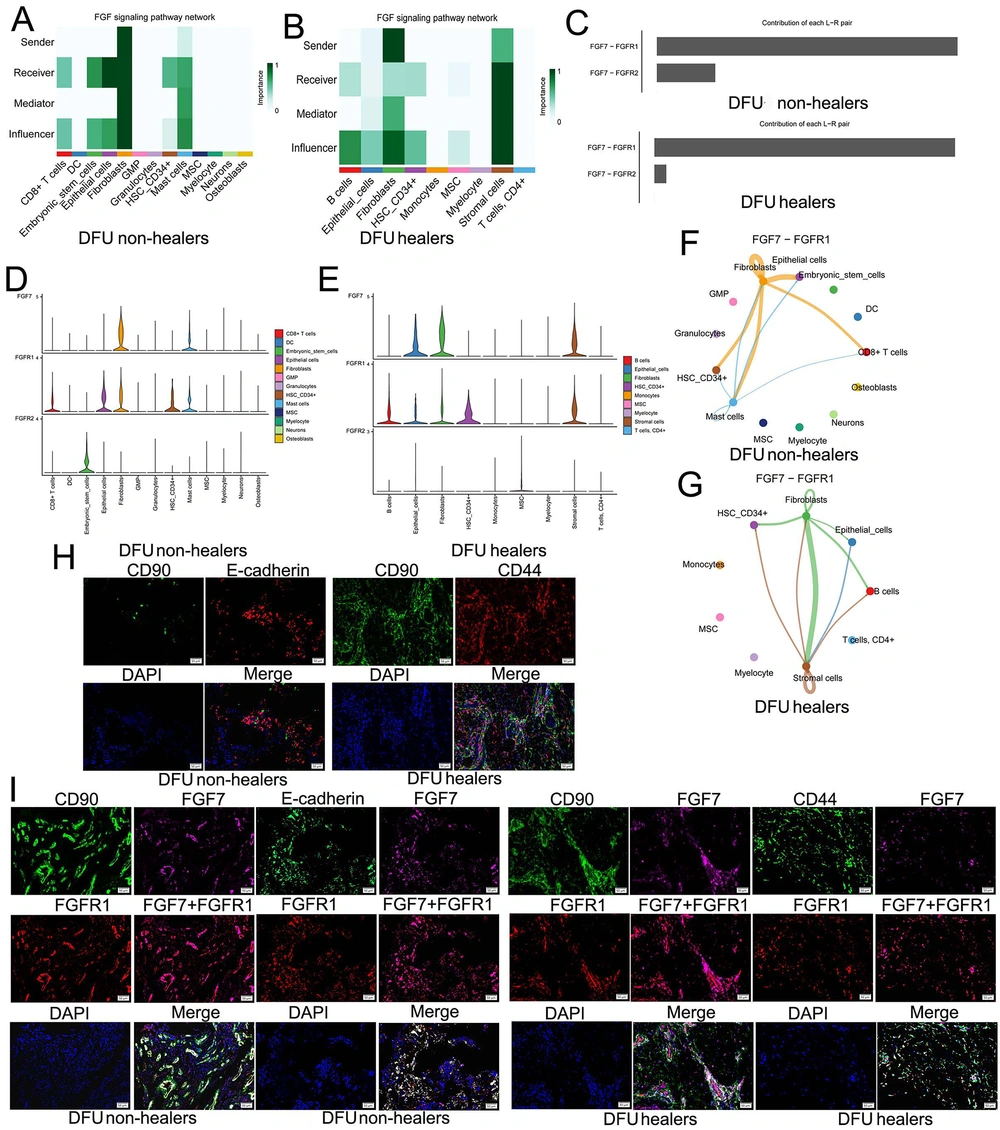
Exploring the fibroblast growth factor (FGF) pathway of diabetic foot ulcers (DFUs) involved by FGF7 and mIHC validation: A, in DFU non-healers, we analyzed the roles of different cells in the FGF signaling pathway network, including sender, receiver, influencer, and mediator; B, we analyzed the roles of different cells in the FGF signaling pathway network of DFU healers, including sender, receiver, influencer, and mediator; C, the contribution of FGF7-FGFR1 and FGF7-FGFR2 in DFUs; D, expression of FGF7 and its receptor FGFR1 and FGFR2 in DFU non-healers; E, expression of FGF7 and its receptor FGFR1 and FGFR2 in DFU healers; F, intercellular communication involved in the FGF7-FGFR1 signaling pathway in DFU non-healers; G, intercellular communication involved in the FGF7-FGFR1 signaling pathway in DFU healers; H, mIHC assay confirmed the presence of crosstalk in fibroblasts, epithelial cells, and stromal cells; I, in DFU non-healers and DFU healers, the mIHC assay showed that FGF7 and FGFR1 co-expressed in CD90+ fibroblasts, E-cadherin+ epithelial cells, and CD44+ stromal cells.





