


1. Background
2. Objectives
3. Methods
3.1. Collection and Storage of Nigella sativa Seeds
3.2. Supercritical Fluid Extraction
3.3. Solvent Methods
3.4. Gas Chromatography-Mass Spectrometry
3.5. Synthesis of Black Seed Oil Nanoemulsion
3.6. Characterization of Black Seed Oil-Loaded Nanoemulsion
3.7. Construction of Pseudo-Ternary Phase Diagram
3.8. Thermodynamic Stability
3.9. Stability Index
3.10. Animals
3.11. Induction of an Atherosclerosis Mouse Model
3.12. Blood Sampling
3.13. Tissue Preparation
3.14. Measurement of Serum Lipid Profiles
3.15. Oxidative Stress Analysis
3.16. Histopathology
3.17. Statistical Analysis
4. Results
4.1. Gas Chromatography-Mass Spectrometry Studies
4.2. Characterization of Black Seed Oil Nanoemulsion
4.2.1. Dynamic Light Scattering and Determination of Zeta Potential
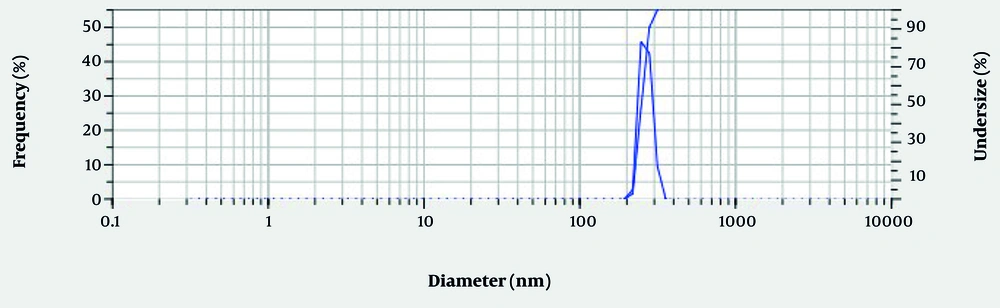
Characteristics of the size of nano-emulsion formulation using the dynamic light scattering (DLS) technique
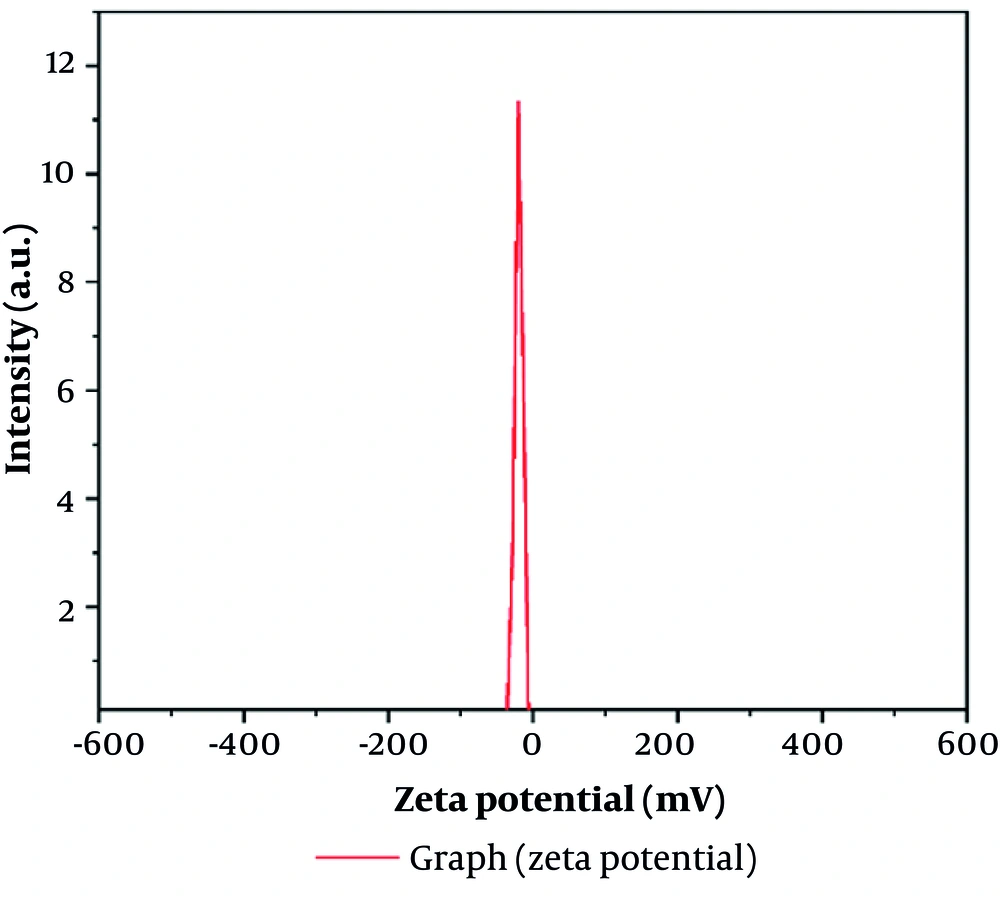
Zeta-potential distribution of nano-emulsion formulation using dynamic light scattering (DLS) technique (B).
| Electrophoretic Mobility | Zeta Potential | Peak No. |
|---|---|---|
| 0.000143 cm2/Vs | -18.4 mv | 1 |
4.2.2. Transmission Electron Microscope Image Analyses
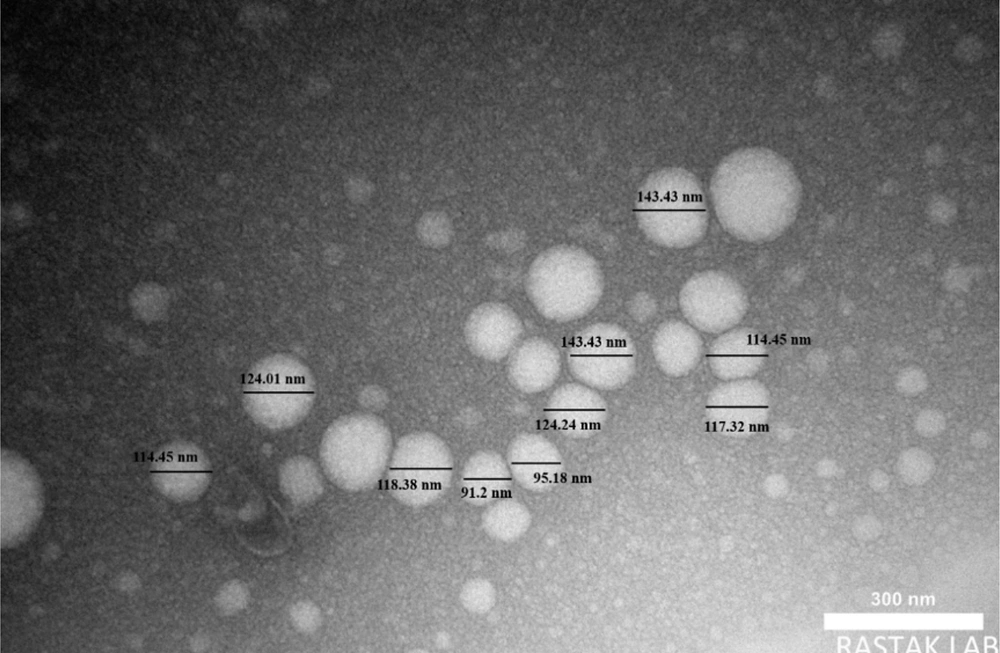
The transmission electron microscope (TEM) micrograph of the prepared nano-emulsion (scale 300 nm).
4.3. Alterations in Serum Lipid Profiles
| Groups | H | AS | SIM | B | BS | BBS |
|---|---|---|---|---|---|---|
| HDL (mg/dL) | 33.05 ± 0.8 AB | 26.93 ± 1.1 B | 40.65 ± 1.9 CD | 35.55 ± 0.59 AC | 46.54 ± 2.44D | 59.79 ± 2.03 E |
| TG (mg/dL) | 76.38 ± 3.05 A | 223.6 ± 4.83 B | 136.1 ± 2.19 C | 179.4 ± 3.1 D | 158.8 ± 3.77 E | 146.1 ± 3.44 EC |
| Cholesterol (mg/dL) | 117.0 ± 3.6 A | 363.6 ± 4.7 B | 226.1 ± 5.6 C | 293.9 ± 3.8 D | 254.4 ± 4.2 E | 217.3 ± 4.1 |
| LDL (mg/dL) | 58.50 ± 1.8A | 776.8 ± 50.1B | 208.8 ± 14.6C | 623.1 ± 34.2D | 313.9 ± 11.7E | 318.8 ± 52.6E |
| Atherogenic Coefficient | 2.54 ± 0.02 A | 12.5 ± 0.75 B | 4.56 ± 0.19 C | 7.27 ± 0.42 D | 4.46 ± 0.2 C | 2.63 ± 0.02 A |
| Cardiac Risk Ratio | 3.54 ± 0.02A | 13.50.75 B | 5.56 ± 0.19 C | 8.26 ± 0.42 D | 5.46 ± 0.19 C | 3.63 ± 0.02 A |
Abbreviations: HDL, high-density lipoprotein; TG, triglyceride; LDL, low-density lipoprotein.
a H, healthy; AS, atherosclerotic model; SIM, AS and simvastatin (15 mg/kg); B, AS and berberine (30 mg/kg); BS, AS and nanoemulsion of black seed oil (10%); BBS, AS and berberine (1%) nanoemulsion of black seed oil (10%).
b Values are expressed as mean ± SEM (n = 8).
c A, B, C, D, and E indicate significant differences between groups.
4.4. Evaluation of Changes of Atherogenic Coefficient and Cardiac Risk Ratio
4.5. Oxidative Stress Analysis
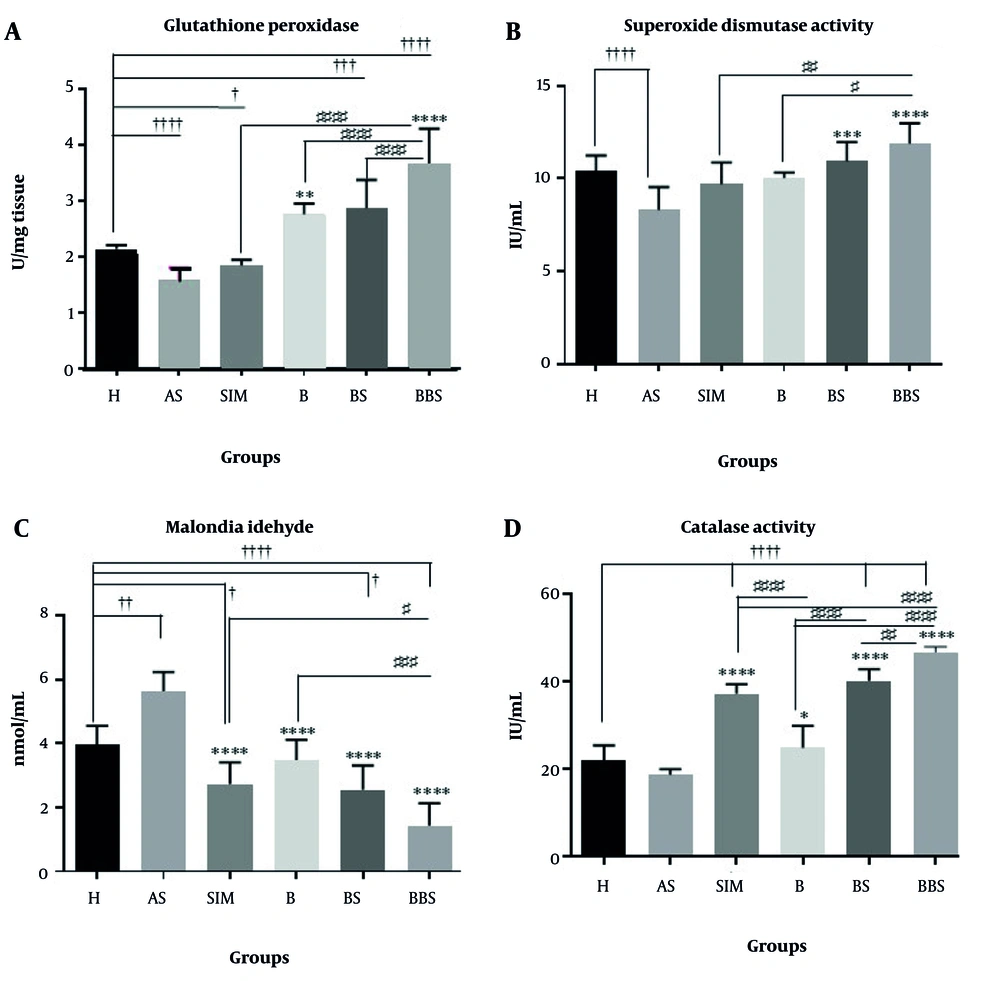
Effects of nanoemulsion berberine (BBR) on C57BL/6 J mice’s serum antioxidant status. A, glutathione peroxidase (GPX); B, superoxide dismutase (SOD) activity; C, malondialdehyde (MDA); and D, catalase (CAT) activity (Abbreviations: H, healthy; AS, atherogenic diet); SIM, AS and simvastatin (15 mg/kg); B, AS and BBR (30 mg/kg); BS, AS and nanoemulsion of black seed oil (10%); BBS, AS and BBR (1%) nanoemulsion of black seed oil (10%). Comparison of H group with AS, SIM, B, BS, and BBS groups † P < 0.05, †† P < 0.01, ††† P < 0.001, and †††† P < 0.0001; Comparison of AS group with H, SIM, B, BS, and BBS groups * P < 0.05, ** P < 0.01, *** P < 0.001, and **** P < 0.0001; Comparison of SIM, B, BS, and BBS groups together # P < 0.05, ## P < 0.01, ### P < 0.001, and #### P < 0.0001. Values are expressed as Mean ± SEM (n = 8).
4.6. Aorta Histopathological Examination
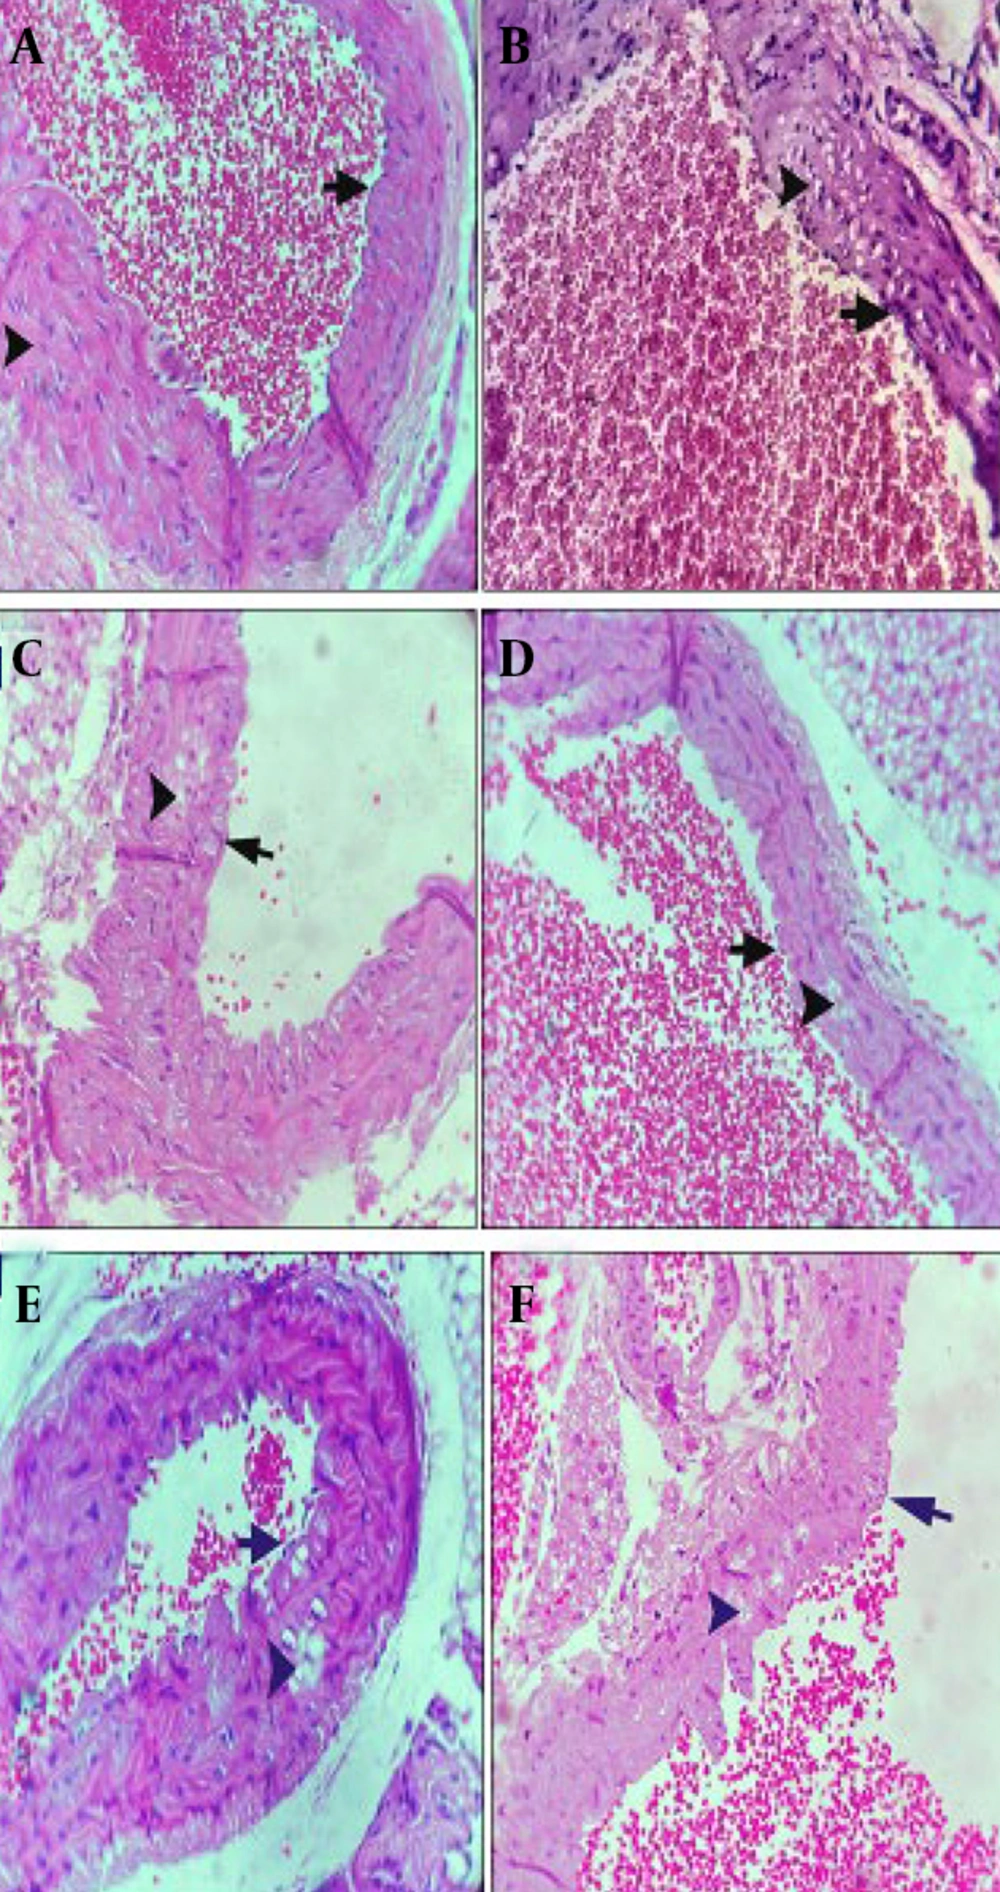
A, the middle layer of the vessel in the healthy control group is indicated by the arrowhead (400X); B, cholesterol plaques (arrowhead) and significant endothelial hyperplasia (arrow) in the AS group (400X). C, the SIM group consists of cholesterol plaques (arrowhead) and mild endothelial hyperplasia (arrow) (400X); D, small cholesterol plaques (arrowheads) in the medial layer of the vessel, healthy endothelium (arrow) (400X); E, in the BBS group, cholesterol plaques (arrowhead) and mild endothelial hyperplasia (arrow) (400X); F, in the BS group, significant cholesterol plaques (arrowhead) and mild endothelial hyperplasia (arrow) (400X).
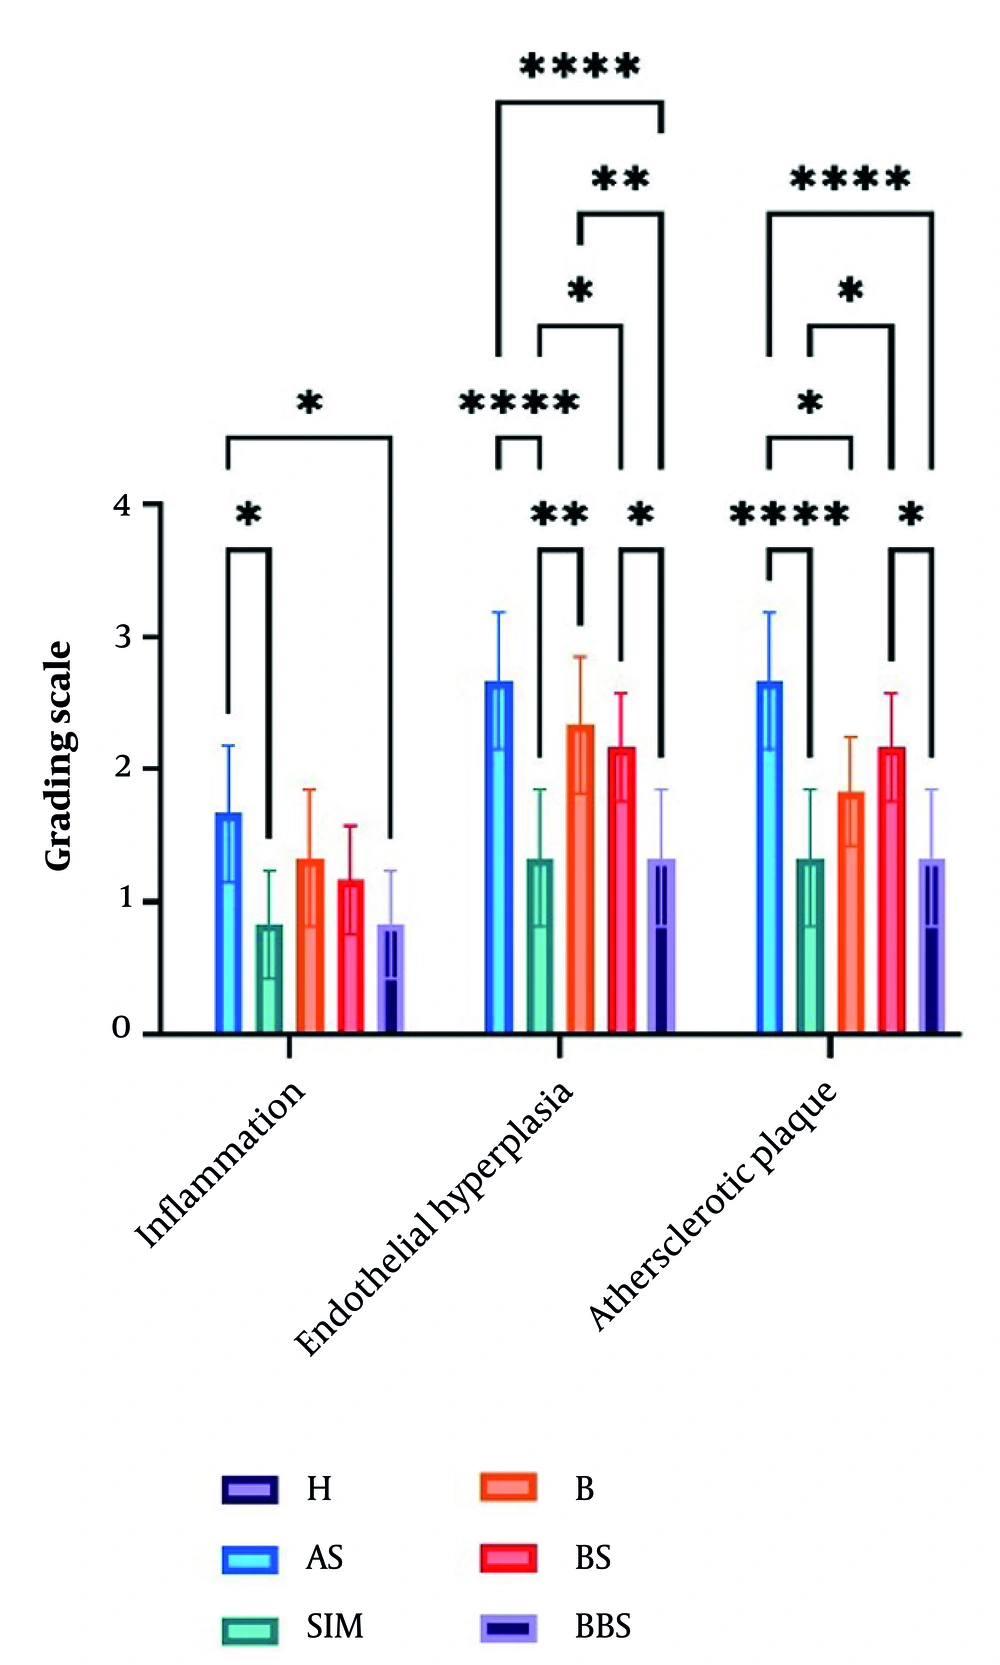
The atherosclerotic plaque grading used in the histology figure (Abbreviations: H, healthy; AS, atherogenic diet); SIM, AS and simvastatin (15 mg/kg); B, AS and BBR (30 mg/kg); BS, AS and nanoemulsion of black seed oil (10%); BBS, AS and BBR (1%) nanoemulsion of black seed oil (10%). Comparison of groups * P < 0.05, ** P < 0.01, and **** P < 0.0001.



