Root mean square deviation (RMSD) serves as a prevalent quantitative metric in MD simulations for evaluating the temporal stability and conformational transitions of biomolecular systems, specifically proteins and their ligand complexes (
32). Generally, lower RMSD values indicate a more structurally consistent system throughout the simulation, whereas higher values suggest significant structural fluctuations or pronounced conformational changes. As illustrated in Figure S1-A in Supplementary File, the RMSD of the ROR-1 protein in its unbound state remains consistently low and stable over the course of the simulation, with the calculated values staying below 0.3 nm. The RMSD of the acidocin J1132 β-ROR-1 complex (indicated in yellow) initiates within the range of 0.4 to 0.5 nm and exhibits a progressive increase, punctuated by discernible oscillations throughout the simulation timeline. Approaching 80 ns, the complex attains a maximum RMSD value, signifying substantial alterations in its conformation. Nevertheless, the general trend observed is analogous to that of acidocin 8912, implying a moderate degree of stability characterized by intermittent phases of conformational readjustment. Conversely, the RMSD trajectory for the acidocin 8912-ROR1 complex (depicted in purple) reaches its apex at approximately 0.5 nm around the 27 ns mark, after which it demonstrates a stabilization. The overall RMSD profile exhibits a trend analogous to that observed for acidocin J1132 β, characterized by moderate fluctuations, which suggests that acidocin 8912 induces alterations in the molecular conformation that subsequently reach a stable state. Notably, the RMSD values for the acidocin A-ROR-1 complex (represented in green) remain comparatively low, ranging from 0.4 to 0.5, indicating a lower degree of structural dynamics relative to the systems depicted by the yellow and purple lines. This observation implies that acidocin A establishes a more consistent interaction with ROR-1, resulting in fewer conformational alterations within the receptor and thus forming a more stable complex. Conversely, the RMSD values for the acidocin B-ROR-1 complex (indicated in blue) are the highest among the complexes examined, reaching up to 0.9 nm. This elevated RMSD suggests that acidocin B induces significant structural rearrangements in ROR-1, indicating a more dynamic and less stable interaction compared to the other peptides under investigation.
The RMSF profile for the isolated ROR-1 protein (depicted in black in Figure S1-B in Supplementary File) demonstrates consistently low values across all amino acid residues. This observation signifies a structurally stable protein with minimal internal dynamics and conformational flexibility. In contrast, the formation of the acidocin J1132 β-ROR-1 complex (illustrated in yellow) results in a notable increase in residue fluctuations, particularly within the region spanning residues 370 to 400. This augmented flexibility suggests that binding of acidocin J1132 β induces significant conformational alterations in these specific segments of the ROR-1 protein. These findings imply a dynamic interaction between the two molecules, which consequently affects the overall stability of the resulting complex. The RMSF profile of the acidocin 8912-ROR-1 complex (illustrated in purple) exhibits pronounced peaks in the vicinity of residues 390 and 430. These regions of heightened flexibility are analogous to those observed in the acidocin J1132 β. While the presence of these fluctuations suggests that acidocin 8912 binding elicits significant conformational alterations within the complex, the recurrence of similar flexibility patterns implies the existence of shared regions that undergo dynamic changes upon peptide binding. The acidocin A-ROR-1 complex (represented in green) exhibits consistently reduced RMSF values, particularly within the amino acid sequence ranges of 370 - 400 and 420 - 450, relative to the comparative complexes. This observation suggests that acidocin A establishes a more stable and structurally constrained interaction with ROR-1. This tighter binding interface consequently results in diminished conformational dynamics within the complex and an overall enhancement of its structural integrity. The reduced RMSF values observed across these crucial regions correlate with the lowest RMSD values. This consistency substantiates the strong and stable binding of acidocin A to ROR-1. Conversely, the acidocin B-ROR-1 complex (indicated in blue) exhibits the highest RMSF values among all the complexes analyzed, particularly around amino acid residues 390 and 430. This elevated RMSF suggests that acidocin B induces significant conformational changes and increased flexibility within the ROR-1 protein structure. This implies a more dynamic and, consequently, a less stable interaction in comparison to the other peptides investigated. These RMSF findings provide additional corroborative evidence supporting the conclusions drawn from the RMSD analysis and molecular docking studies.
The radius of gyration (Rg), as illustrated in Figure S1-C in Supplementary File, serves as a metric within MD simulations to quantify the spatial extent or compactness of a protein or protein-ligand complex. Specifically, Rg indicates how the molecule’s mass is distributed relative to its center of mass. A lower Rg value generally signifies a more densely packed or globular structure, whereas a higher Rg value suggests a more extended or less compact conformational state. The Rg for unbound ROR-1 (indicated in black) exhibits consistent and low values, approximately 1.3 nm, throughout the simulation period. This observation suggests that in the absence of ligand binding, ROR-1 adopts and maintains a compact and stable 3D architecture, indicative of its intrinsic structural stability. Conversely, the acidocin J1132–β-ROR-1 complex (represented in yellow) demonstrates slightly elevated Rg values, which stabilize around 1.45 nm. This suggests that the complex exhibits relative stability but displays a slightly more expanded conformation compared to ROR-1 in its unbound state. This observation implies a moderate level of stability accompanied by some structural rearrangements upon acidocin J1132 β binding. The Rg for the acidocin 8912-ROR-1 complex (indicated in purple) shows values around 1.5 nm, which is similar to that of acidocin J1132 β alone. The fluctuations observed are moderate, suggesting a stable complex; however, the increased conformational changes compared to ROR-1 alone suggest an intermediate level of overall stability. The acidocin A-ROR-1 complex (depicted in green) exhibits Rg values in the approximate range of 1.55 to 1.6 nm. Notably, despite these elevated values, this complex demonstrates fewer fluctuations in its Rg compared to the majority of other complexes examined, with the exception of the unbound ROR-1 protein. This observation suggests that acidocin A promotes a more stable and compact structural arrangement upon interaction with ROR-1. This inference is further supported by RMSD and RMSF analyses, which indicated a robust and stable binding interaction. Conversely, the acidocin B-ROR-1 complex (illustrated in blue) displays the highest Rg values among all the complexes investigated, registering around 1.6 to 1.7 nm.
Hydrogen bonds play a pivotal role in determining the stability and specificity of interactions between proteins and their ligands (
32). As depicted in Figure S1-D in Supplementary File, MD simulations of the acidocin J1132-β-ROR-1 complex (rendered in yellow) revealed the formation of up to 12 hydrogen bonds throughout the simulation trajectory. This substantial number suggests a strong interaction, although it exhibits dynamic behavior, with periods of both hydrogen bond formation and disruption, ultimately reflecting an interaction of moderate overall stability. In contrast, the acidocin 8912-ROR-1 complex consistently formed up to 10 hydrogen bonds. This sustained hydrogen bond network suggests a stable interaction, maintaining an intermediate level of stability throughout the simulated timeframe. Notably, the acidocin A-ROR-1 complex exhibited the highest number of hydrogen bonds, reaching a maximum of 14 during the simulation. This extensive hydrogen bonding network signifies a very strong and stable interaction, consistent with prior RMSD, RMSF, and Rg analyses, which collectively identified acidocin A as the most stable and effective binding partner. Meanwhile, the acidocin B–ROR-1 complex formed a maximum of 7 hydrogen bonds.
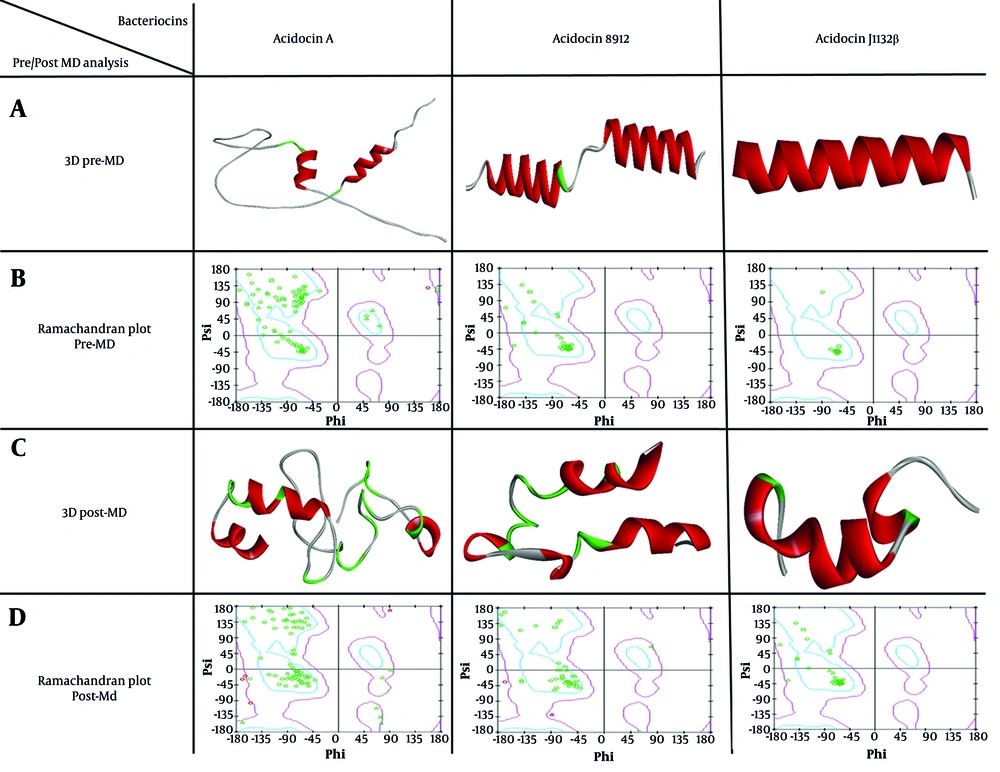
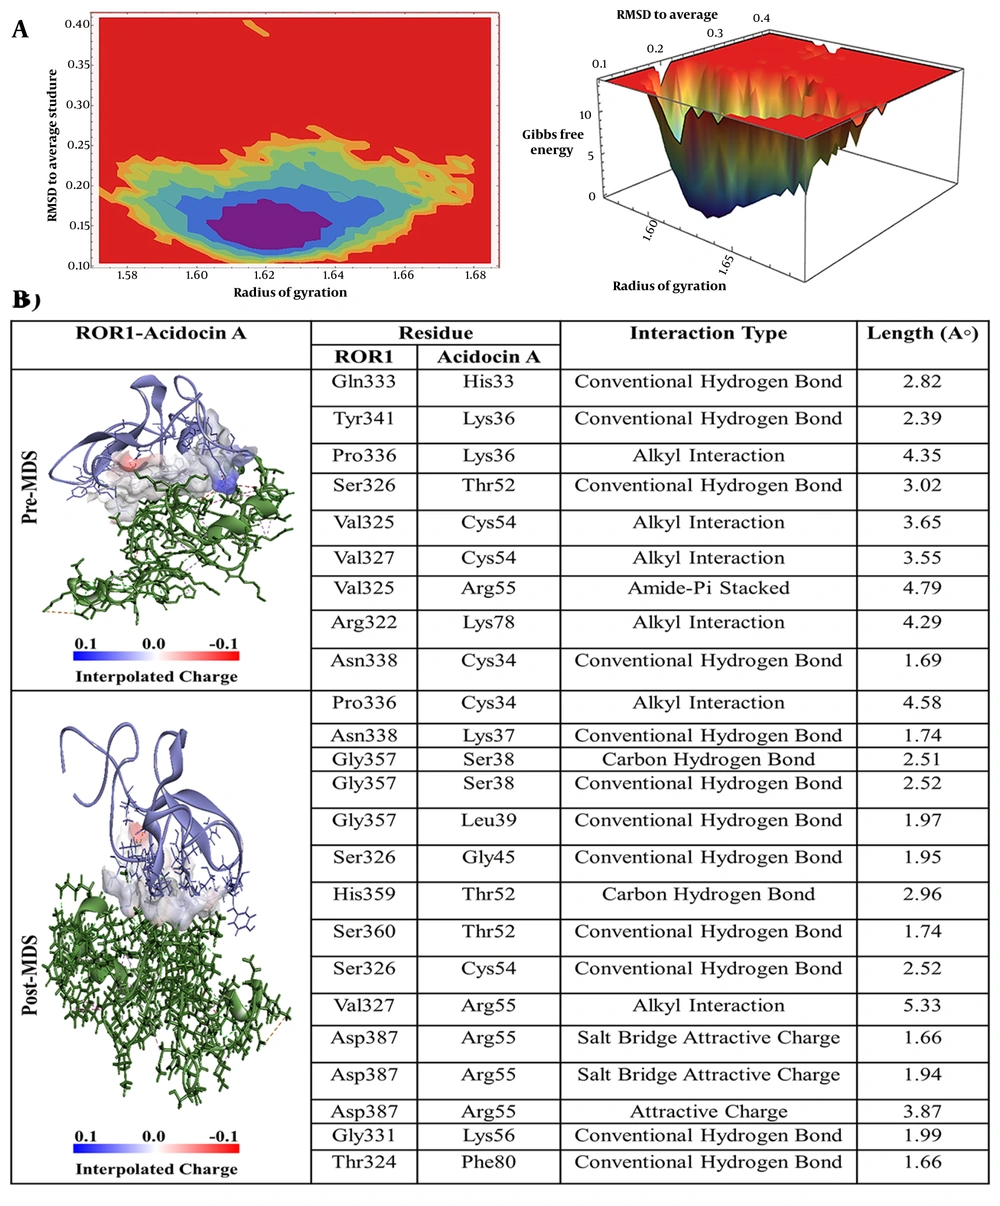
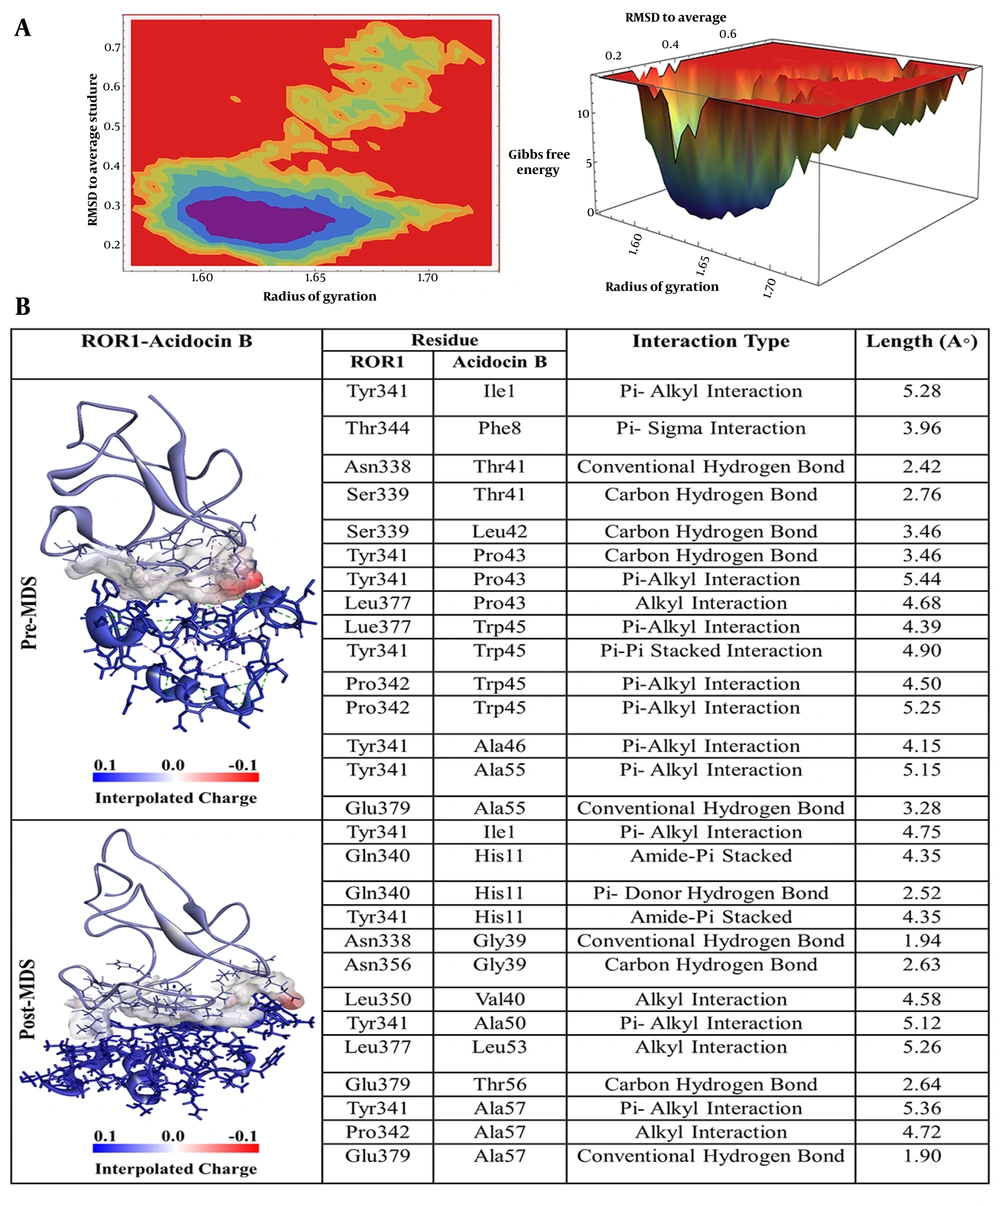
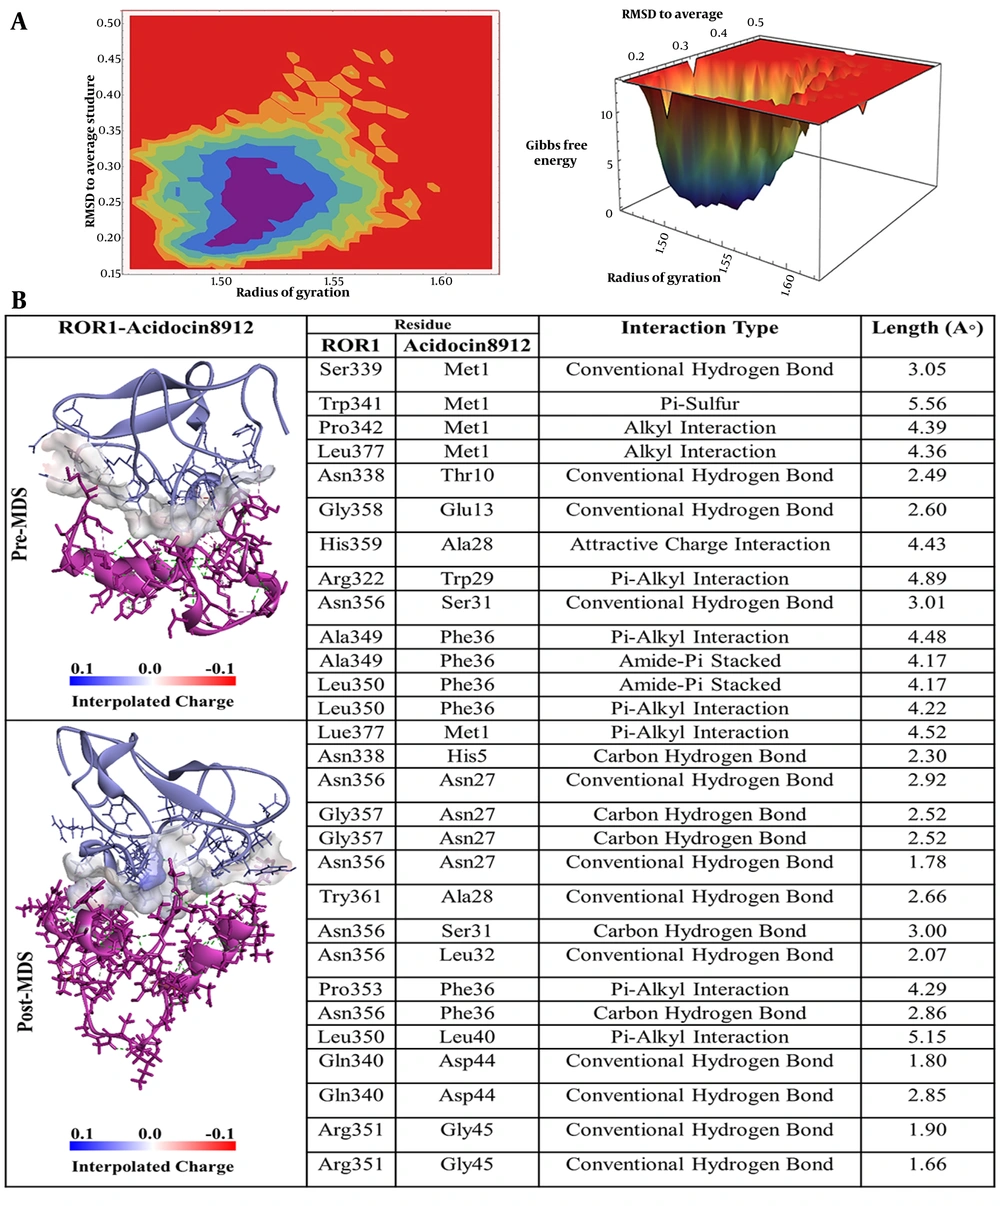
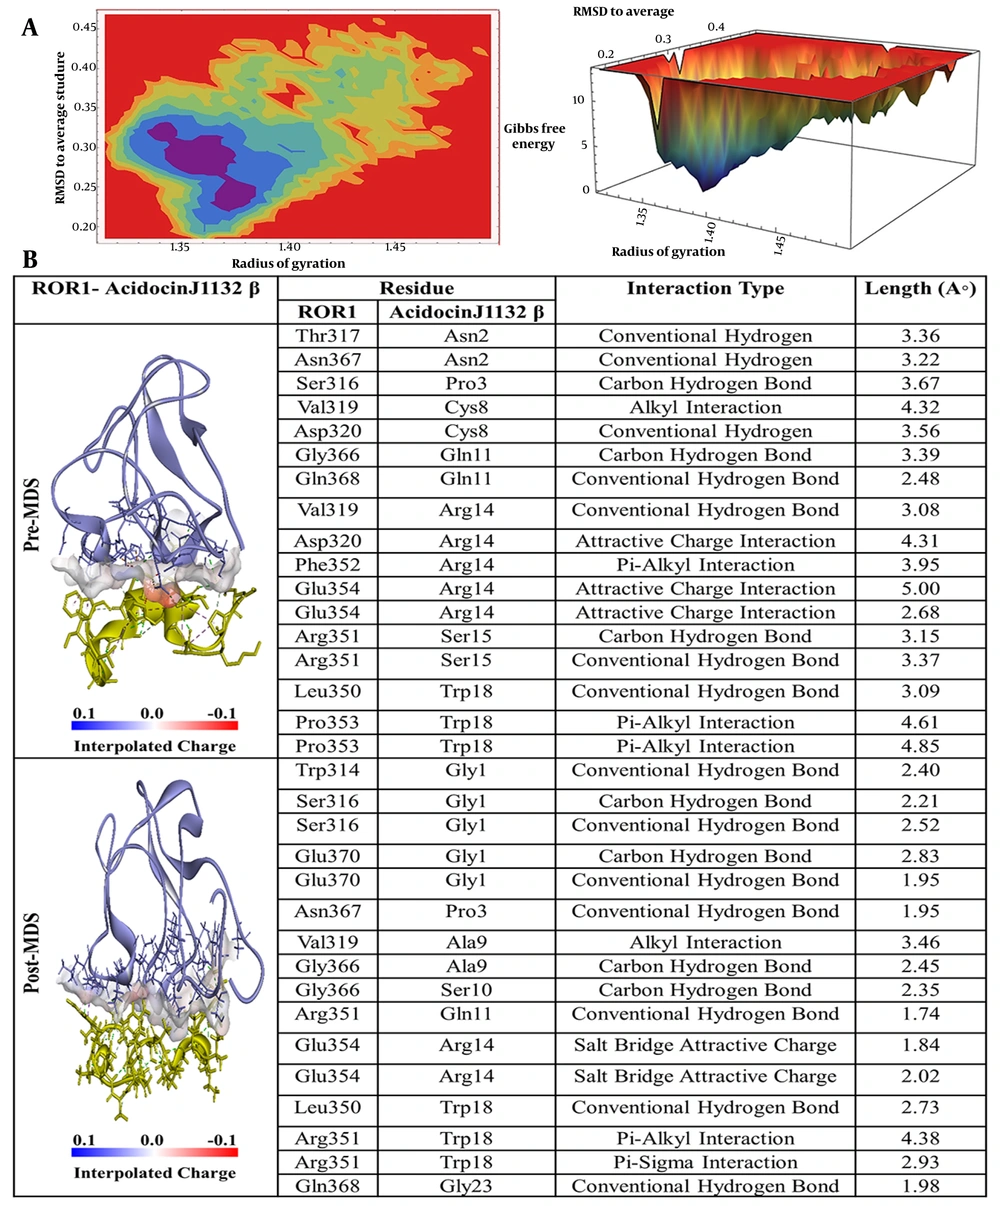
The free energy landscape (FEL) analysis pinpointed the most thermodynamically stable conformations of ROR-1 complexes when bound to acidocin J1132 β, acidocin 8912, acidocin A, and acidocin B during MD simulations (
33). These conformations were subsequently subjected to post-MD analysis (
Figure 2A,
Figure 3A,
Figure 4A, and
Figure 5A). Interaction analysis conducted post-MD revealed that acidocin J1132 β established up to 11 hydrogen bonds, indicating robust interactions characterized by consistent hydrogen bonding patterns (
Figure 5B). Acidocin 8912, as illustrated in
Figure 4B, formed 13 hydrogen bonds, a notable increase from the number observed prior to MD, suggesting enhanced stability following the simulation. While acidocin A exhibited a maximum of 11 hydrogen bonds post-MD (
Figure 2B), representing a significant rise from the 3 hydrogen bonds observed pre-MD, highlighting its strong binding affinity. In contrast, acidocin B formed only 4 hydrogen bonds after MD, a reduction compared to its pre-MD count, suggesting a lower degree of stable interactions (
Figure 3B).
To further substantiate these findings, we applied the formula G₂ - G₁ = Kb ln(qi/qmax), which quantitatively relates the depth of the energy well to conformational flexibility and inertia. According to this analysis, deeper wells correspond to more stable conformations, confirming that acidocin A forms the most stable complex with ROR-1, whereas acidocin B remains comparatively less stable.
Principal component analysis (PCA), a statistical methodology designed for the reduction of dimensionality in intricate datasets while preserving the principal sources of variance, was implemented in this investigation (
34). Specifically, PCA was applied to the MD simulation trajectories of ROR-1 complexes in association with acidocin J1132 β, acidocin 8912, acidocin A, and acidocin B. As depicted in Figure S2-B in Supplementary File, the conformational landscapes explored by these complexes were analyzed through projections onto the initial two principal components (PCs: PC1 and PC2). The acidocin J1132 β-ROR-1 complex exhibits a considerable dispersion across the conformational space, with discernible clusters representing energetically favorable states and more sparsely distributed points signifying transitional conformations. This observation suggests an equilibrium between structural stability and dynamic flexibility, indicative of moderate overall stability coupled with conformational adaptability. Analogously, the acidocin 8912-ROR-1 complex demonstrates substantial fluctuations along both PC1 and PC2. The presence of clusters suggests relatively stable conformational basins, while the interspersed points denote transitions between these states. This implies that acidocin 8912 maintains a stable interaction with ROR-1 while concurrently permitting requisite conformational plasticity.
The acidocin A-ROR-1 complex exhibits tightly clustered data points, indicating a highly stable interaction characterized by minimal conformational flexibility. This compact distribution suggests that acidocin A maintains a rigid binding mode with ROR-1, which supports its strong binding affinity and overall stability. Conversely, the acidocin B-ROR-1 complex displays a broader dispersion of data points, signifying greater flexibility and comparatively lower stability than the acidocin A complex. These scattered points reflect a more dynamic binding mechanism involving substantial conformational changes, implying a less stable interaction.
As depicted in Figure S2-A in Supplementary File, Porcupine plots are employed to visualize the direction and magnitude of the principal component motions identified through PCA. Within these plots, each arrow represents the directional movement of a specific residue within the protein, with the length of the arrow proportional to the extent of that movement. This visual representation facilitates the understanding of protein regions undergoing significant conformational alterations during the simulation.
The acidocin J1132 β-ROR1 complex displays considerable mobility across various structural domains, as evidenced by multiple long vectors oriented in diverse directions, indicative of substantial conformational transitions. Notably, four extended projections are observed at the terminal regions, exhibiting a directional bias opposite to the main protein body. Furthermore, the protein core features moderate projections that also demonstrate opposing directional dynamics relative to the termini. Together, these observations suggest that acidocin J1132 β induces significant dynamic conformational changes, oscillating between states of stability and flexibility, thereby conferring notable conformational adaptability to the complex.
The acidocin 8912-ROR-1 complex exhibits notable dynamic behavior, as evidenced by four extended vectors at its distal ends, signifying substantial mobility in these regions. The spatial arrangement of these vectors contrasts with that observed in J1132. Conversely, the protein's central domain displays minimal vector representation, implying a structurally stable core juxtaposed with highly flexible terminal segments. This configuration, characterized by a rigid central region and mobile termini, suggests that acidocin 8912 can sustain stable interactions with ROR-1 while simultaneously accommodating essential conformational plasticity within its peripheral domains.
The acidocin A-ROR-1 complex exhibits limited conformational flexibility, as indicated by several moderate-intensity peaks at the protein's termini and a scarcity of vectors within its main structure. This suggests that the interaction between acidocin A and ROR-1 results in a highly stable complex, leading to rigidification of the protein conformation. The observed lack of significant internal motion within the protein underscores the strong and stable binding affinity of acidocin A for ROR-1, thereby supporting its potential as a promising therapeutic agent.