


1. Background
2. Objectives
3. Methods
3.1. Cell Culture
3.2. MTT Cell Viability Assay
3.3. Apoptosis and Necrosis Detection (Flow Cytometry)
3.4. Cell Cycle Analysis
3.5. Wound Healing (Scratch) Assay
3.6. Statistical Analysis
4. Results
4.1. The Impact of Single and Combined Drug Concentrations on Cell Proliferation
| Sample | IC50 (µg/mL) b |
|---|---|
| Ep on B-CPAP | 7.21 ± 0.558 |
| Et on B-CPAP | 77.51 ± 0.798 |
| RA on B-CPAP | 3.01 ± 0.838 |
| VA on B-CPAP | 407.29 ± 0.522 |
| Ep on SW | 92.9 ± 0.704 |
| Et on SW | 43.62 ± 0.801 |
| RA on SW | 1.83 ± 0.744 |
| VA on SW | 584.32 ± 0.931 |
| Ep on Hu02 | 914.96 ± 0.998 |
| Et on Hu02 | 408.31 ± 1.002 |
| RA on Hu02 | ~941.32 ± 0.98 |
| VA on Hu02 | 1833.11 ± 0.65 |
Abbreviations: Ep, epirubicin; Et, etoposide; RA, retinoic acid; VA, valproic acid.
a Values are expressed as mean ± standard error of the mean (SEM).
b The IC50 values were determined using Graph Pad Prism 5.0 program with a 95% confidence interval.
4.2. The Impact of Single and Combined Drug Concentrations on the Induction of Apoptosis and Necrosis
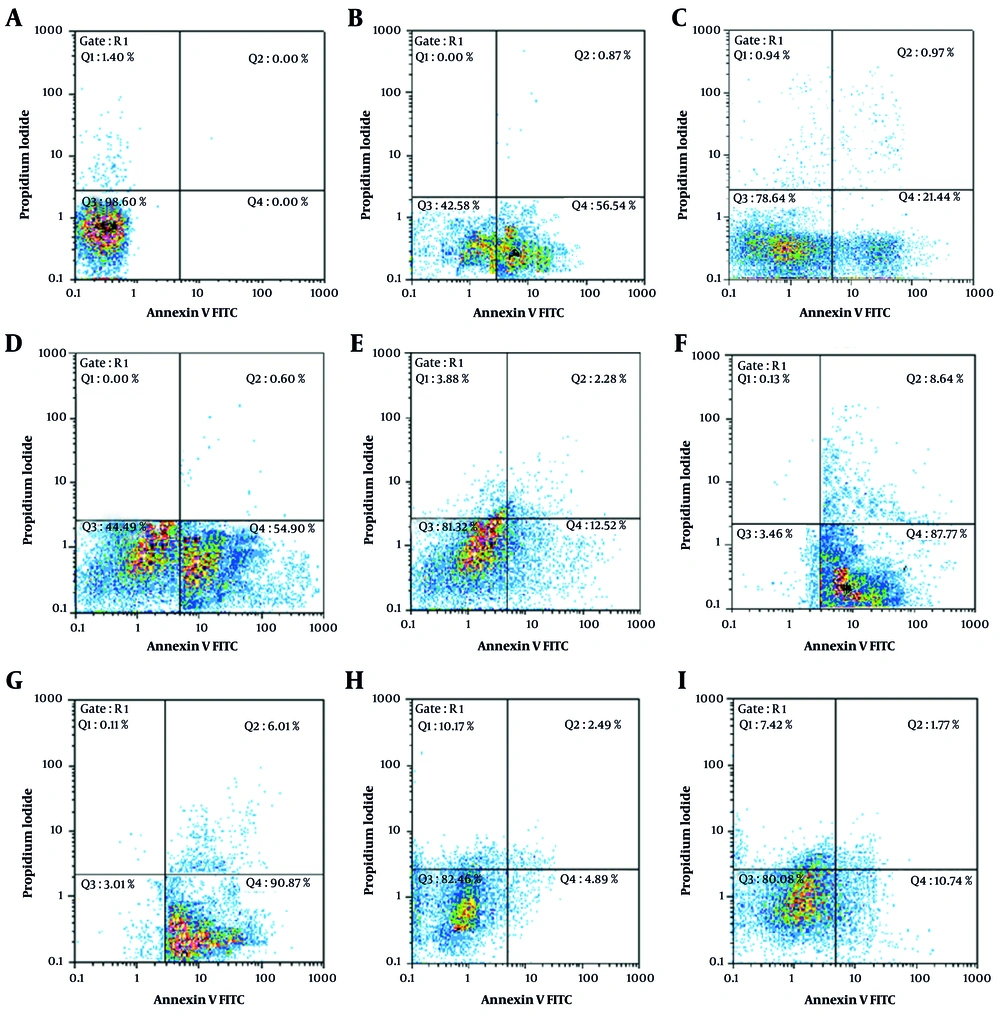
Annexin V-FITC vs. propidium iodide (PI) quantitation of B-CPAP cells in control and test groups including: A, non-treated (RPMI as negative control); B, epirubicin (Ep; IC50 dose); C, Ep (1/5 IC50 dose); D, etoposide (Et; IC50 dose); E, Et (1/5 IC50 dose); F, retinoic acid (RA; IC50 dose) in combination with Ep (1/5 IC50 dose); G, RA (IC50 dose) in combination with Et (1/5 IC50 dose); H, valproic acid (VA; IC50 dose) in combination with Ep (1/5 IC50 dose); and I, VA (IC50 dose) in combination with Et (1/5 IC50 dose).
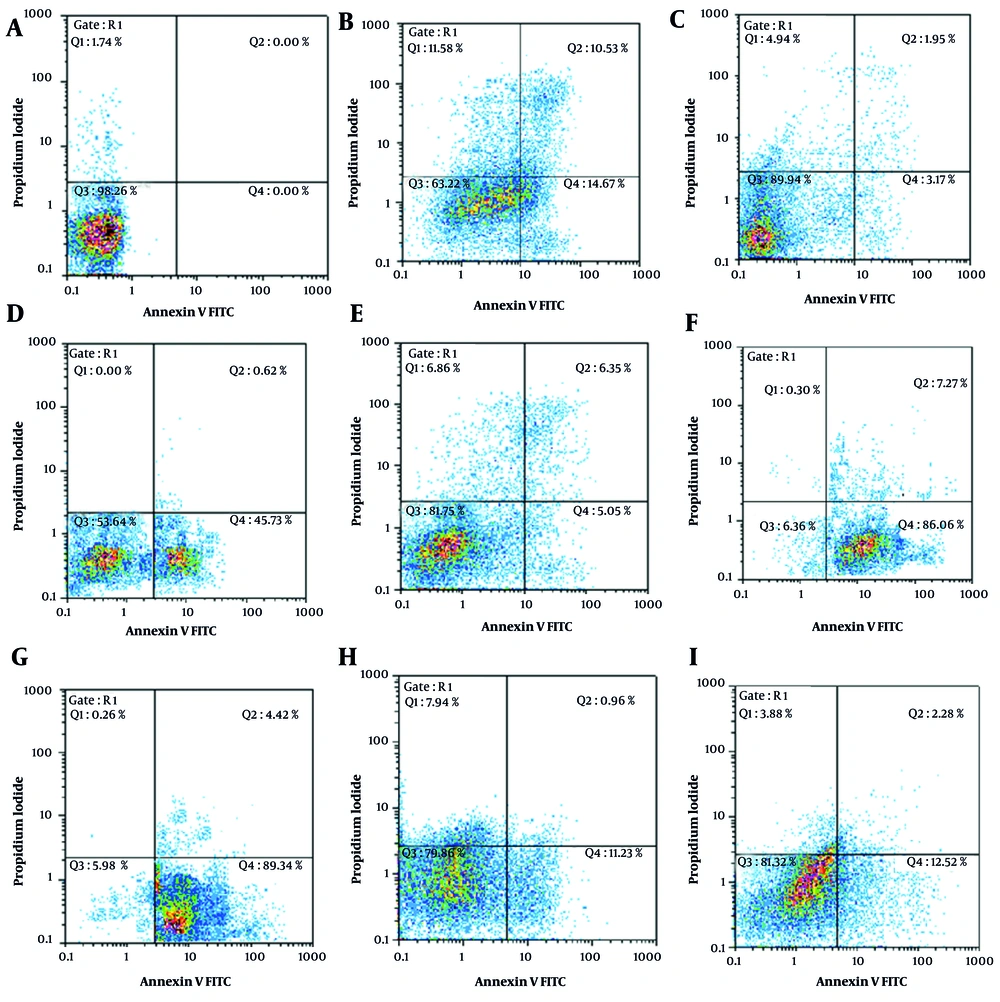
Annexin V-FITC vs. propidium iodide (PI) quantitation of SW cells in control and test groups including: A, non-treated (RPMI as negative control); B, epirubicin (Ep; IC50 dose); C, Ep (1/5 IC50 dose); D, etoposide (Et; IC50 dose); E, Et (1/5 IC50 dose); F, retinoic acid (RA; IC50 dose) in combination with Ep (1/5 IC50 dose); G, RA (IC50 dose) in combination with Et (1/5 IC50 dose); H, valproic acid (VA; IC50 dose) in combination with Ep (1/5 IC50 dose); and I, VA (IC50 dose) in combination with Et (1/5 IC50 dose).
4.3. The Impact of Individual and Combined Drug Concentrations on the TC Cell Cycle
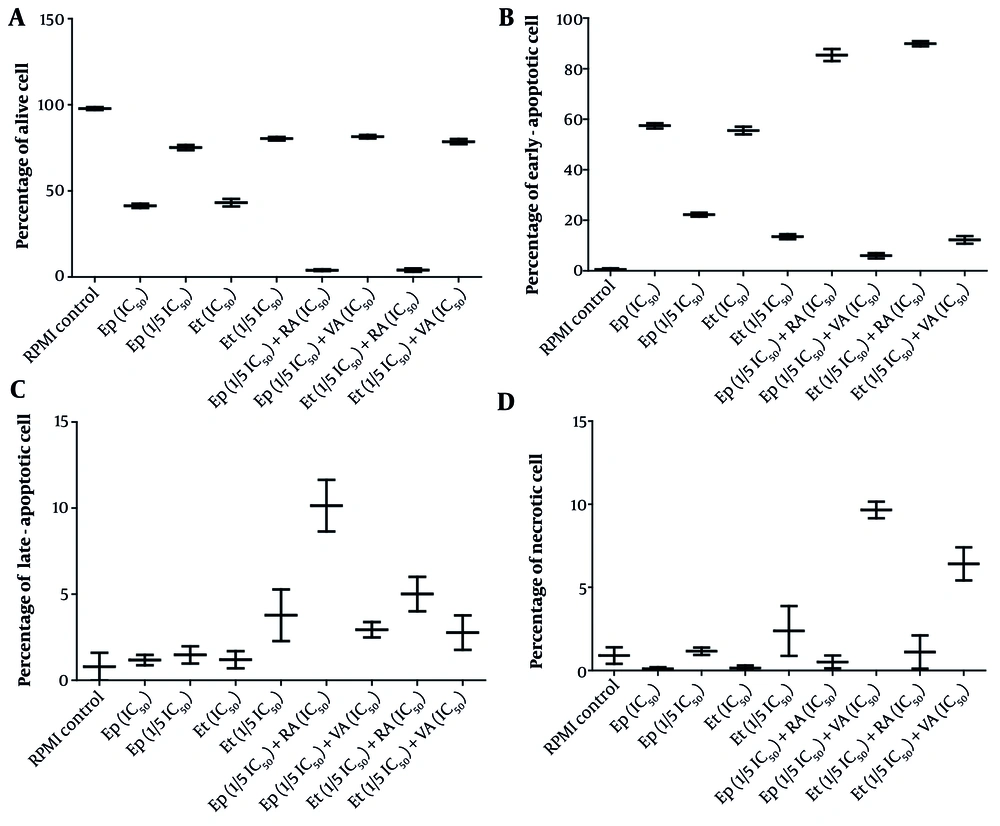
The cytotoxic effects of epirubicin (Ep) and etoposide (Et) were compared in single doses, as well as in combination with retinoic acid (RA) and valproic acid (VA) on percentage of A, alive; B, early-apoptotic; C, late-apoptotic; and D, necrotic cell in B-CPAP cells after 48 hours of incubation.
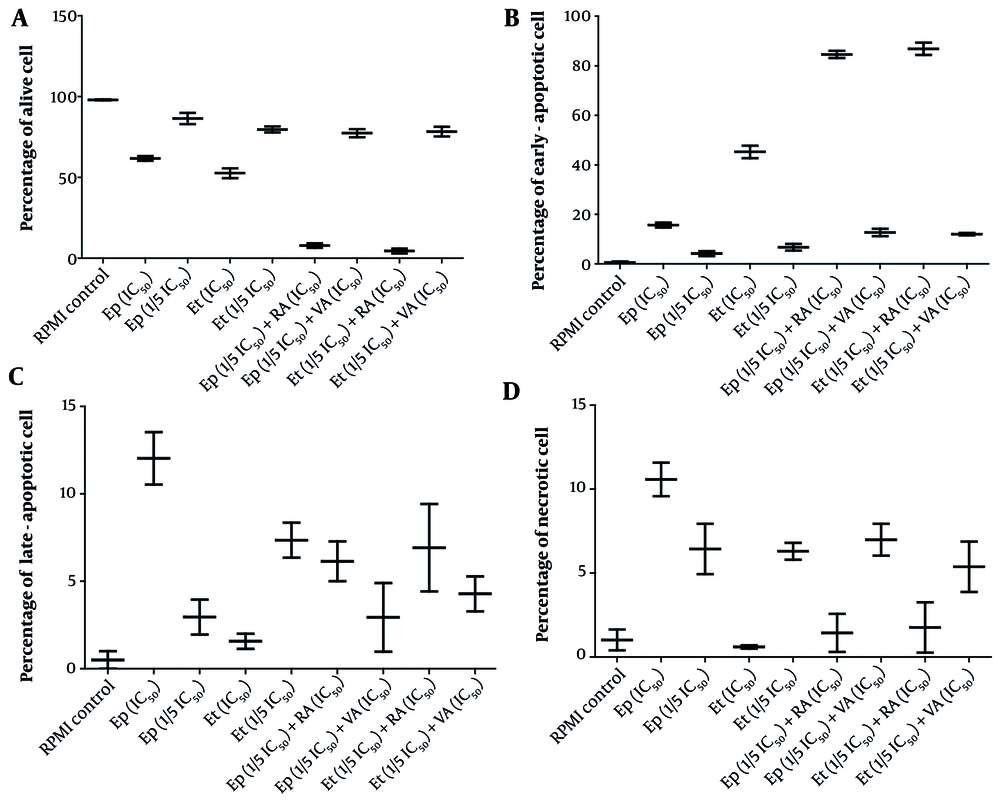
The cytotoxic effects of epirubicin (Ep) and etoposide (Et) were compared in single doses, as well as in combination with retinoic acid (RA) and valproic acid (VA), on percentage of A, alive; B, early-apoptotic; C, late-apoptotic; and D, necrotic cell in B-SW cells after 48 hours of incubation.
![The impact of epirubicin (Ep) and etoposide (Et) at different concentrations (IC<sub>50</sub> and 1/5 IC<sub>50</sub> doses), both alone and in combination with retinoic acid (RA) and valproic acid (VA), on the distribution of cell cycle in the A, B-CPAP and B, SW cell lines was assessed after a 48-hour incubation period [the data is expressed as the mean ± standard deviation; significant differences (* P < 0.05) were observed compared to the control group treated with RPMI].](https://brieflands.com/journals/ijpr/articles/163580/figures/ijpr-24-1-163580-i005-preview.webp "The impact of epirubicin (Ep) and etoposide (Et) at different concentrations (IC<sub>50</sub> and 1/5 IC<sub>50</sub> doses), both alone and in combination with retinoic acid (RA) and valproic acid (VA), on the distribution of cell cycle in the A, B-CPAP and B, SW cell lines was assessed after a 48-hour incubation period [the data is expressed as the mean ± standard deviation; significant differences (* P < 0.05) were observed compared to the control group treated with RPMI].")
The impact of epirubicin (Ep) and etoposide (Et) at different concentrations (IC50 and 1/5 IC50 doses), both alone and in combination with retinoic acid (RA) and valproic acid (VA), on the distribution of cell cycle in the A, B-CPAP and B, SW cell lines was assessed after a 48-hour incubation period [the data is expressed as the mean ± standard deviation; significant differences (* P < 0.05) were observed compared to the control group treated with RPMI].
4.4. The Impact of Individual and Combined Drug Concentrations on Cancer Cell Migration
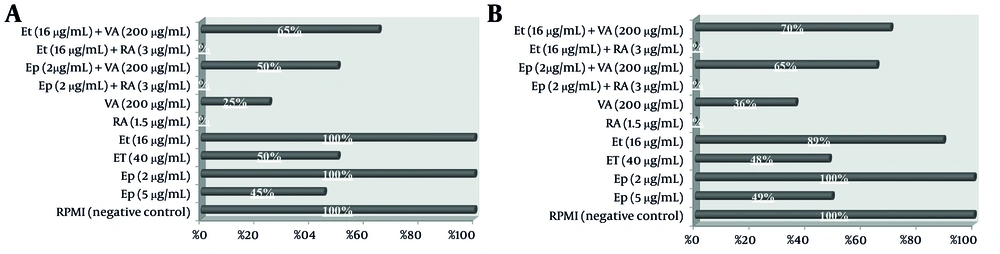
The migration percentage of A, B-CPAP and B, SW cells was determined using a scratch wound healing assay after treatment with epirubicin (Ep), etoposide (Et), retinoic acid (RA), and valproic acid (VA) individually and in combination.





