


1. Background
2. Objective
3. Methods
3.1. Animals Used
3.2. Induction of Alzheimer Disease in Mice
3.3. Experimental Design
3.4. Assessment of Amyloid β1-42 Oligomer-Induced Spatial Cognitive Changes in Morris Water Maze Test
| Days | Order of Animal Placement in Quadrants | Assessments | |||
|---|---|---|---|---|---|
| Day 17 | Q1 | Q2 | Q3 | Q4 | ELT |
| Day 18 | Q2 | Q3 | Q4 | Q1 | |
| Day 19 | Q3 | Q4 | Q1 | Q2 | |
| Day 20 | Q4 | Q1 | Q2 | Q3 | |
| Day 21 | The animal was placed at the center of the MWM device. | TSTQ | |||
Abbreviations: ELT, escape latency time; Q, quadrant; TSTQ, time spent in the target quadrant.
a The animal was allowed a ten-minute break between each quadrant trial during the ET trial test.
3.5. Assessment of Amyloid β1-42 Oligomer-Induced Cognitive Changes in Water Y-Maze Alternation Test
3.6. Assessment of Amyloid β1-42 Oligomer-Induced Cognitive Changes in Novel Object Recognition Test
3.7. Estimations of Amyloid β1-42 Oligomer-Induced Tissue Markers Changes
3.7.1. Estimation of Amyloid β1-42 Oligomer-Induced Changes of Acetylcholinesterase Activity
3.7.2. Estimation of Amyloid β1-42 Oligomer-Induced Changes of Thiobarbituric Acid Reactive Substances
3.7.3. Estimation of Amyloid β1-42 Oligomer-Induced Changes of Reduced Glutathione
3.7.4. Estimation of Amyloid β1-42 Oligomer-Induced Changes of Potassium-Chloride Co-Transporter 2 Expression
3.7.5. Estimation of Amyloid β1-42 Oligomer-Induced Changes of Tissue Total Proteins
3.8. Evaluation of Amyloid β1-42 Oligomer-Induced Histopathological Changes
3.9. Statistical Analysis
4. Results
4.1. Effect of Daphnetin on Amyloid β1-42 Oligomer-Induced Changes in Morris Water Maze Test Response
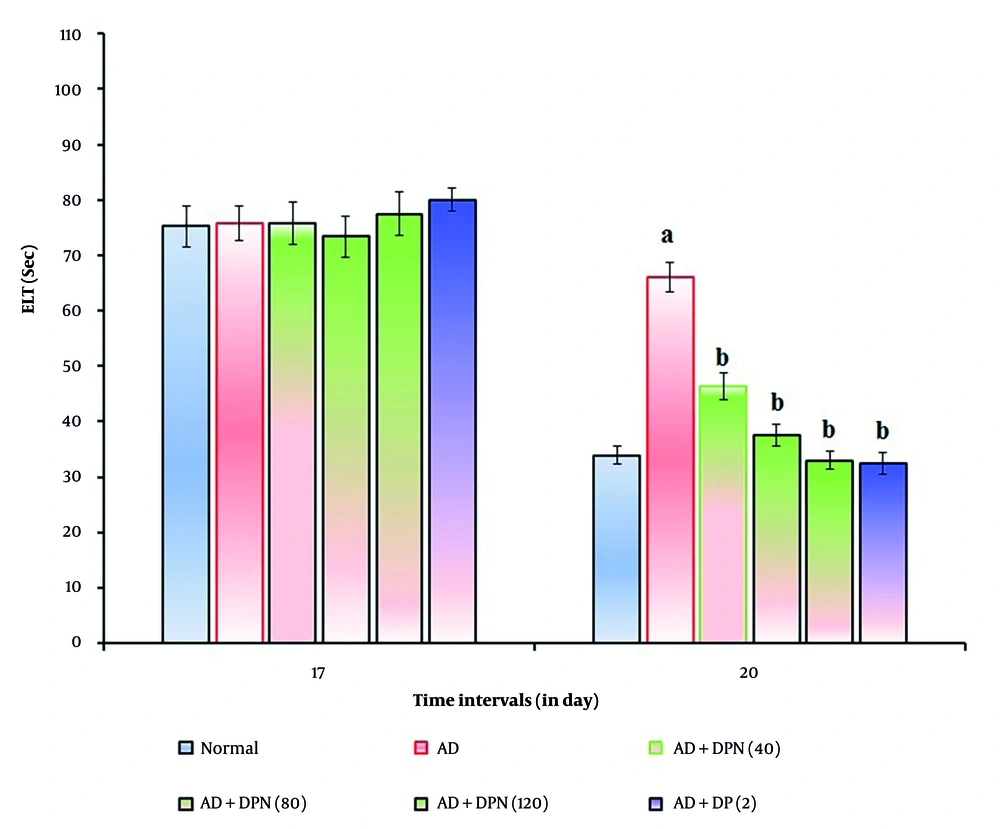
Effect of DPN on Aβ-induced changes of ELT values in the MWM test. Digits in parentheses indicate the dose in mg/kg. Data are expressed as the mean ± SD, n = 8 mice per group. a, P < 0.05 versus the normal group; b, P < 0.05 versus the AD group. Abbreviations: AD, Alzheimer's disease; DP, donepezil; DPN, daphnetin; ELT, escape latency time; and Sec, seconds.
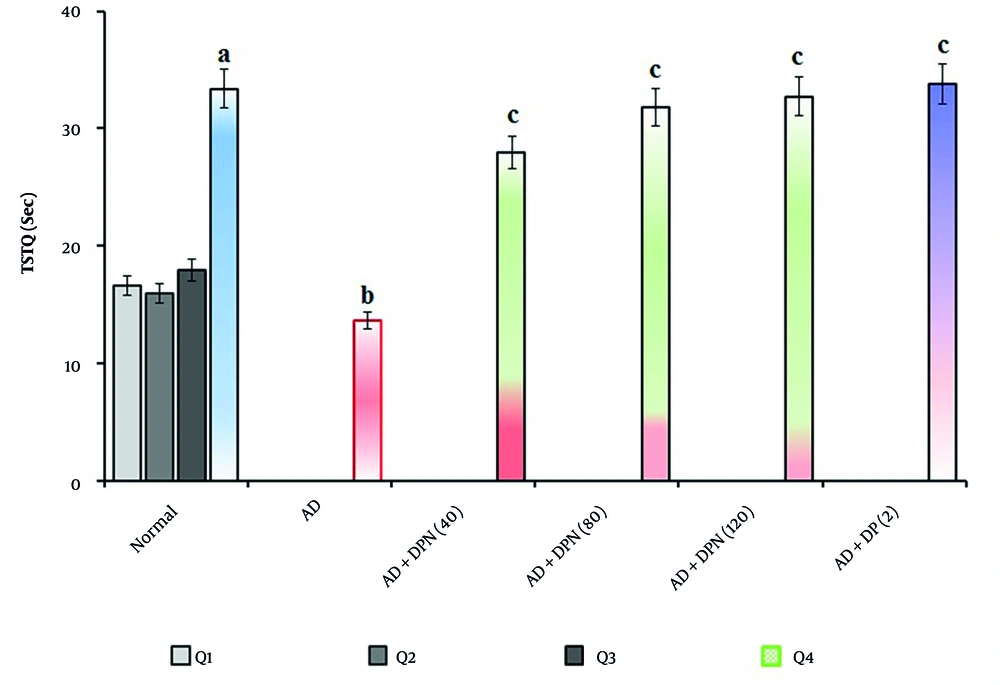
Effect of DPN on Aβ-induced changes of TSTQ values in the MWM test. Digits in parentheses indicate the dose in mg/kg. Data are expressed as the mean ± SD, n = 8 mice per group. a, P < 0.05 versus the Q1 of normal group; b, P < 0.05 versus the Q4 of normal group. c, P < 0.05 versus the Q4 of AD group. Abbreviations: AD, Alzheimer's disease; DP, donepezil; DPN, daphnetin; Sec, seconds; TSTQ, time spent in the target quadrant.
4.2. Effect of Daphnetin in Amyloid β1-42 Oligomer-Induced Changes of Water Y-Maze Alternation Test Response
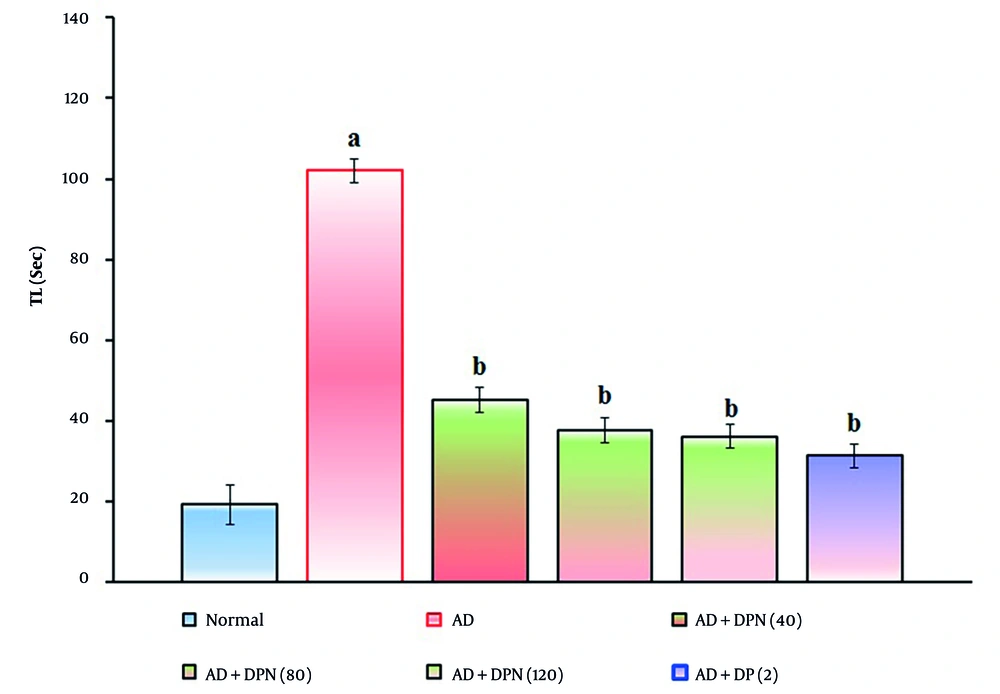
Effect of DPN on Aβ-induced changes of short-term memory functions. The numbers in parentheses represent a dose of mg/kg. The results are presented as the mean SD, with n = 8 mice per group. a, P < 0.05 versus the normal group; b, P < 0.05 versus the AD group. Abbreviations: AD, Alzheimer's disease; DP, donepezil; DPN, daphnetin; Sec, seconds; and TL, transfer latency.
4.3. Effect of Daphnetin in Amyloid β1-42 Oligomer-Induced Changes of Novel Object Recognition Test Response
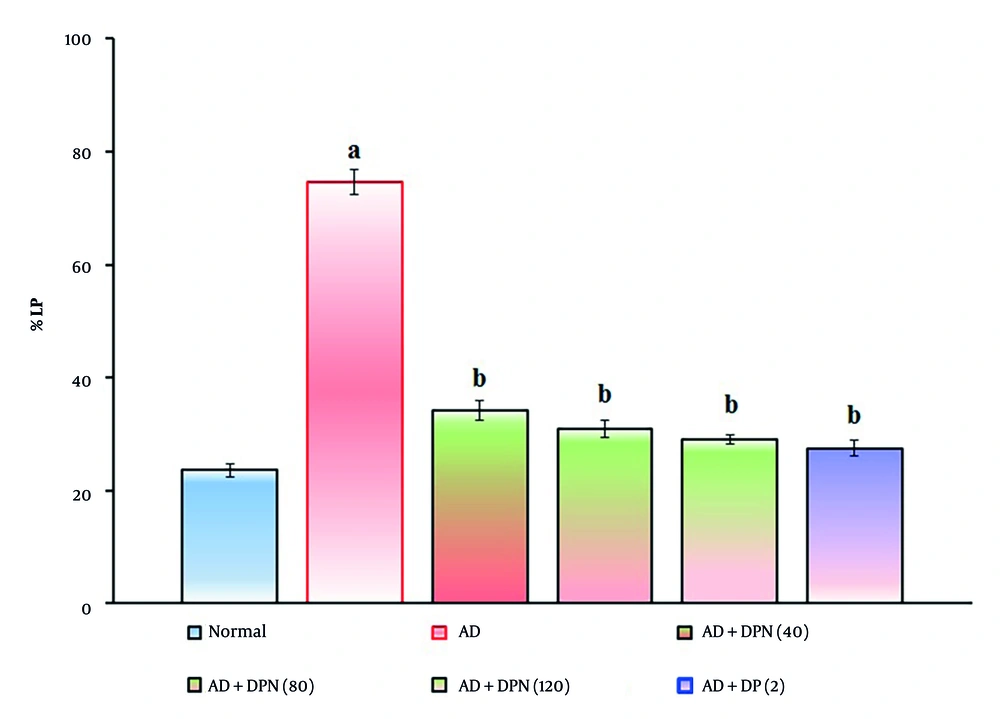
Effect of DPN on Aβ-induced changes of non-spatial learning functions. The numbers in parentheses represent a dose of mg/kg. The results are presented as the mean SD, with n = 8 mice per group. a, P < 0.05 versus the normal group; b, P < 0.05 versus the AD group. Abbreviations: AD, Alzheimer's disease; DP, donepezil; DPN, daphnetin; and %LP, percentage location preference.
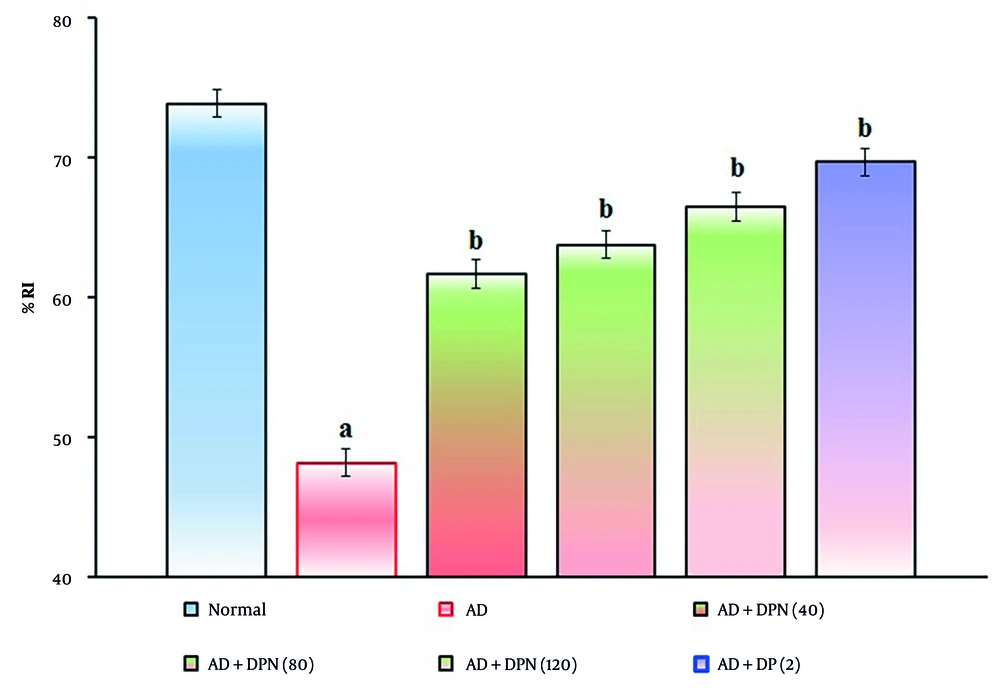
Effect of DPN on Aβ-induced changes of non-spatial learning functions. The numbers in parentheses represent a dose of mg/kg. The results are presented as the mean SD, with n = 8 mice per group. a, P < 0.05 versus the normal group; b, P < 0.05 versus the AD group. Abbreviations: AD, Alzheimer's disease; DP, donepezil; DPN, daphnetin; and %RI, percentage recognition index.
4.4. Effect of Daphnetin on Amyloid β1-42 Oligomer-Induced Tissue Biomarker Changes
| Groups | AChE (μmol/mg Protein) | TBARS (nmol/mg Protein) | GSH (µmol/mg Protein) | KCC2 (ng/mg Protein) |
|---|---|---|---|---|
| Normal | 19.7 ± 1.2 | 1.16 ± 0.07 | 8.61 ± 0.08 | 11.36 ± 0.12 |
| AD | 51.3 ± 0.9 b | 5.21 ± 0.12 b | 1.04 ± 0.14 b | 2.97 ± 0.09 b |
| AD+DPN (n = 40) (mg/kg) | 32.6 ± 1.1 c | 2.54 ± 0.17 c | 4.62 ± 0.16 c | 7.73 ± 0.14 c |
| AD+DPN (n = 80) (mg/kg) | 26.2 ± 1.4 c | 2.17 ± 0.09 c | 5.39 ± 0.08 c | 8.16 ± 0.05 c |
| AD+DPN (n = 120) (mg/kg) | 23.1 ± 0.6 c | 1.73 ± 0.06 c | 6.94 ± 0.14 c | 9.83 ± 0.08 c |
| AD+DP (n = 2) (mg/kg) | 20.3 ± 1.3 c | 1.52 ± 0.13 c | 7.69 ± 0.12 c | 10.19 ± 0.11 c |
Abbreviations: AChE, acetylcholinesterase; AD, Alzheimer’s disease; DP, donepezil; DPN, daphnetin; TBARS, thiobarbituric acid reactive substances; GSH, reduced glutathione; KCC2 , K⁺-Cl⁻ co-transporter 2.
a Values are expressed as mean ± SD.
b P < 0.05 versus normal group.
c P < 0.05 versus AD group.
4.5. Effect of Daphnetin in Amyloid β1-42 Oligomer-Induced Histopathological Changes
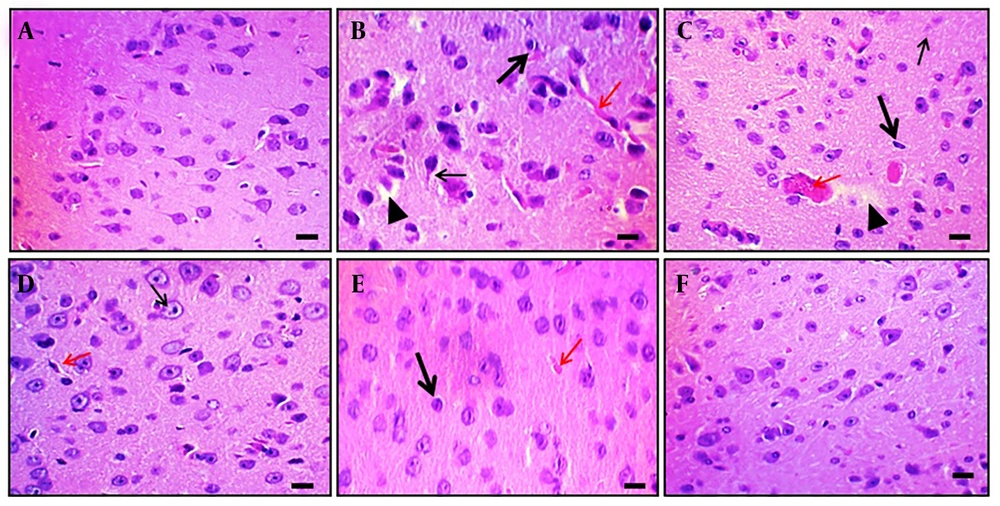
Effect of DPN on Aβ-induced histopathological changes of brain tissue in mice. Two mice were utilized in each group to evaluate the histological alterations in the brain tissue. Hematoxylin and eosin staining techniques were applied to tissue sections.A-F, histological changes of hippocampal tissue of naïve control, Aβ (4 μg; i.c.v.), DPN (40 mg/kg; for 21 days), DPN (80 mg/kg; for 21 days), DPN (120 mg/kg; for 21 days), and DP (2 mg/kg: p.o.; for 21 days) administered groups respectively. A, normal neuronal tissue structure. B, the Aβ-associated neuronal damage i.e., loss of neurons and neurofibrillary degeneration (thin arrow), nuclear pyknosis (thick arrow), vascular edema (red arrow), and vacuolation (arrowhead). C-E, the ameliorative action of DPN in a dosedependent manner against the Aβ neurotoxin. The possible neuroprotective effects of DP are depicted in F as being comparable to those of normal tissue. Microscopic analyses were conducted with a scale bar of 35 μm and a 400× magnification.



