


1. Background
2. Objectives
3. Methods
3.1. Plant Material Collection
3.2. Preparation of Plant Extracts
3.3. Preliminary Phytochemical Analysis
| Phytochemical Class Test | Procedure | Positive Result |
|---|---|---|
| Carbohydrates and glycosides | ||
| Molisch's test | A small quantity of the extract was dissolved in 4 mL of distilled water, followed by filtration. The filtrate was treated with 2 - 3 drops of 1% alcoholic α-naphthol and 2 mL of concentrated sulfuric acid. | The formation of a brown ring at the junction of the two liquids |
| Proteins and free amino acids | ||
| Million's test | The extract was dissolved in water, followed by the addition of Million's reagent. | The appearance of a red color |
| Tannins and phenolic compounds | ||
| Ferric chloride test | 2 mL of the extract was treated with 1 mL of 5% ferric chloride solution. | A blue or green coloration |
| Phytosterols | ||
| Salkowski's test | 5 mL of chloroform was added to the extract, followed by a few drops of concentrated sulfuric acid. | The appearance of a brown color |
| Libermann-Burchard's test | The extract was dissolved in chloroform, treated with concentrated sulfuric acid and acetic anhydride. | The appearance of a bluish-green color |
| Alkaloids | ||
| Wagner's | The extract was treated with dilute hydrochloric acid and Wagner's reagent. | The formation of a reddish-brown precipitate |
| Hager's reagents | The extract was treated with dilute hydrochloric acid and Hager's reagent. | Yellow precipitate |
| Flavonoids | ||
| Shinoda's test | The extract was dissolved in alcohol, and a small amount of magnesium and concentrated hydrochloric acid was added. | Magenta color |
3.4. Experimental Animals
3.5. Induction of Diabetes
3.6. Experimental Design
3.7. Blood Glucose Measurement
3.8. Body Weight Monitoring
3.9. Statistical Analysis
4. Results
4.1. Extraction and Qualitative Phytochemical Analysis of Leuenbergeria bleo Leaves
| Constituent of Detection and Type of Tests | Results a | ||
|---|---|---|---|
| Petroleum Ether | Chloroform | Methanol | |
| Carbohydrate | |||
| Molisch test | - | - | - |
| Proteins and free amino acids | |||
| Millon’s test | - | - | - |
| Steroids and triterpenoids | |||
| Libermann Burchard test | + | ++ | +++ b |
| Salkowski test | + | ++ | +++ |
| Alkaloids | |||
| Wagner’s reagent | - | + | ++ |
| Hager’s reagent | - | + | ++ |
| Tannin and Phenolic compound | |||
| 5% Ferric Chloride solution test | + | + | ++ |
| Flavonoid | |||
| Shinoda test | + | ++ | +++ |
a (+) indicates the presence of secondary metabolites and (-) indicates the absence of secondary metabolites.
b Stronger positive results.
4.2. Baseline Blood Glucose Levels in Normal Albino Rats
4.3. Blood Glucose Levels Following Alloxan-Induced Diabetes
a Values are expressed as mean ± SD.
b N = 6 for control group and 24 for diabetic group.
c Not significantly different (P > 0.5) compared with normal group before Alloxan monohydrate.
d Significantly different (P < 0.5) compared with normal control group before Alloxan monohydrate.
4.4. Effects of Leuenbergeria bleo Extracts on Body Weight in Diabetic Rats
| Experimental Groups | Body Weight | ||
|---|---|---|---|
| Day 1 | Day 3 | Day 5 | |
| Normal control | 194.50 ± 4.77 | 193.50 ± 5.21 | 193.50 ± 4.94 |
| Diabetic control | 205.83 ± 4.05 b, c | 155.67 ± 1.84 d, e | 150.83 ± 1.60 d, e |
| Standard reference (100 mg/kg/d) | 202.67 ± 3.34 b, f | 188.33 ± 3.69 b, g | 190.17 ± 3.65 b, g |
| Chloroform extract (500 mg/kg/d) | 200.33 ± 4.08 b, f, c | 182.00 ± 6.18 b, g, c | 184.17 ± 6.31 b, g, c |
| Methanol extract (500 mg/kg/d) | 204.83 ± 4.87 b, f, c | 185.50 ± 4.40 b, g, c | 190.83 ± 5.13 b, g, c |
a Values are expressed as mean ± SD.
b Not significantly different compared to the normal group (P > 0.05).
c Not significantly different compared to the standard group (P > 0.05).
d Significantly different compared to the normal group (P < 0.05).
e Significantly different compared to the standard group (P < 0.05).
f Not significantly different compared to the diabetic group (P > 0.05).
g Significantly different compared to the diabetic group (P < 0.05).
4.5. Antihyperglycemic Effects of Leuenbergeria bleo Extracts in Diabetic Rats
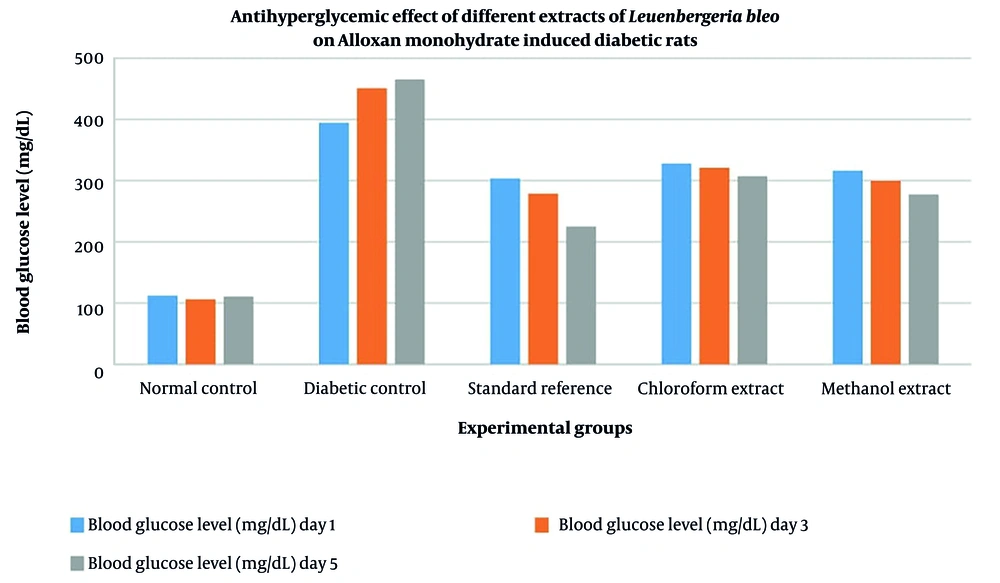
Antihyperglycemic effect of different extracts of Leuenbergeria bleo leaves on alloxan monohydrate-induced diabetic rats





