


1. Background
2. Objectives
3. Patients and Methods
3.1. Study Population
3.2. Conventional US and CEUS Examinations
3.3. Analysis of Conventional US and CEUS Images
3.4. Quantitative CEUS Analysis
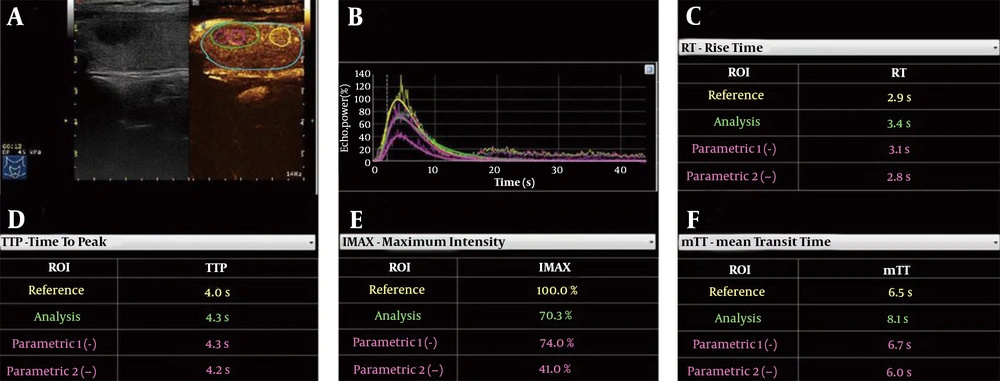
Quantitative contrast-enhanced ultrasonography (CEUS) analysis of an aSAT nodule in a 54-year-old woman. A, Schematic representation of regions of interest (ROIs), including the whole ROI (green rim), peripheral ROI (magenta dotted rim), central ROI (magenta solid rim), and control ROI (yellow rim). B, Time-intensity curves of four ROIs. C, RT of four ROIs. D, TTP of four ROIs. E, IMAX of four ROIs. F, mTT of four ROIs (aSAT, asymptomatic subacute thyroiditis; RT, rise time; TTP, time to peak; IMAX, maximum intensity; mTT, mean transit time).
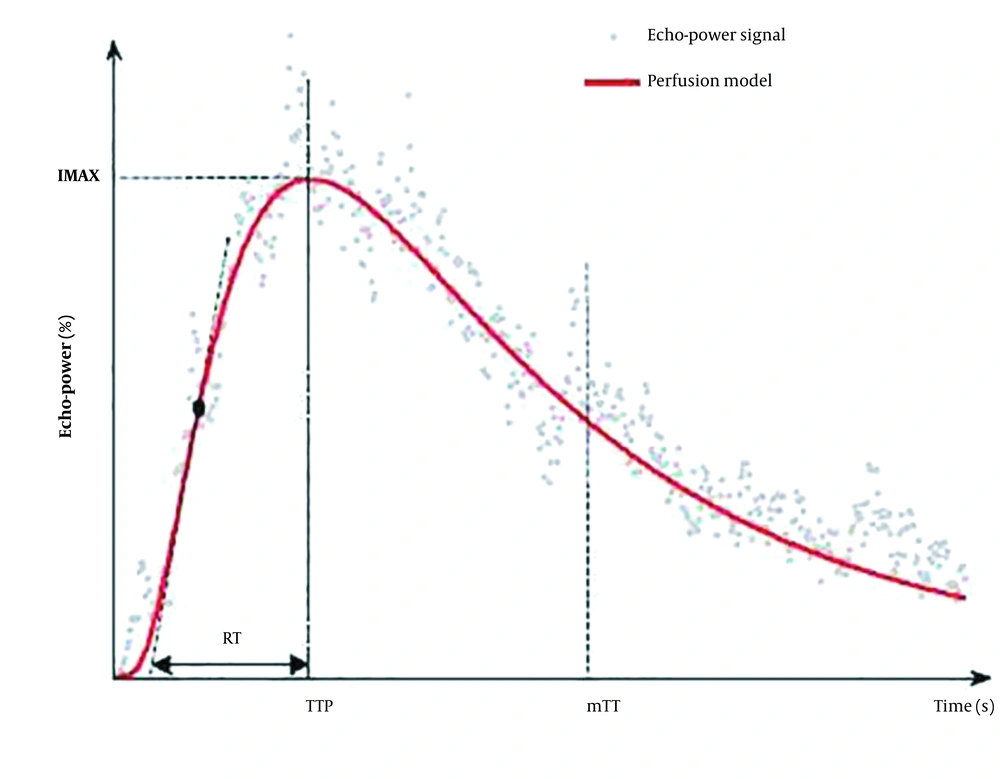
The model and perfusion parameters in the operating manual of SonoLiver version 1.1 (TomTec Imaging Systems, Munich, Germany). The model consists of fitting echo-power signals with a perfusion model function representing the bolus kinetics (RT, rise time; TTP, time to peak; IMAX, maximum intensity; mTT, mean transit time).
3.5. Histological Confirmation
3.6. Statistical Analysis
4. Results
4.1. Patients’ Characteristics
| Variables | aSAT | PTC | P-value c | t/ χ2/F |
|---|---|---|---|---|
| Age | 47.43 ± 8.51 | 47.26 ± 10.42 | 0.95 | 2.02 |
| Maximum diameter | 15.93 ± 9.09 | 14.3 ± 7.08 | 0.71 | 0.48 |
| Gender (M/F) | 8/22 | 9/14 | 0.335 | χ2 = 0.928 |
| TI-RADS | 0.3356 | F = 1.581 | ||
| 4a | 11 | 5 | ||
| 4b | 15 | 14 | ||
| 5 | 4 | 4 |
Abbreviations: aSAT, asymptomatic subacute thyroiditis; PTC, papillary thyroid carcinoma; TI-RADS, thyroid imaging reporting & data System.
aData are presented as mean ± standard deviation unless otherwise stated.
bThe age and gender are not significantly different between the two groups.
cP-value is obtained by a two-tailed independent-samples t-test; χ2 is obtained by a two-tailed Chi-square test; and F-value is obtained by a two-way ANOVA.
4.2. Comparison of Conventional US and CEUS Images
| Characteristics | aSAT | PTC | P-value | χ2 a |
|---|---|---|---|---|
| Margin | 0.97 | 1.33 | ||
| Well defined | 0 | 1 | ||
| Poorly defined | 30 | 22 | ||
| Echogenicity | 0.21 | 1.59 | ||
| Markedly hypoechoic | 2 | 0 | ||
| Hypoechoic | 28 | 23 | ||
| Presence of lymph nodes | 0.24 | 1.41 | ||
| Absent | 25 | 16 | ||
| Present | 5 | 7 | ||
| Vascularity | 0.78 | 0.08 | ||
| No vascularity | 2 | 2 | ||
| Peripheral and/or internal | 28 | 21 | ||
| Shape | 0.0004 | 12.76 | ||
| Taller than wide | 29 | 13 | ||
| None | 1 | 10 | ||
| Calcification | < 0.0001 | 29.89 | ||
| No calcifications | 30 | 7 | ||
| Microcalcifications | 0 | 9 | ||
| Macrocalcifications | 0 | 7 | ||
| Enhancement type | 0.36 | 0.84 | ||
| Hypoenhancement | 23 | 15 | ||
| Hyperenhancement or isoenhancement | 7 | 8 | ||
| Degree of contrast agent distribution | 0.06 | 3.66 | ||
| Diffuse homogeneous | 7 | 1 | ||
| Heterogeneous | 23 | 22 |
Abbreviations: aSAT, asymptomatic subacute thyroiditis; PTC, papillary thyroid carcinoma; CEUS, contrast-enhanced ultrasonography; US, ultrasonography.
aThe χ2 value is obtained by a two-tailed Chi-square test. Shape and calcification show significant differences between the aSAT and PTC patients.
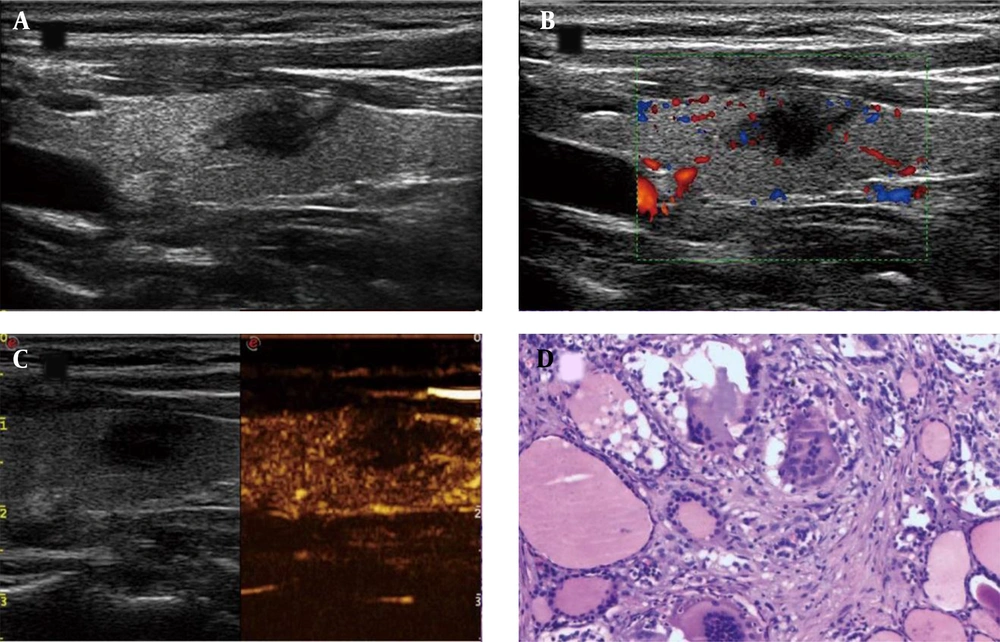
A thyroid imaging reporting & data system (TI-RADS) 4c asymptomatic subacute thyroiditis (aSAT) nodule in a 52-year-old woman. A, Conventional two-dimensional image. B, Color Doppler image. C, Contrast-enhanced ultrasonography (CEUS) image indicates hypoenhancement. D, The pathological examination reveals symptomatic subacute thyroiditis (SAT) (H&E staining, × 100).
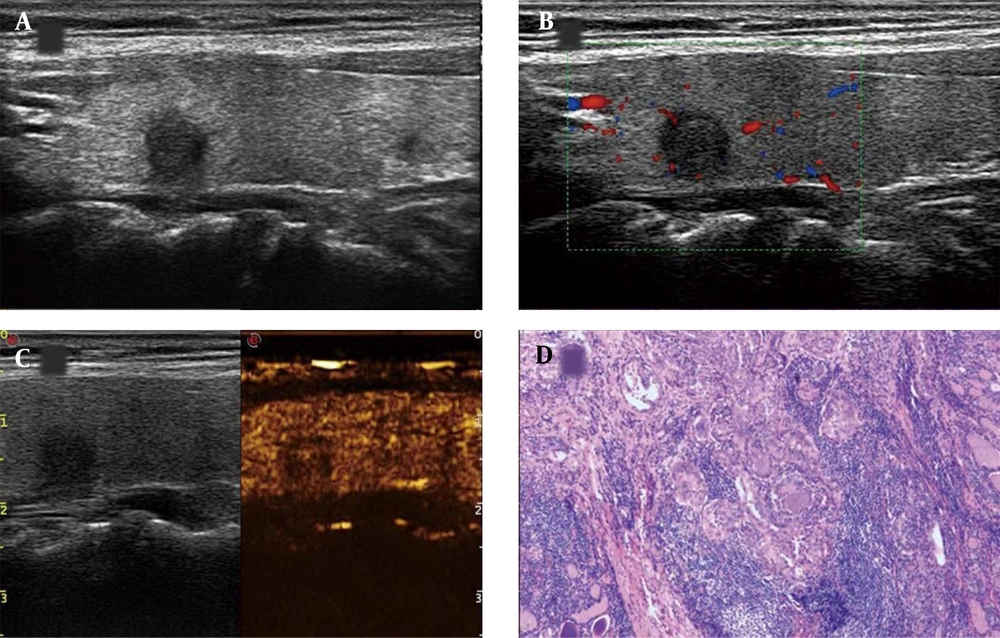
A thyroid imaging reporting & data system (TI-RADS) IV papillary thyroid carcinoma (PTC) nodule in a 50-year-old woman. A, Conventional two-dimensional image. B, Color Doppler image. C, The CEUS image indicates hypoenhancement. D, The pathological examination indicates PTC (H&E staining, × 100).
4.3. Comparison of Quantitative CEUS Parameters
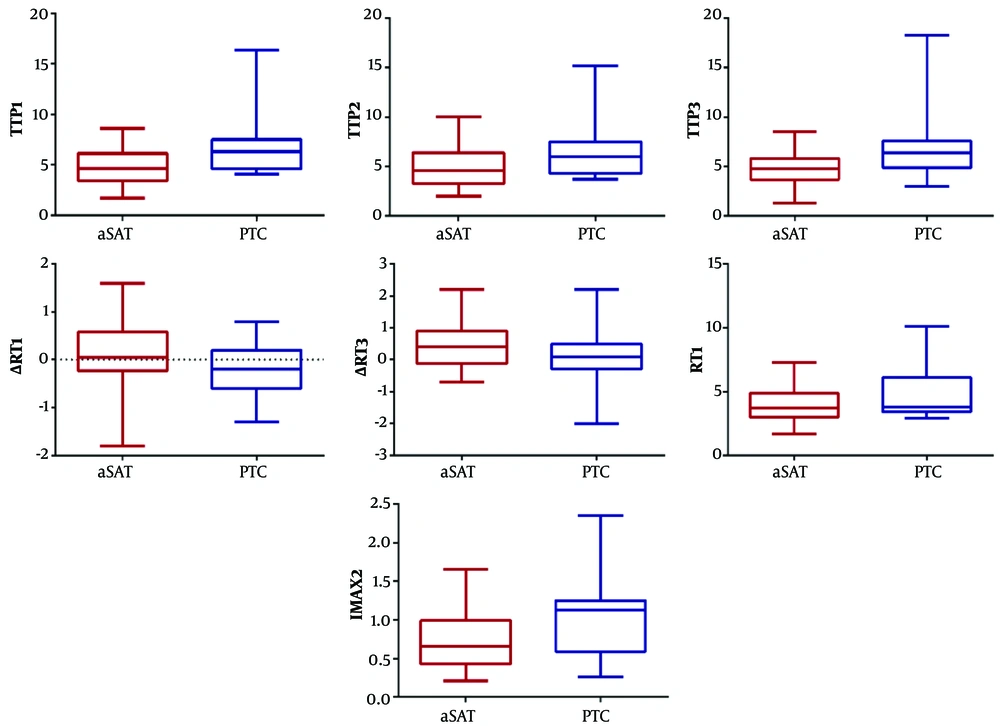
Schematic representation of quantitative parameters with significant differences between the aSAT and PTC groups. Compared to PTC patients, the aSAT group have longer ∆RT1 and ∆RT3. Compared to the PTC patients, the aSAT group also has shorter RT1, TTP1, TTP2, and TTP3 and lower IMAX2 (aSAT, asymptomatic subacute thyroiditis; PTC, papillary thyroid carcinoma; RT, rise time; TTP, time to peak; IMAX, maximum intensity; RT1, RT of whole ROI; ∆RT1, RT of the control area – RT of the whole ROI; ∆RT3, RT of the control area – RT of the central ROI; TTP1, TTP of the whole ROI; TTP2, TTP of the peripheral ROI; TTP3, TTP of the central ROI; and IMAX2, IMAX of the peripheral ROI).
| Characteristics | aSAT | PTC | P-value c | t |
|---|---|---|---|---|
| ∆RT1 | 0.12 ± 0.69 | -0.2 ± 0.57 | 0.03 | 1.96 |
| ∆RT3 | 0.43 ± 0.72 | 0.04 ± 0.94 | 0.049 | 1.68 |
| RT1 | 4.05 ± 1.56 | 4.91 ± 2.09 | 0.045 | -1.73 |
| TTP1 | 4.91 ± 1.76 | 7.30 ± 3.92 | 0.005 | -2.97 |
| TTP2 | 5.06 ± 1.97 | 7.00 ± .48 | 0.01 | -2.57 |
| TTP3 | 4.90 ± 1.68 | 7.57 ± 4.41 | 0.004 | -3.05 |
| IMAX2 | 0.74 ± 0.36 | 1.09 ± 0.57 | 0.009 | -2.689 |
Abbreviations: aSAT, asymptomatic subacute thyroiditis; PTC, papillary thyroid carcinoma; RT, rise time; TTP, time to peak; IMAX, maximum intensity; RT1, RT of the whole ROI; ∆RT1, RT of the control area – RT of the whole ROI; ∆RT3, RT of the control area – RT of the central ROI; TTP1, TTP of the whole ROI; TTP2, TTP of the peripheral ROI; TTP3, TTP of the central ROI; IMAX2, IMAX of the peripheral ROI; CEUS, contrast-enhanced ultrasonography.
aData are presented as mean ± standard deviation unless otherwise stated.
bCompared to PTC patients, the aSAT group shows longer ∆RT1 and ∆RT3. In contrast, compared to PTC patients, the aSAT group shows shorter RT1, TTP1, TTP2, and TTP3 and lower IMAX2.
cP-value is obtained by a two-tailed independent-samples t-test.
| AUC | P-value | Youden’s index | Associated criterion | Sensitivity | Specificity | ∆RT1 | ∆RT3 | TTP1 | TTP2 | TTP3 | IMAX2 | |
|---|---|---|---|---|---|---|---|---|---|---|---|---|
| RT1 | 0.614 | 0.144 | 0.2464 | ≤ 3.2 | 33.33 | 91.3 | P = 0.7551 | P = 0.9774 | P = 0.0270 b | P = 0.1355 | P = 0.0611 | P = 0.4625 |
| ∆RT1 | 0.648 | 0.052 | 0.2551 | ≤ 0-0.2 | 73.33 | 52.17 | P = 0.6608 | P = 0.5977 | P = 0.7846 | P = 0.5339 | P = 0.6914 | |
| ∆RT3 | 0.612 | 0.158 | 0.2188 | ≤ 0.3 | 56.67 | 65.22 | P = 0.3466 | P = 0.5024 | P = 0.3287 | P = 0.4098 | ||
| TTP1 | 0.703 | 0.005 | 0.3188 | ≤ 5.2 | 66.67 | 65.22 | P = 0.2154 | P = 0.8376 | P = 0.9224 | |||
| TTP2 | 0.678 | 0.016 | 0.2754 | ≤ 5.7 | 66.67 | 60.87 | P = 0.4771 | P = 0.8692 | ||||
| TTP3 | 0.711 | 0.003 | 0.3551 | ≤ 6.2 | 83.33 | 52.17 | P = 0.8738 | |||||
| IMAX2 | 0.693 | 0.012 | 0.4319 | ≤ 1.08 | 86.67 | 56.52 |
Abbreviations: AUC, area under the curve; RT, rise time; TTP, time to peak; IMAX, maximum intensity; RT1, RT of the whole ROI; ∆RT1, RT of the control area – RT of the whole ROI; ∆RT3, RT of the control area – RT of the central ROI; TTP1, TTP of the whole ROI; TTP2, TTP of the peripheral ROI; TTP3, TTP of the central ROI; and IMAX2, IMAX of the peripheral ROI; PTC, papillary thyroid carcinoma; aSAT, asymptomatic subacute thyroiditis; ROC, receiver operating characteristic.
aThe ROC curve analysis of each quantitative parameter is presented.
bAUC of TTP1 is significantly larger than that of RT1 (P < 0.05).
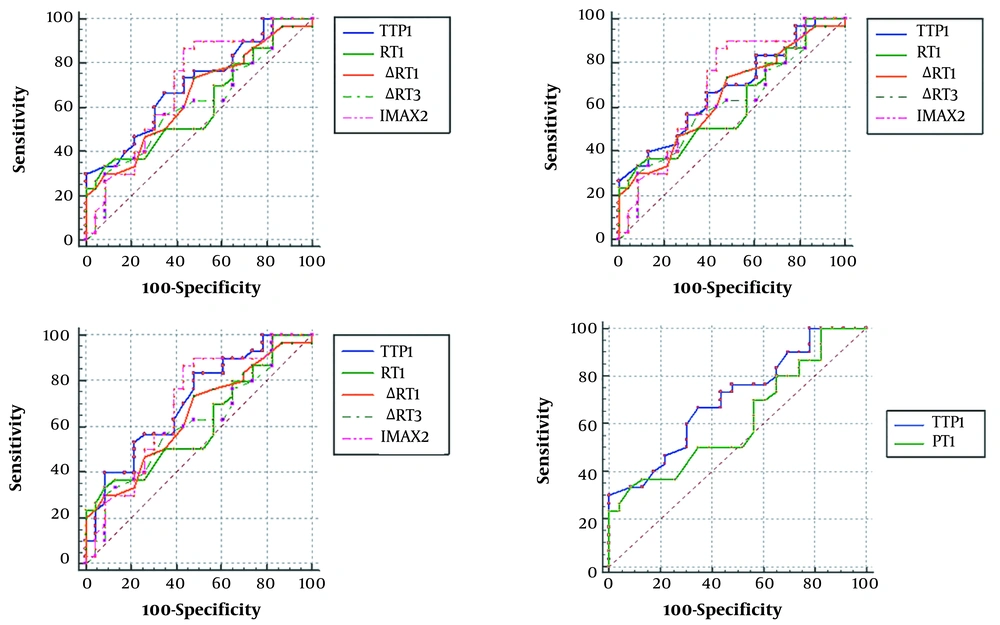
Schematic representation of the receiver operating characteristic (ROC) curve. The TTP parameters (TTP1, TTP2, and TTP3) all have larger AUCs. The AUC of TTP1 is significantly larger than that of RT1 (AUC, area under the curve; TTP, time to peak; IMAX, maximum intensity; RT1, RT of the whole ROI; ∆RT1, RT of the control area – RT of the whole ROI; ∆RT3, RT of the control area – RT of the central ROI; TTP1, TTP of the whole ROI; TTP2, TTP of the peripheral ROI; TTP3, TTP of the central ROI; and IMAX2, IMAX of the peripheral ROI).


