


1. Background
2. Objectives
3. Patients and Methods
3.1. Participants

The flowchart of patient enrollment
3.2. Definitions
3.3. Data Collection
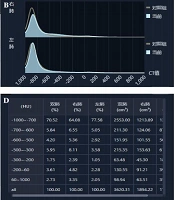
3.4. Physician-based and AI-based Quantization of CT Scans
.")
The quantitative evaluation system for COVID-19. The first columns represent the original CT scans. The second column represents automatic quantization and visualization by the AI system. 2A-2B, Original CT scans and quantization and visualization by the AI system for a 38-year-old patient at the time of hospital admission. 2C-2D, CT scans for patient with non-progressing pneumonia 12 days after admission. 2E-2F, Original CT scans and quantization and visualization for a 28-year-old patient on admission. 2G-2H, CT scans for a 28-year-old patient with progressing pneumonia 12 days after admission (red and blue pseudo colors represent ground glass opacity and consolidation, respectively).
3.5. Feature Selection and Model Construction
| Variables | Total | Training set | Test set | P-value |
|---|---|---|---|---|
| No. | 786 | 628 | 158 | |
| Age (median [IQR]) | 56.00 [42.00, 65.00] | 50.50 [36.75, 58.75] | 61.50 [52.75, 69.00] | < 0.001 |
| Sex, female (%) | 432 (55.0) | 322 (51.3) | 110 (69.6) | 0.433 |
| Comorbidity, yes (%) | 382 (48.6) | 298 (47.4) | 84 (53.2) | 0.888 |
| Hypertension | 146 (38.3) | 116 (38.9) | 32 (38.1) | 0.565 |
| Diabetes | 101 (26.4) | 83 (27.8) | 21 (25.0) | 0.557 |
| Cardiovascular disease | 67 (17.5) | 41(13.8) | 18 (21.5) | 0.268 |
| Others | 68 (17.8) | 58 (19.5) | 13 (15.5) | 0.494 |
| Primary symptoms (%) | ||||
| Fever | 550 (70.0) | 438 (69.7) | 112 (70.8) | 0.545 |
| Cough | 404 (51.4) | 330 (52.6) | 74 (48.6) | 0.444 |
| Fatigue | 387 (49.3) | 256 (40.8) | 131 (82.9) | 0.021 |
| Myalgia | 314 (39.9) | 257 (40.9) | 57 (36.1) | 0.352 |
| Others | 180 (22.9) | 157 (25.0) | 23 (14.6) | 0.325 |
| Outcomes, progressing (%) | 238 (30.3) | 197 (31.3) | 41 (25.9) | 0.506 |
| Laboratory indicators | ||||
| CK, U/L (ref: 40 - 200) | 70.00 [45.00, 101.00] | 77.00 [56.00, 100.50] | 62.00 [39.50, 105.00] | 0.224 |
| LDH, U/L (ref: 120 - 250) | 211.00 [179.00, 277.00] | 218.00 [186.25, 277.00] | 201.00 [168.50, 257.50] | 0.084 |
| ALT, U/L (ref: 7 - 40) | 20.00 [13.00, 30.50] | 19.00 [13.00, 30.00] | 22.00 [13.00, 36.00] | 0.28 |
| AST, U/L (ref: 13 - 35) | 25.00 [17.50, 31.00] | 24.00 [18.00, 30.25] | 25.00 [17.00, 31.50] | 0.87 |
| TBIL, μmol/L (ref: 0 - 23) | 9.15 [7.40, 12.55] | 8.50 [7.40, 12.20] | 9.50 [7.20, 13.55] | 0.494 |
| Cr, μmol/L (ref: 41 - 73) | 60.00 [50.50, 73.50] | 61.00 [51.75, 78.00] | 58.00 [48.50, 71.00] | 0.054 |
| Urea, mmol/L (ref: 2.6 - 7.5) | 4.15 [3.33, 5.16] | 4.22 [3.58, 5.39] | 4.11 [3.17, 5.09] | 0.159 |
| PLT, 109/L (ref: 125 - 350) | 181.00 [143.50, 242.00] | 157.00 [131.50, 196.00] | 230.00 [160.00, 260.00] | < 0.001 |
| Mono, 109/L (ref: 0.1 - 0.6) | 0.44 [0.33, 0.57] | 0.45 [0.33, 0.58] | 0.44 [0.34, 0.57] | 0.927 |
| Lym, 109/L (ref: 1.1 - 3.2) | 1.24 [0.94, 1.62] | 1.19 [0.90, 1.57] | 1.31 [0.96, 1.71] | 0.185 |
| WBC, 109/L (ref: 3.5 - 9.5) | 5.19 [3.81, 6.13] | 4.78 [3.66, 6.07] | 5.45 [3.96, 6.42] | 0.12 |
| Neu, 109/L (ref: 1.8 - 6.3) | 3.14 [2.19, 4.20] | 3.09 [2.13, 4.05] | 3.14 [2.33, 4.45] | 0.236 |
| Lym, % (ref: 20 - 50) | 26.80 [20.05, 34.50] | 27.05 [20.08, 34.52] | 26.80 [20.30, 34.10] | 0.99 |
| CRP, mg/L (ref: 0 - 10) | 12.66 [4.14, 32.95] | 12.59 [4.03, 33.53] | 13.65 [4.60, 29.48] | 0.976 |
| ALB, g/L (ref: 40 - 55) | 39.50 [36.66, 42.20] | 39.90 [36.65, 42.12] | 38.80 [36.66, 42.25] | 0.837 |
| DBIL, μmol/L (ref: 0 - 8.0) | 3.25 [2.52, 4.30] | 3.20 [2.50, 4.20] | 3.30 [2.65, 4.45] | 0.686 |
| GLB, g/L (ref: 20 - 40) | 23.30 [21.60, 25.40] | 23.35 [21.92, 25.50] | 22.85 [21.07, 24.30] | 0.146 |
Abbreviations: CK, creatine kinase; LDH, lactate dehydrogenase; ALT, alanine aminotransferase; AST, aspartate aminotransferase; TBIL, total bilirubin; Cr, creatinine; PLT, platelet count; Mono, monocyte count; Lym, lymphocyte count; WBC, white blood cells; Neu, neutrophil count; CRP, C-reactive protein; ALB, albumin; DBIL, direct bilirubin; GLB, globulin.
3.6. Statistical Analysis
4. Results
4.1. Demographic Characteristics
4.2. Lung Lesion Quantization
4.3. Representative Features and Model Construction
| Variables | Model-C | Model-R-Doc | Model-AI-Mimic-Doc | Model-R-AI | ||||||||
|---|---|---|---|---|---|---|---|---|---|---|---|---|
| Beta | OR (95% CI) | P-value | Beta | OR (95% CI) | P-value | Beta | OR (95% CI) | P-value | Beta | OR (95% CI) | P-value | |
| Urea | 0.57 | 1.77 (1.22 - 2.57) | 0.003 | 0.69 | 1.98 (1.30 - 3.03) | 0.001 | 0.55 | 1.73 (1.19 - 2.53) | 0.004 | 0.65 | 1.91 (1.26 - 2.89) | 0.002 |
| Albumin | -0.17 | 0.84 (0.74 - 0.97) | 0.015 | - 0.16 | 0.85 (0.73 - 0.99) | 0.036 | - 0.14 | 0.87 (0.75 - 1.00) | 0.052 | - 0.14 | 0.87 (0.75 - 0.99) | 0.042 |
| Lesion size in basal segment of RLL (ref: none) | ||||||||||||
| < 3 cm | 0.26 | 1.30 (0.29 - 5.83) | 0.733 | |||||||||
| ≥ 3 cm | 2.09 | 8.11 (1.49 - 44.09) | 0.015 | |||||||||
| Lesion volume in basal segment of RLL (AI-derived) | ||||||||||||
| < (1.5 × 0.5 × 0.5) cm3 | 0.97 | 2.65 (0.83 - 8.40) | 0.099 | |||||||||
| ≥ (1.5 × 0.5 × 0.5) cm3 | 1.1 | 2.99 (0.52 - 17.08) | 0.218 | |||||||||
| PCTL [-200~60) (ref: < 1.77) | 1.13 | 3.10 (1.00 - 9.58) | 0.050 | |||||||||
Abbreviations: RLL, right lower lung lobe lesions; PCTL, percentage of CT values of [-200~600) in left lung; OR, odds ratio; CI, confidence interval.
aModel-C, a model based on clinical findings; Model-R-Doc, a model based on the physician’s examination of radiological features; Model-AI-Mimic-Doc, an AI-based model mimicking the physician’s examinations; Model-R-AI, a based on AI-derived radiological features.
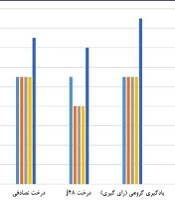
4.4. Construction and Validation of Risk Scores
 of different models for the training (based on five-fold cross-validation) and test cohort sets. The five-fold CV cross-validation training set comprised 80% of the training set, and the five5-fold cross-validation set comprised 20% of the training set. Model-R-Doc, a model based on the physician’s examination of radiological features; Model-R-AI, a based on AI-derived radiological features; Model-C, a model based on clinical findings; Model-AI-Mimic-Doc, an AI-based model mimicking the physician’s examinations.")
The area under the curve (AUC) of different models for the training (based on five-fold cross-validation) and test cohort sets. The five-fold CV cross-validation training set comprised 80% of the training set, and the five5-fold cross-validation set comprised 20% of the training set. Model-R-Doc, a model based on the physician’s examination of radiological features; Model-R-AI, a based on AI-derived radiological features; Model-C, a model based on clinical findings; Model-AI-Mimic-Doc, an AI-based model mimicking the physician’s examinations.
| Models | Cutoff value | Training set | Test set | ||||||
|---|---|---|---|---|---|---|---|---|---|
| Sensitivity | Specificity | AUC (95% CI) | P-value | Sensitivity | Specificity | AUC (95% CI) | P- value | ||
| Model C | -4.264 | 0.711 | 0.722 | 0.770 (0.657 - 0.882) | Ref | 0.600 | 0.656 | 0.666 (0.528 - 0.803) | Ref |
| R-Doc model | -3.097 | 0.789 | 0.806 | 0.840 (0.747 - 0.933) | 0.099 | 0.833 | 0.469 | 0.732 (0.608 - 0.857) | 0.177 |
| AI-Mimic-Doc model | -2.542 | 0.711 | 0.722 | 0.793 (0.689 - 0.897) | 0.357 | 0.500 | 0.688 | 0.683 (0.549 - 0.818) | 0.655 |
| R-AI model | -2.240 | 0.763 | 0.778 | 0.803 (0.701 - 0.906) | 0.198 | 0.600 | 0.781 | 0.731 (0.606 - 0.857) | 0.086 |
Abbreviations: AUC, area under the curve; CI, confidence interval.
aModel-R-Doc, a model based on the physician’s examination of radiological features; Model-R-AI, a based on AI-derived radiological features; Model-C, a model based on clinical findings; Model-AI-Mimic-Doc, an AI-based model mimicking the physician’s examinations.
b The DeLong test was used to compare the AUCs of different models; the cutoff values are based on the median thresholds of risk scores in the training set.