


1. Background
2. Objectives
3. Patients and Methods
3.1. Subject Selection and Clinical Data
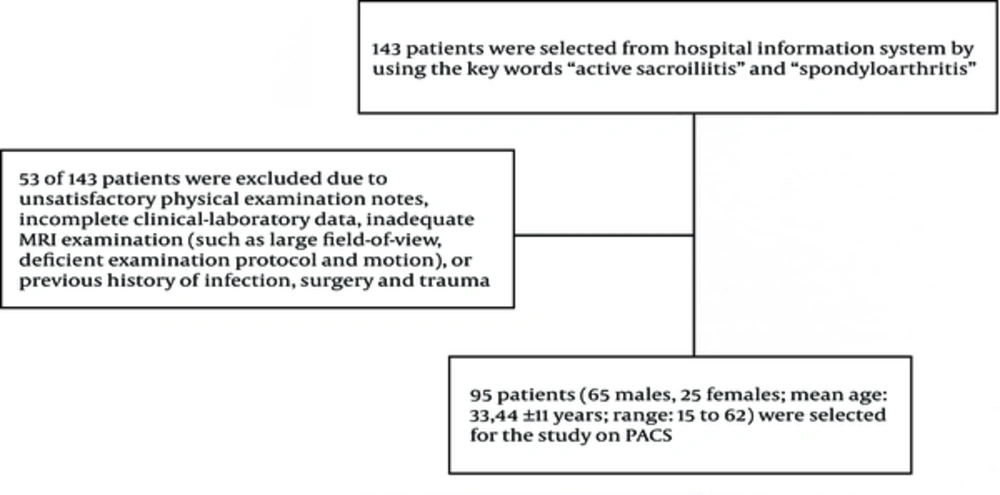
Flow diagram of patients' enrollment
| Sequence Parameters | TR (ms) | TE (ms) | ST (mm) | Gap (mm) | FOV (mm) | |||||
|---|---|---|---|---|---|---|---|---|---|---|
| MR Unit sequence plane | Achieva | Intera | Achieva | Intera | Achieva | Intera | Achieva | Intera | Achieva | Intera |
| STIR coronal | 2734 | 2802 | 60 | 48 | 4 | 4 | 0.4 | 0.4 | 250 × 250 | 250 × 250 |
| T2 WI axial | 3329 | 3256 | 80 | 86 | 4 | 4 | 0.4 | 0.4 | 260 × 260 | 260 × 260 |
| CE FS T1 WI coronal | 500 | 486 | 18 | 16 | 4 | 4 | 0.4 | 0.4 | 250 × 250 | 250 × 250 |
| CE FS T1 WI axial | 570 | 486 | 18 | 16 | 4 | 4 | 0.4 | 0.4 | 260 × 260 | 260 × 260 |
Abbreviations: WI, weighted imaging; TR, time of repetition; TE, time of echo; ST, slice thickness; CE, contrast enhanced; FS, fat suppressed; STIR, short tau inversion recovery; FOV, field of view.
3.2. Statistical Analysis
4. Results
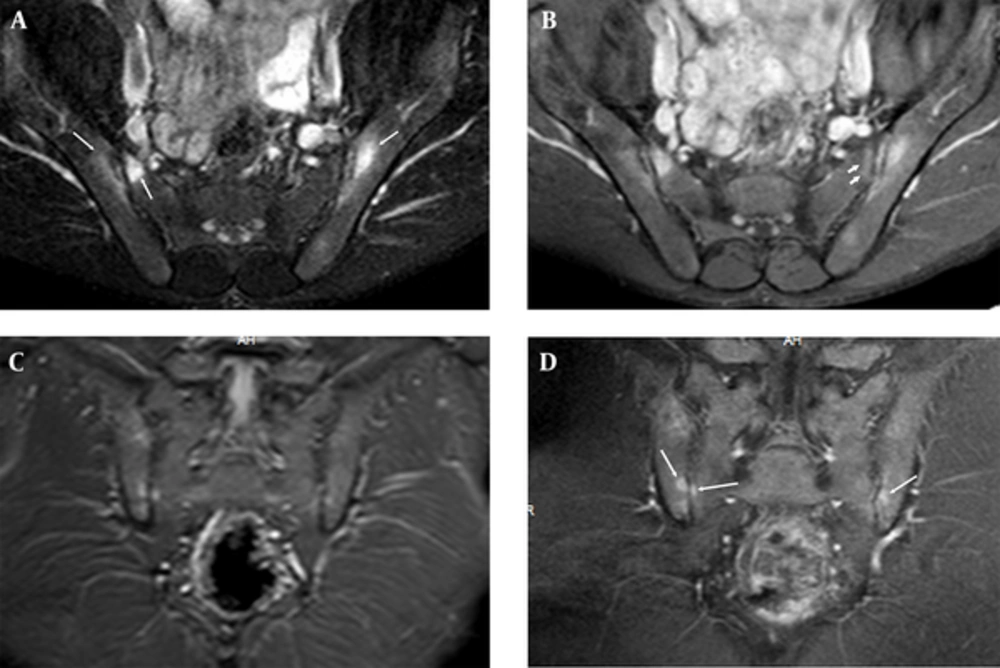
Sacroiliac MRI of a 30-year-old male patient who had normal CRP and ESR values and negative result for HLA B27, which shows osteitis. There is periarticular bone edema at bilateral iliac and right sacral bones (long arrows) on fat suppressed (FS) T2 weighted imaging (WI) (A); FS contrast enhanced (CE) T1 WI (B) of axial planes and STIR (C) and T1 WI of coronal planes (D). There is subchondral edema at left sacral bone on FS CE T1 WI (short arrows) (B, C). These periarticular bone edemas are compatible with osteitis.
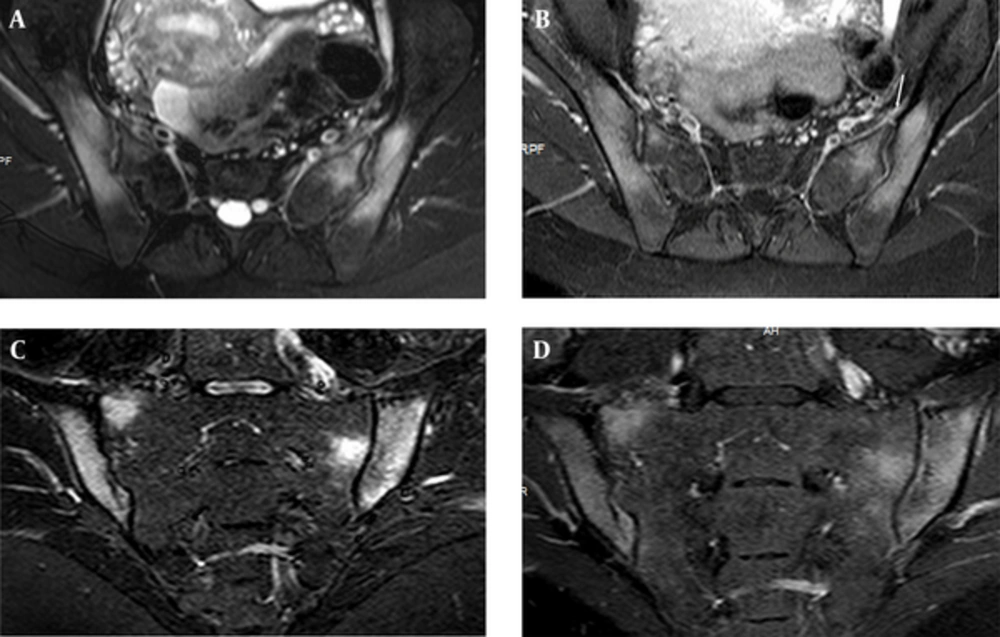
Edema of both sacral and iliac bones, compatible with osteitis are shown on FS T2 weighted (A) and CE T1 weighted (B) image of axial planes in a 25-year-old female with elevated CRP and ESR values and positive result for HLA B27. STIR (short tau inversion recovery) (C) and FS CE (fat suppressed contrast enhanced) T1 weighted (D) images of coronal plane show the same findings. Left Anterior capsulitis (arrow) is seen on FS T2 W (A) and CE T1 W (B) image of axial planes.
| Edema and Enhancement | Sequence | Percentage of Agreement | Kappa Coefficient | P Value |
|---|---|---|---|---|
| Right iliac | STIR-1 | 96.67 | 0.916 | < 0.001 |
| STIR-2 | ||||
| STIR-1 | 92.22 | 0.814 | < 0.001 | |
| STIR-G | ||||
| T2-1 | 98.89 | 0.963 | < 0.001 | |
| T2-FS-2 | ||||
| T2-1 | 93.33 | 0.792 | < 0.001 | |
| T2-G | ||||
| T1-CE-AX-1 | 100.00 | 1 | < 0.001 | |
| T1-CE-AX-2 | ||||
| T1-CE-AX-1 | 97.78 | 0.933 | < 0.001 | |
| T1-CE-AX-G | ||||
| T1-CE-CR-1 | 97.78 | 0.933 | < 0.001 | |
| T1-CE-CR-2 | ||||
| T1-CE-CR-1 | 91.11 | 0.761 | < 0.001 | |
| T1-CE-CR-G | ||||
| Left iliac | STIR-1 | 96.67 | 0.898 | < 0.001 |
| STIR-2 | ||||
| STIR-1 | 92.22 | 0.762 | < 0.001 | |
| STIR-G | ||||
| T2WI-1 | 100.00 | 1 | < 0.001 | |
| T2WI-2 | ||||
| T2WI-1 | 94.44 | 0.783 | < 0.001 | |
| T2WI-G | ||||
| T1WI-CE-AX-1 | 100.00 | 1 | < 0.001 | |
| T1WI-CE-AX-2 | ||||
| T1WI-CE-AX-1 | 93.33 | 0.793 | < 0.001 | |
| T1WI-CE-AX-G | ||||
| T1WI-CE-CR-1 | 98.89 | 0.946 | < 0.001 | |
| T1WI-CE-CR-2 | ||||
| T1WI-CE-CR-1 | 95.56 | 0.808 | < 0.001 | |
| T1WI-CE-CR-G | ||||
| Right Sacral | STIR-1 | 97.78 | 0.945 | < 0.001 |
| STIR-2 | ||||
| STIR-1 | 91.11 | 0.778 | < 0.001 | |
| STIR-G | ||||
| T2-1 | 98.89 | 0.954 | < 0.001 | |
| T2-2 | ||||
| T2-1 | 97.78 | 0.91 | < 0.001 | |
| T2-G | ||||
| T1-CE-AX-1 | 100.00 | 1 | < 0.001 | |
| T1-CE-AX-2 | ||||
| T1-CE-AX-1 | 94.44 | 0.752 | < 0.001 | |
| T1-CE-AX-G | ||||
| T1-CE-CR-1 | 100.00 | 1 | < 0.001 | |
| T1-CE-CR-2 | ||||
| T1-CE-CR-1 | 92.22 | 0.743 | < 0.001 | |
| T1-CE-CR-G | ||||
| Left Sacral | STIR-1 | 100.00 | 1 | < 0.001 |
| STIR-2 | ||||
| STIR-1 | 93.33 | 0.814 | < 0.001 | |
| STIR-G | ||||
| T2-1 | 100.00 | 1 | < 0.001 | |
| T2-FS-2 | ||||
| T2-1 | 93.33 | 0.748 | < 0.001 | |
| T2-G | ||||
| T1-CE-AX-1 | 100.00 | 1 | < 0.001 | |
| T1-CE-AX-2 | ||||
| T1-CE-AX-1 | 96.67 | 0.889 | < 0.001 | |
| T1-CE-AX-G | ||||
| T1-CE-CR-1 | 98.89 | 0.961 | < 0.001 | |
| T1-CE-CR-2 | ||||
| T1-CE-CR-1 | 92.22 | 0.763 | < 0.001 | |
| T1-CE-CR-G |
Abbreviations and explanations: 1, First evaluation of observer1; 2, second evaluation of observer 1; G, evaluation of observer 2; STIR, short tau inversion recovery sequence; T2, T2 weighted image; T1, T1 weighted image; CE contrast enhanced; AX, axial plane; CR, coronal plane; FS, fat suppressed.
