1. Background
One of the most common clinical problems is the differentiation of vertebral marrow lesions, particularly in the elderly patients. In spite of osteoporotic compression fracture that is common in this age, the spine is regarded as one of the most common sites of bone metastases that may result in pathologic fracture. Since clinical staging, treatment strategy, and prognosis in malignant and benign lesions are different, it is very essential to determine the benign and malignant nature of vertebral pathologies (1).
Although the conventional MRI plays a fundamental role in the evaluation of bone tumors, its specificity is limited. To be illustrated, atypical hemangioma in conventional MRI appears similar to malignancy (2). Furthermore, osteoporotic or traumatic compression fracture in the acute phase appears hypointense on T1-weighted and hyperintense on T2-weighted images that can be confused with metastatic compression fracture (3). Therefore, we need supplemental techniques for more accurate diagnosis in MRI.
Diffusion weighted MRI has recently applied with conventional MRI for characterizing vertebral lesions. DWI measures the random extra, intra, and transcellular motion of water molecules, and it is highly sensitive to cellularity and free water molecule mobility (4).
DWI can provide useful information about the nature of lesions, but because of T2 effect, it may demonstrate benign and malignant lesions in similar appearance. As a result, it lacks sensitivity and accuracy in differentiating benign from malignant lesions (5, 6).
Apparent-diffusion-coefficient (ADC) is a quantitative parameter obtained by DWI. It removes the T2 effect from the diffusion images and provides a quantitative signal that is directly related with the degree of diffusion of water. ADC value is displayed as a parametric map and by drawing regions of interests on this map, the ADC values can be obtained (7).
In addition to diffusion, chemical shift images can be a best supplemental technique for differentiating benign and malignant lesions. Chemical shift MR imaging (also identified as in-phase and out-of-phase imaging or opposed-phased imaging) are pairs of GRE images at the same TR, but with two different time echo, which assess the presence of water and fat in a tissue voxel at the molecular level. If a voxel contains both fat and water, drop of signal on out-of-phase images will be occurred (8). Based on the fact that fatty marrow replaces with malignant tumor cells, the differentiation of benign and malignancy could be possible, and they can solve the diagnostic problem of marrow signal intensity difference between hyper cellular red marrow and malignant infiltration.
The aim of this study was to assess the diagnostic accuracy of chemical shift MR imaging and the minimum, mean, and maximum ADC values in differentiating benign and malignant vertebral marrow lesions and to establish the optimal cut-off signal intensity ratio (SIR) and ADC values with appropriate sensitivity and specificity.
2. Methods
This prospective study included 39 patients (22 males and 17 females with the mean age of 58.34 years and the age ranged 33 - 76 years), who had altered signal in one or more vertebral bodies. The decision to include a patient was taken in after acquiring and reviewing immediately the sagittal T1-weighted sequence. If one vertebra was seen showing one hypointense (diffuse homogeneous or heterogeneous decreased marrow signal intensity compared with muscle and non-degenerated intervertebral disk) or hyper intense lesion (focal or diffuse signal alteration similar to that of subcutaneous fat), the full protocol of sequences and measurements was activated. Exclusion criteria were (1) lesions already underwent with chemotherapy, radiation therapy, and surgery (2) contraindication to MRI e.g. an implanted magnetic device, pacemakers (3) pregnancy (4) percutaneous biopsy (because of presenting blood products that effect on DWI characteristic) (5) lesions lesser than 1 cm (in order to ensure an exact measurement of the ADC values within a region of interest (ROI)).
All patients were examined between March 2015 and September 2016. A total of 39 patients have 67 vertebral lesions. The histopathologic diagnosis as well as the final clinical diagnosis were used as the gold standard to classify the vertebral bone marrow as benign or malignant; 25 vertebral body without pathologic SI on MR images were considered as a control group. Overall, 67 vertebral lesions and 25 normal vertebrae were assessed.
2.1. Techniques
MRI studies were done on a 1.5-T MR system (avonto siemen, Germany), using a suitable body or surface coil.
MR image techniques:
1- T1 weighted image in sagittal plane: Image sequence: fast spin echo (FSE), Time Repetition: 399, time Echo: 10 ms to 14ms, Field of view: 20 cm to 25 cm, slice thickness: 4.5 mm, NEX = 3 - 4 excitation.
2- T2 weighted image in sagittal and axial plane: Image sequence: FSE, time repetition: 3100 ms to 4000 ms, time Echo: 100 ms to 115 ms, field of view: 20 cm to 25 cm, slice thickness: 4.5 mm, NEX = 3 - 4 excitation.
Number of slice was different according to the lesion size.
3- Short Time Inversion Recovery (STIR) in the sagittal plane: Image sequence: FSE, Time Repetition: 4500 ms, time Echo: 70 ms, field of view: 20 cm to 25cm, slice thickness: 5 mm, flip angle: 150.
3- Diffusion weighted imaging and apparent diffusion coefficient mapping: a fast saturated single shot turbo spin echo was obtained in sagittal plane with following parameters:
Time Repetition: 3200 ms, Time echo: 94 ms, flip angle: 90 slice thickness: 5 mm. the b values were 0, 50, 1000, and ADC map was obtained by processing of DW images.
In spite of these sequences: sagittal in-phase and opposed-phase image added to the protocols with following parameters: Time Repetition: 90, Flip angle: 70, slice Thickness: 5.5 mm, FOV: 20 - 25 cm. Time echo for in-phase image was 4.9 ms and for opposed phase image was 2.2 ms.
2.2. Post Process
Three radiologists with over 10 years of experience in musculoskeletal radiology interpreted images and during the MR images analysis, they were blinded to the pathological results. All MRI findings have been correlated with the pathological results and clinical follow-up.
2.3. Quantitative Analysis
1- The ROI (Region of Interest) was placed in the solid portion of the tumor and tumor-like lesions that was variable according to lesions size.
2- After drawing ROI on the 3 points of lesion, minimum, mean, and maximum ADC values were recorded. The ADC values were automatically obtained, using MR scanners software.
3- In addition, the ROI was placed on the 3 points of lesion and adjacent normal vertebral body on in-phase and out of phase images. Then, the average signal intensity of these lesions and normal vertebra was calculated.
4- The change that occurred in the signal intensity of normal and abnormal marrow was estimated by SIR (signal intensity ratio). SIR is the marrow mean signal intensity on the opposed phase to the mean signal intensity on the in phase images.
The certification of ethics committee regarding this article was provided by Shaheed Beheshti University of Medical Sciences with ethic number: IR.SBMU.RETECH.REC.1397.94 and informed consent was taken from each patient.
2.4. Statistical Analysis
The analysis of data was performed to assess statistical significant variances. The (minimum, mean, and maximum) ADC values and SIR of benign and malignant vertebral lesions were compared by Chi-square and independent t test. ROC (Receiver operating characteristic) curves were plotted to find the optimal cutoff point of SIR and the (minimum, mean, and maximum) ADC values to discriminate benign from metastatic vertebral lesions with calculation of accuracy, specificity, sensitivity, and area under the curve (AUC). Statistical analyses were performed, using SPSS, Version19.0.0.
3. Results
This prospective study included 39 patients (22 (56%) males and 17 (43%) females, with a mean age of 58.45 years and the age ranged 32 - 83 years). A total of 39 patients had 67 vertebral lesions. The diagnosis of lesions was confirmed by biopsy or 6 month follow-up; 42 lesions were proved to be malignant, and the other 25 lesions were proved to be benign.
All hemangioma lesions were hyperintense on T1 and T2 and hypointense on diffusion weighted images except 2 lesions that were hyperintense on DWI (Figure 1). Benign vertebral CFs (osteoporotic, acute traumatic) were diffusely hypointense on T1 weighted, hyperintense on T2WIs and STIR sequences. On diffusion weighted image, out of 14 acute CFs, 9 were hypointense, 3 were hyperintense, and 2 lesions showed isointense signal intensity (compared with the signal intensity of normal bone marrow). All malignant lesions were hypointense on T1-weighted images and hyperintense on T2WIs, STIR and diffusion-weighted sequences except 4 lesions that appeared hypointense on DWI.
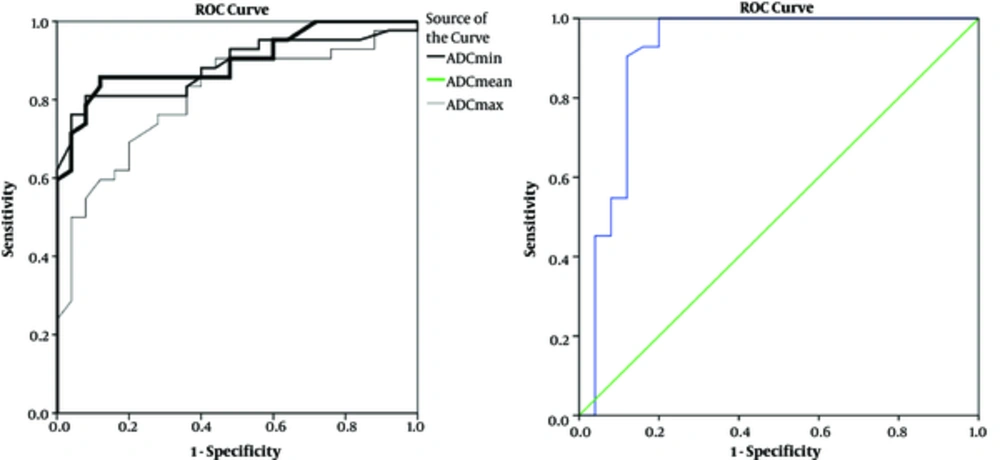
Figure 1.
Receiver-operating characteristic (ROC) curve for the discrimination between benign and malignant lesions, using the A, ADC and B, SIR
Out of 42 lesions, which were proved to be malignant, 38 lesions were hyperintense on diffusion weighted image. They showed minimum (0.564 ± 0.142 × 10⁻³ mm2/s), mean (0.933 ± 0.255 × 10⁻³ mm2/s), and maximum (1.34 ± 0.289 × 10⁻³ mm2/s) ADC values. Also, 18 (44%) out of the 25 lesions, which were proved to be benign by the gold standard, were hypointense on diffusion weighted images with the minimum (0.794 ± 0.121 × 10⁻³ mm2/s), mean (1.399 ± 0.229 × 10⁻³mm2/s), and maximum (1.713 ± 0.286 × 10⁻³ mm2/s) ADC values (Table 1).
Table 1.
Comparison of ADC Values of Benign Lesions, Malignancies, and Normal Marrow
| Variables | Minimum ADC Value, × 10-3mm2/s | Mean ADC Value, × 10-3mm2/s | Maximum ADC Value, × 10-3mm2/s |
|---|---|---|---|
| Benign vertebral lesions | 0.794 ± 0.121 | 1.399± 0.229 | 1.713 ± 0.286 |
| Malignant vertebral lesions | 0.564 ± 0.142 | 0.933± 0.255 | 1.348 ± 0.289 |
| Normal vertebral marrow | 0.122 ± 0.07 | 0.443 ± 0.086 | 0.774 ± 0.105 |
Abbreviation: ADC, Apparent-diffusion-coefficient.
On the other hand, 37 (94%) of the 42 lesions, which were proved to be malignant, showed no signal drop with median SIR of 1.155 ± 0.183 and 21 out of 25 lesions, which were proved to be benign, showed a signal drop with SIR average of 0.649 ± 0.341 (Table 2).
Table 2.
Comparison of Signal Intensity Ratio of Benign Lesions, Malignancies, and Normal Marrow
| Variables | Mean SIR ± SD | Range |
|---|---|---|
| Benign vertebral lesions | 0.649 ± 0.341 | 0.12 - 1.201 |
| Malignant vertebral lesions | 1.115 ± 0.183 | 0.821 - 1.554 |
| Normal vertebral marrow | 0.526 ± 0.113 | 0.15 - 0.64 |
Abbreviation: SIR, signal intensity ratio; SD, standard deviation
The minimum, mean, and maximum ADC values of normal vertebral marrow were 0.122 ± 0.073 × 10⁻³ mm2/s, 0.443 ± 0.0865 × 10⁻³mm2/s, and 0.774 ± 0.105 × 10⁻³ mm2/s) that were significantly lower than benign and malignant lesions (P < 0.001), while the mean signal intensity ratio for normal bone marrow was 0.526 ± 0.113 that showed no statistically significant difference between SIR for benign vertebral lesions and normal bone marrow(P = 0.093).
The ADC values of normal bone marrow and malignant group were significantly lower than ADC values of benign lesions (P < 0.001). On the other hand, the mean signal intensity ratios for the benign vertebral lesions and normal control group were significantly lower than SIR values of the malignant lesions.
In order to differentiate benign lesions from malignant ones, a threshold value was calculated, using the ROC analysis. ROC analysis yielded optimal threshold values of 0.66 × 10⁻³ mm2/s (minimum ADC), 1.2 × 10⁻³ mm2/s (mean ADC), and 1.5 × 10⁻³ mm2/s (maximum ADC) that showed sensitivity of 81%, 85.7%, 78% and specificity of 84%, 88%, 72% for differentiating benign and malignant lesions (Table 3 and Figure 1).
Table 3.
Threshold ADC Values and SIR of Benign and Malignant Vertebral Marrow Lesions
| Threshold Value | Accuracy, % | Sensitivity, % | Specificity, % |
|---|---|---|---|
| ADC mean < 1.2, × 10-3mm2/s | 90 | 85.7 | 88 |
| ADC min < 0.665, × 10-3mm2/s | 88.5 | 81 | 84 |
| ADC max < 1.5, × 10-3mm2/s | 81.5 | 78 | 72 |
| SIR > 0.92 | 92 | 90.5 | 88 |
In the current study, we compared the diagnostic value of ADC minimum, mean, and maximum. Although ADC minimum and mean showed close diagnostic impact, ADC mean had higher sensitivity and accuracy compared with maximum and minimum ADC values (Table 3).
4. Discussion
Spine is the most common site of bone metastases, and it is very essential to differentiate metastatic lesions from benign ones in patients with cancer (1). Although conventional MRI plays a fundamental role in the evaluation of bone tumors, its specificity is limited. For example, T1 weighted images may show benign lesions similar to malignancies as in our study all metastatic lesions and all acute CFs were hypointense in T1WI. As a result, it is difficult to distinguish malignancy based on T1-weighted images alone, which is in agreement with studies conducted by Zidan et al. (9) and Martel Villagran et al. (10). Therefore, more accurate diagnosis in MRI needs supplemental techniques.
DWI showed that out of 14 acute benign CFs (osteoporotic or acute traumatic), 9 were hypointense, 3 were hyperintense and 2 lesions showed isointense signal intensity (compared with the signal intensity of normal bone marrow). Among the hemangioma lesions, out of 11 lesions, 9 were hypointense and 2 were hyperintense. All metastatic lesions were hyperintense in DWI except 4 lesions that can be blastic ones. In the present study, some of benign lesions were hyperintense that can be attributed to the T2 effect (Figure 2). The findings of this study were concordant with studies carried out by Abodewan et al. (7) and Ballio et al. (5), while they differed from that reported by Turna et al.; (11) they stated that the majority of benign CF showed hyperintense on DW images, which might due to the use of lower b-value or different sequence.
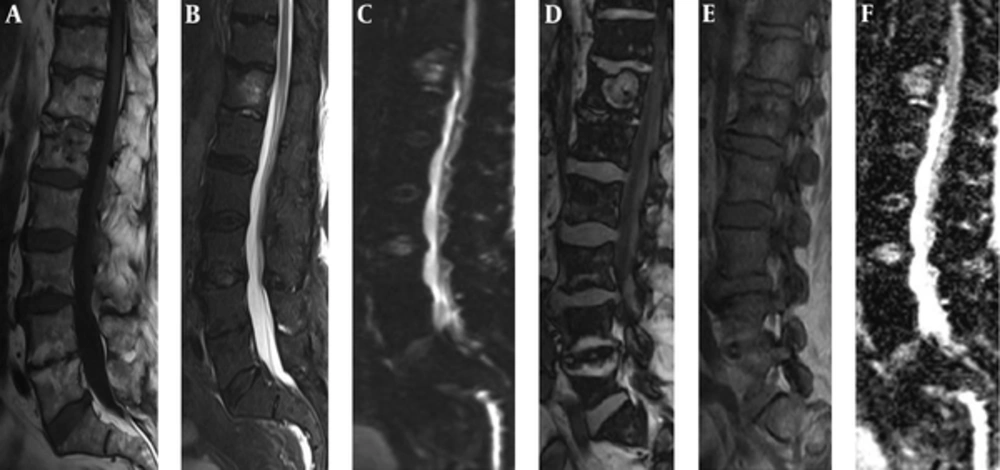
Figure 2.
Male patient, 87 years old with hemangioma. A, Sagittal T1-weighted and B, STIR and C, DWI images revealed the hemangioma hyperintense. D, Sagittal opposed phase and E, in phase show low signal intensity ratio (0.75). F, ADC map shows a high apparent coefficient by ADC value of 1.58 × 10⁻³mm2/s, which confirmed the benignity nature of the lesion.
Similar to Zidan et al. and Tadros et al., we applied 3 diffusion sensitizing gradients with b-values of 0, 50, and 800 mm2/s. The average values of minimum, mean, and max ADC for malignant lesions were 0.564 ± 0.142 × 10⁻³ mm2/s, 0.933 ± 0.255 × 10⁻³ mm2/s, and 1.348 ± 0.289 × 10⁻³ mm2/s and the same value for benign lesions were 0.794 ± 0.121 × 10⁻³ mm2/s, 1.399 ± 0.229 × 10⁻³mm2/s, and 1.713 ± 0.286 × 10⁻³ mm2/s. The findings of the current study on ADC mean were similar to Abo Dewan et al. (7), but this study had some limitations in this comparison, since the number of CFs was small and we did not have inflammatory/infective lesions.
The present study showed that ADC values of benign lesions were definitely higher than malignant lesions, which was concordant with studies conducted by Balliu et al. (5), Abo Dewan et al. (7), and Zidan et al. (9).
In contrast of this study, Turna et al. (11) and Maeda et al. (12) stated that ADC values are not useful in differentiating benign and malignant lesions because of existing some overlap. This controversy might be related to technical variances between studies and different disease stages (ADC value of chronic compression fracture may be similar to malignant lesions).
In agreement with the current study, Chan et al. (13) showed a statistically significant difference between the ADC values of acute benign and malignant fracture. They found no overlap between their ADC values, while we found some overlap. In this study, 4 metastatic lesions showed ADC minimum, mean, and maximum higher than cut-off point value that can be due to blastic metastasis or existence of fibrous tissue in the metastases.
In this research, we added in/opposed phase image to conventional and diffusion sequences. We expressed the changes that occurred in the signal intensity of normal and abnormal marrow by SIR. SIR is the marrow mean signal intensity on the opposed phase to the marrow mean signal intensity on the in phase images. Using this formula, which was also used for other studies, we calculated a mean signal intensity ratio of 1.155 ± 0.183 for the metastatic group and 0.649 ± 0.341 for the benign group and 0.45 ± 0.113 for normal group. We found that SIR in the malignant lesions are definitely higher than normal and benign ones (Figures 3 and 4). These results were supported by Ogura et al. (14) and Tadros et al. (15), but differed from that reported by Geith et al. (16), who stated that the osteoporotic lesions showed hyperintense signal on opposed phase image. They founded no statistically significant difference in SI on the opposed-phase images of benign and malignant vertebral lesions. They reported a sensitivity of only 50% and a specificity of 88.5%. This disagreement might be due to this fact that an equal amount of fat and water is not always present in benign lesion because of edema. It results in more or less hyperintensity on the opposed-phase images.
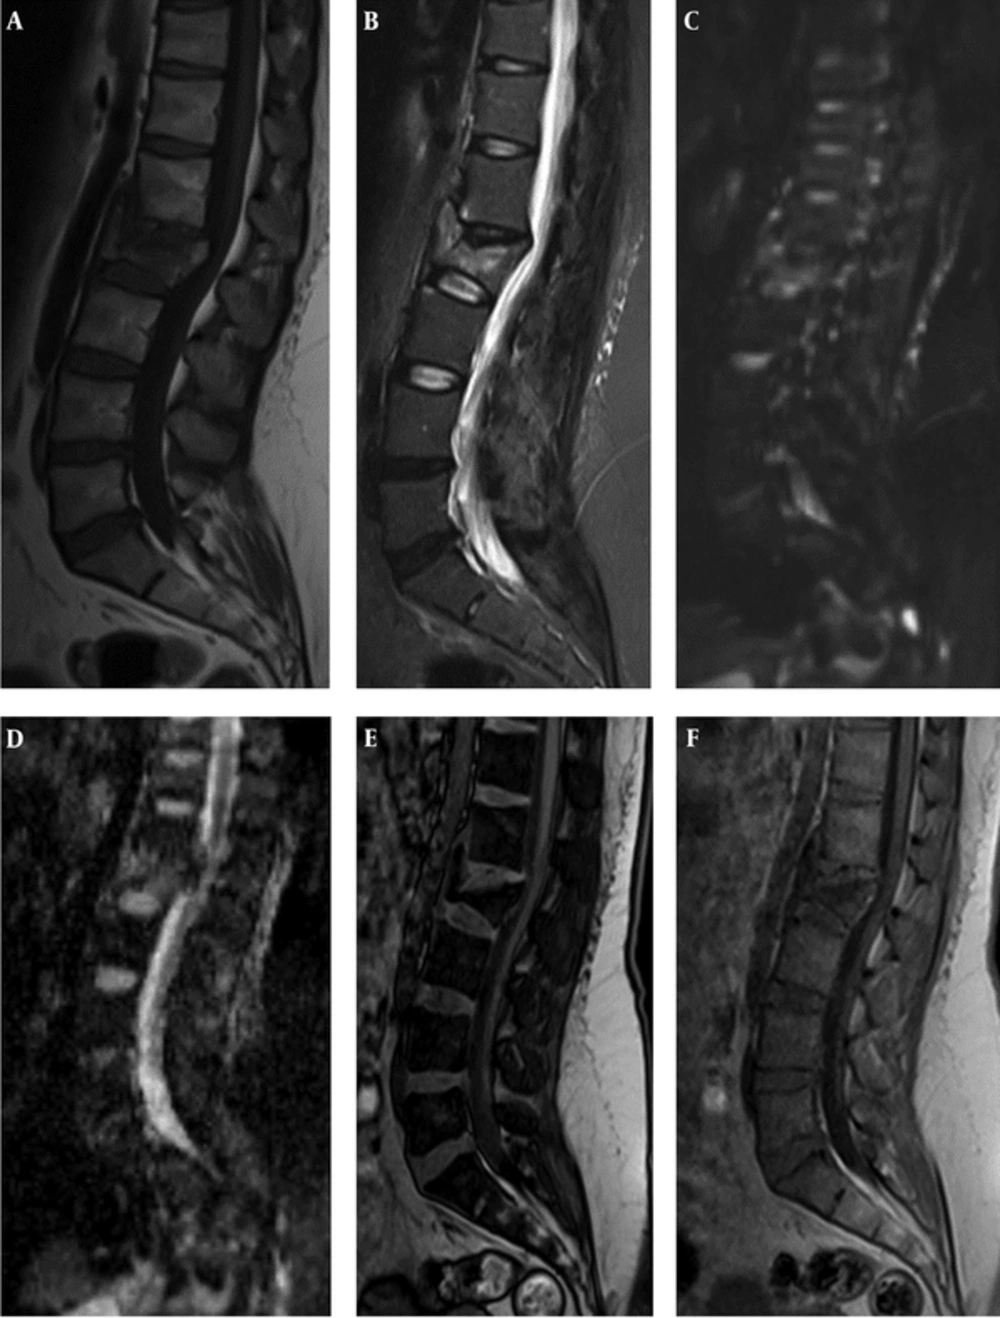
Figure 3.
Female patient with acute benign CF. A, B, C: (T1 and T2 WI and DWI) show traumatic fracture in L2 vertebral body. The lesion reveals low signal in T1 and high signal in STIR and DWI.D, E, F: (ADC map and out of phase and in phase) display high signal on ADC map with high min, mean ,max ADC values ( 0.67, 1.33 and 1.88 × 10⁻³ mm2/s) and low SIR (0.54).
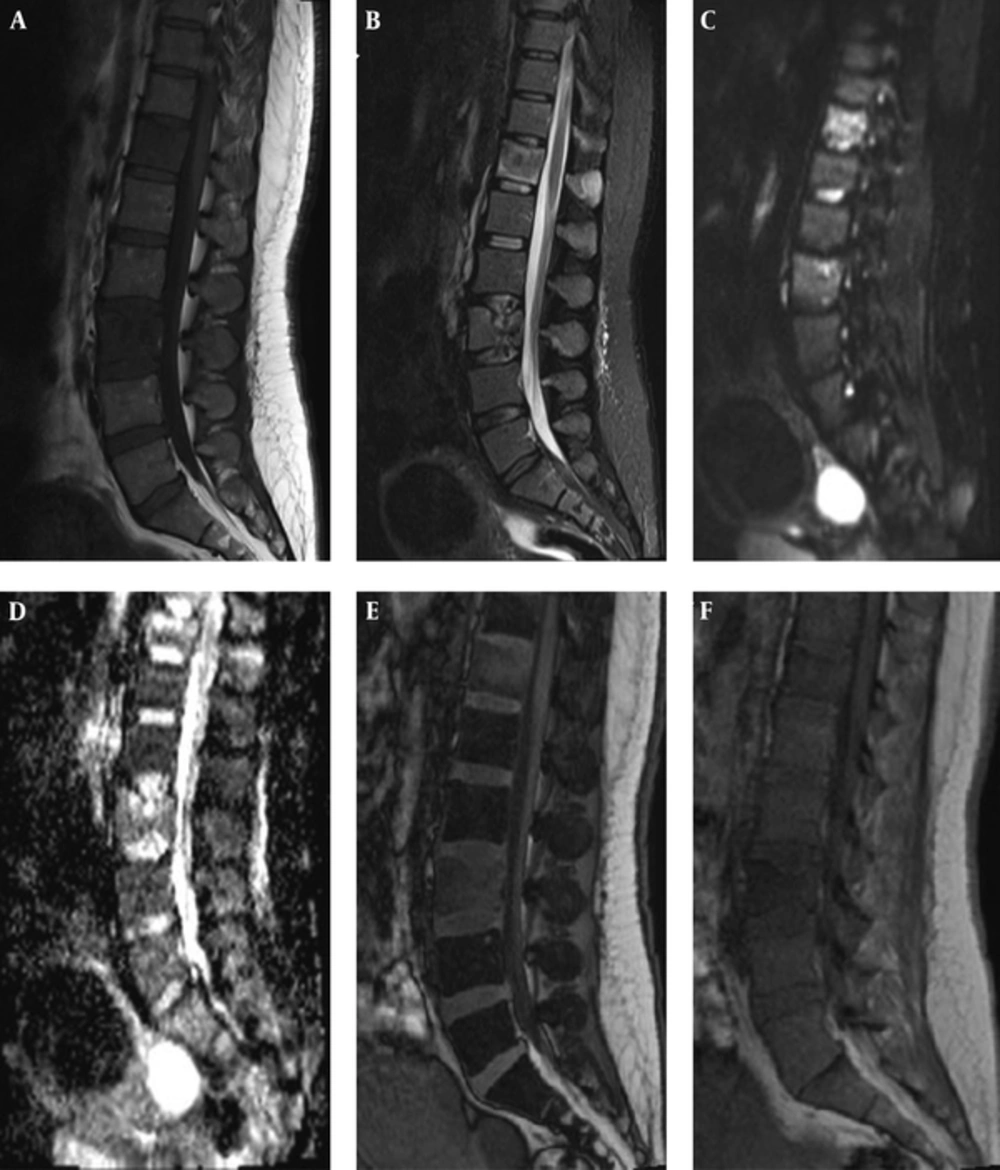
Figure 4.
Female patient, 43 years old with breast neoplasm. Metastatic CF in L3 and metastatic lesion in T12. A, Sagittal FSE T1 WI shows both lesions hypointense. B, C: (STIR and DWI) reveal the lesions hyperintense. D, ADC map display low ADC values. E, F: (opposed phase and in-phase) show high SIR (1.13 (L3) and 1.34 (T12)) that improve malignant nature of lesions.
Also, some overlap occurred in this study; 4 benign lesions had a ratio greater than 0.92 and 5 malignant lesions had a value less than 0.92; these results were in agreement with Zidan et al. (17) and Swartz et al. (18) The false-positive result may be due to massive bone marrow edema with abundant water that did not show signal dropout on opposed phase images. The false-negative results may be due to densely sclerotic metastasis that showed susceptibility artifact on opposed phase sequence or fat containing metastases.
Using ROC analysis, the optimal SIR cutoff value for separating benign and malignant lesions was found to be 0.92 which quite similar to Zidan, but less than the cutoff value of one reported by El-Samie et al. (14).
In the current study, an SIR cutoff value of 0.92 was able to differentiate benign and malignant lesions with 90.5% sensitivity, 88% specificity, and 92% accuracy. These results were in agreement with Zidan et al. (17), who reported 93% sensitivity and 82% specificity, and with Martel Vilagran et al. (10), who reported 97% sensitivity, 80.1% specificity, and 83.2% accuracy.
The results of this study showed that the sensitivity, specificity, and accuracy of diffusion weighted imaging almost were comparable to those calculated for chemical shift imaging.
4.1. Conclusions
Quantitative diffusion weighted and chemical shift MR imaging are effective non-invasive technique in differentiating benign from malignant vertebral bone marrow lesions, which provide additional information to the routine MRI sequences. These techniques have an important role in diagnosis, characterization, and differentiation of benign and malignant vertebral bone marrow lesions.