1. Background
Molecular subtype classification of breast cancers on the basis of gene expression profiling has proven useful for predicting prognosis, treatment options, and treatment responses (1, 2). However, gene expression profiling is not always available. Therefore, surrogate immunohistochemical classifications based on estrogen receptor (ER), progesterone receptor (PR), and/or human epidermal growth factor type 2 (HER2) expression statuses are used more widely (3). Currently, the commonly accepted molecular subtypes based on expression of these receptors are luminal A, luminal B, HER2-positive, and triple-negative (4).
In breast cancer, HER2 overexpression is associated with aggressive histological features and a poor prognosis (5). However, a previous report demonstrated that patients with HER2-positive breast cancer could achieve a high pathological complete response rate following trastuzumab-containing neoadjuvant chemotherapy (6, 7). An accurate molecular subtype diagnosis is therefore needed for the development of rational, individualized treatments.
Fluorine-18 fluorodeoxyglucose (F-18 FDG)-positron emission tomography/computed tomography (PET/CT) is widely used in most malignancy workups, including detection, differential diagnosis, staging and/or restaging, therapeutic decision-making, follow-up, and prognosis (8, 9). In breast cancer, FDG uptake has been found to correlate with tumor size, histological grade, proliferation index, and molecular subtype (10-13). However, very few studies have investigated the diagnostic performance of F-18 FDG-PET/CT-based predictions of molecular subtype.
2. Objectives
The aim of this study was to evaluate the usefulness of F-18 FDG-PET/CT for the prediction of breast cancer molecular subtype.
3. Patients and Methods
3.1. Patients
This retrospective study was approved by our institutional review board, and the requirement for written informed consent was waived. Ninety-nine consecutive patients with pathologically proven invasive breast carcinoma (IBC) underwent F-18 FDG-PET/CT imaging for preoperative tumor staging between January 2013 and October 2014. Thirty-three of the 99 patients were excluded from our cohort study because of the post-neoadjuvant chemotherapy status (n = 32) or post-splenectomy status (n = 1). The remaining 66 patients [mean age (± standard deviation), 58 ± 14.6 years; age range, 27 - 86 years] with 69 IBCs were included in our study. The interval between pathological diagnosis and subsequent F-18 FDG-PET/CT evaluation ranged from 1 to 75 days (mean, 22.0 ± 1.7 days).
3.2. F-18 FDG-PET/CT Imaging
Patients were instructed to fast for at least 5 hours prior to F-18 FDG-PET/CT acquisition. Blood glucose levels were measured before scanning and were < 200 mg/dL in all patients. All imaging was performed on a 16-section PET/CT scanner (Biograph Sensation 16; Siemens Medical Solutions, Erlangen, Germany) that comprised a 16-section high-performance multi-detector low CT scanner with a lutetium oxyortho-silicate-based PET scanner. Sixty minutes after the administration of F-18 FDG (mean dose, 3.9 ± 0.7 MBq/kg; range, 2.7 - 5.9 MBq/kg), whole-body CT (from vertex to pelvis) was initially performed primarily for attenuation correction during breath-holding in the midexpiration phase. The CT parameters were as follows: section width, 5 mm; table feed per rotation, 18 mm; rotation time, 0.5 seconds; tube voltage, 120 kVp; quality referenced mAs, 100 mAs in CARE Dose 4D; and field of view, 70 cm. Images were acquired for 2 minutes at each of eight bed positions (16.2 cm of axial field of view). Attenuation-corrected PET images were reconstructed from the CT data using a 3-D ordered subset expectation maximization algorithm (8 subsets, 3 iterations).
3.3. PET Image Analysis
A nuclear medicine physician (with 5 years of experience in the interpretation of PET images) who was unaware of the patients’ clinical information retrospectively reviewed all F-18 FDG-PET/CT images on a commercially-available dedicated digital imaging and communications in medicine (DICOM) viewer. The nuclear medicine physician measured the maximum standardized uptake value of the IBC (tumor SUVmax) by drawing a region-of-interest (ROI) that encompassed as much of the tumor area as possible. The tumor SUVmax was measured on axial images over the most intense area of F-18 FDG accumulation. Additionally, an elliptical ROI was drawn to encompass as much of the right hepatic lobe as possible on the axial images to measure the mean SUV of the liver. The mean SUV of the spleen was measured similarly. The tumor-to-liver SUV and tumor-to-spleen SUV ratios were calculated as ratios of the tumor SUVmax to the mean liver and spleen SUVs, respectively.
3.4. Histopathologic Analysis
ER, PR, and HER2 statuses were determined from the pathologic reports obtained during surgery (n = 56) or biopsy (n = 13). ER and PR statuses were considered positive if the Allred scores from immunohistochemical staining were ≥ 3 (14). The HER2 status was considered positive if the immunohistochemical stain score was 3+, or 2+ with fluorescence in situ hybridization (FISH)-proven HER2 gene amplification (15). IBCs were classified into four molecular subtypes according to the ER, PR, and HER2 status as follows (16): luminal A (ER positive and/or PR positive, HER2 negative), luminal B (ER positive and/or PR positive, HER2 positive), HER2-positive (ER negative, PR negative, and HER2 positive), and triple-negative (ER negative, PR negative, and HER2 negative).
3.5. Statistical Analysis
Statistical analyses were performed using MedCalc Software for Windows (version 14.12; MedCalc Software, Ostend, Belgium). The Kruskal-Wallis test was used to evaluate differences between the molecular subtypes in patient age, tumor size, mean SUVs of the liver and spleen, tumor SUVmax, tumor-to-liver SUV ratio, and tumor-to-spleen SUV ratio. When the Kruskal-Wallis test indicated a significant difference among the 4 molecular subtypes (P < 0.05), pairwise comparisons were performed using the Mann-Whitney test and a stricter P value < 0.0083, determined using the Bonferroni correction, was considered significant.
A stepwise logistic regression analysis was performed to detect each molecular subtype using the following parameters: tumor size, tumor SUVmax, tumor-to-liver SUV ratio, and tumor-to-spleen SUV ratio. In this analysis, molecular subtype was considered a binary variable with a value of 1 if an IBC belonged to the molecular subtype of interest and 0 if it belonged to any other molecular subtype.
An optimal cutoff value based on maximal sensitivity and specificity was identified for the detection of each molecular subtype, using the highest area under the receiver operating characteristic (ROC) curve. ROC curves were fitted to the cutoff value to compute the sensitivity, specificity, and area under the ROC curve (AUC) for the detection of each molecular subtype. We defined significance as a P value of less than 0.05.
A post-hoc power analysis was conducted to assess our statistical power by using commercially available software (G*Power, version 3.1.7; University of Duesseldorf, Duesseldorf, Germany) with an effect size of 0.25, a significance level of 5%, and a total sample size of 66 patients.
4. Results
4.1. Patient Background Factors and Tumor Characteristics
The patients’ background factors and tumor characteristics are summarized in Table 1. No significant differences in patient age (P = 0.60) were found between the four molecular subtypes. The 69 IBCs were classified according to molecular subtype as follows: luminal A, 53 (77%); luminal B, 6 (9%); HER2-positive, 6 (9%); and triple-negative, 4 (5%). The maximal IBC diameters ranged from 5 to 50 mm, with a mean of 19.3 ± 9.9 mm. The Kruskal-Wallis test detected a significant difference in tumor size (P = 0.002), although no significant differences were observed for the following pairwise comparisons conducted using the Mann-Whitney test with Bonferroni correction: P = 0.095 for luminal A versus luminal B, P = 0.0087 for luminal A versus HER2-positive, P = 0.0090 for luminal A versus triple-negative, P = 0.30 for luminal B versus HER2-positive, P = 0.20 for luminal B versus triple-negative, and P = 0.75 for luminal B versus HER2-positive.
Table 1.
Patient Background Factors and Tumor Characteristicsa
| Luminal A | Luminal B | HER2-Positive | Triple-Negative | P Value | |
|---|---|---|---|---|---|
| No. of patients | 50 | 6 | 6 | 4 | |
| No. of lesions | 53 | 6 | 6 | 4 | |
| Age, y | 58 ± 14.0 (27 - 83) | 55 ± 21.2 (33 - 86) | 65 ± 9.9 (48 - 78) | 58 ± 10.0 (33 - 82) | 0.60 |
| Tumor size, mm | 17.1 ± 9.0 (5 - 46) | 21.3 ± 6.6 (10 - 27) | 28.5 ± 11.9 (17 - 50) | 30.8 ± 9.9 (23 - 45) | 0.002b |
Abbrevoiation: HER2, human epidermal growth factor type 2.
aPatient age and tumor size are means ± 1 standard deviation with ranges in parentheses.
bThe Kraskal-Wallis test indicated a significant difference, but the following pairwise comparisons using the Mann-Whitney test and Bonferroni correction showed no significant difference between the four molecular subtypes.
4.2. Correlation Between SUV and Molecular Subtype
The mean SUVs of the liver and spleen, tumor SUVmax, tumor-to-liver SUV ratio, and tumor-to-spleen SUV ratio are summarized in Table 2. The mean tumor SUVmax (P = 0.0032), tumor-to-liver SUV ratio (P = 0.0036), and tumor-to-spleen SUV ratio (P = 0.0054) of the HER2-positive subtype were significantly greater than the corresponding values of the luminal A subtype (Figure 1). No significant differences were observed for the other pairwise comparisons (P = 0.016 - 0.98).
Table 2.
SUVmean of the Liver and Spleen, Tumor SUVmax, Tumor-to-Liver SUV Ratio, and Tumor-to-Spleen SUV Ratio of the Four Molecular Subtypesa
| Luminal A (n = 53) | Luminal B (n = 6) | HER2-Positive (n = 6) | Triple-Negative (n = 4) | P Value | |
|---|---|---|---|---|---|
| SUVmean of the liver | 2.8 ± 0.5 (2.0 - 4.2) | 2.7 ± 0.3 (2.5 - 3.3) | 2.6 ± 0.3 (2.2 - 2.9) | 2.6 ± 0.5 (2.2 - 3.3) | 0.76 |
| SUVmean of the spleen | 2.1 ± 0.4 (1.3 - 3.3) | 1.8 ± 0.1 (1.7 - 2.0) | 2.1 ± 0.2 (1.9 - 2.3) | 2.0 ± 0.1 (1.9 - 2.0) | 0.14 |
| Tumor SUVmax | 4.4 ± 3.0 (0.5 - 11.4) | 4.2 ± 3.0 (1.0 - 9.9) | 10.1 ± 4.9b (4.9 - 17.6) | 5.5 ± 0.8 (4.3 - 7.8) | 0.013 |
| Tumor-to-liver SUV ratio | 1.6 ± 1.1 (0.2 - 4.1) | 1.6 ± 1.2 (0.4 - 3.9) | 3.9 ± 1.9b (1.7 - 6.7) | 2.1 ± 0.2 (1.9 - 2.3) | 0.012 |
| Tumor-to-spleen SUV ratio | 2.2 ± 1.5 (0.2 - 5.5) | 2.4 ± 1.9 (0.6 - 5.6) | 4.9 ± 2.6b (2.3 - 8.9) | 2.8 ± 0.7 (2.3 - 3.8) | 0.02 |
Abbreviation: HER2, human epidermal growth factor type 2; SUV, standardized uptake value.
aValues are expressed as means ± 1 standard deviation with ranges in parentheses.
bValue was significantly greater (P < 0.0083) than those with luminal A by the Mann-Whitney test and Bonferroni correction.
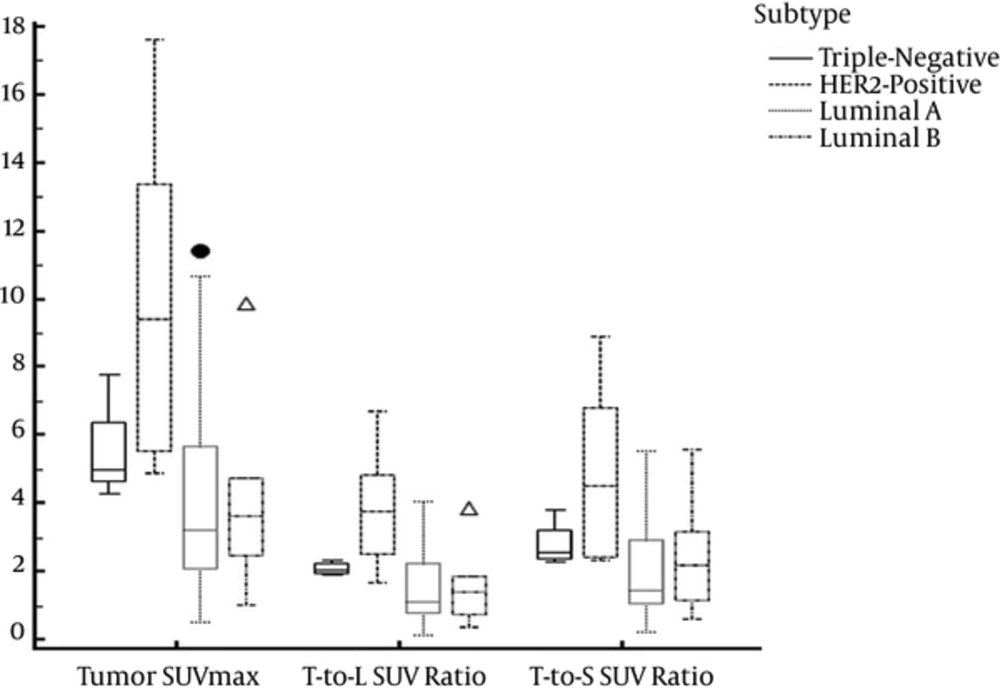
Figure 1.
Box plot indicating the tumor maximum standard uptake value (SUVmax) and tumor-to-liver and spleen SUV ratios for four molecular subtypes. The mean tumor-to-liver SUV ratio was greater for the HER2-positive subtype than for the luminal A subtype (P = 0.0036). The boundaries of the boxes closest to zero represent the 25th percentiles, lines in the boxes indicate the medians, boundaries of boxes farthest from zero represent the 75th percentiles, the error bars denote the smallest and largest values of 1.5 box lengths of the 25th and 75th percentiles, and dots indicate the outliers.
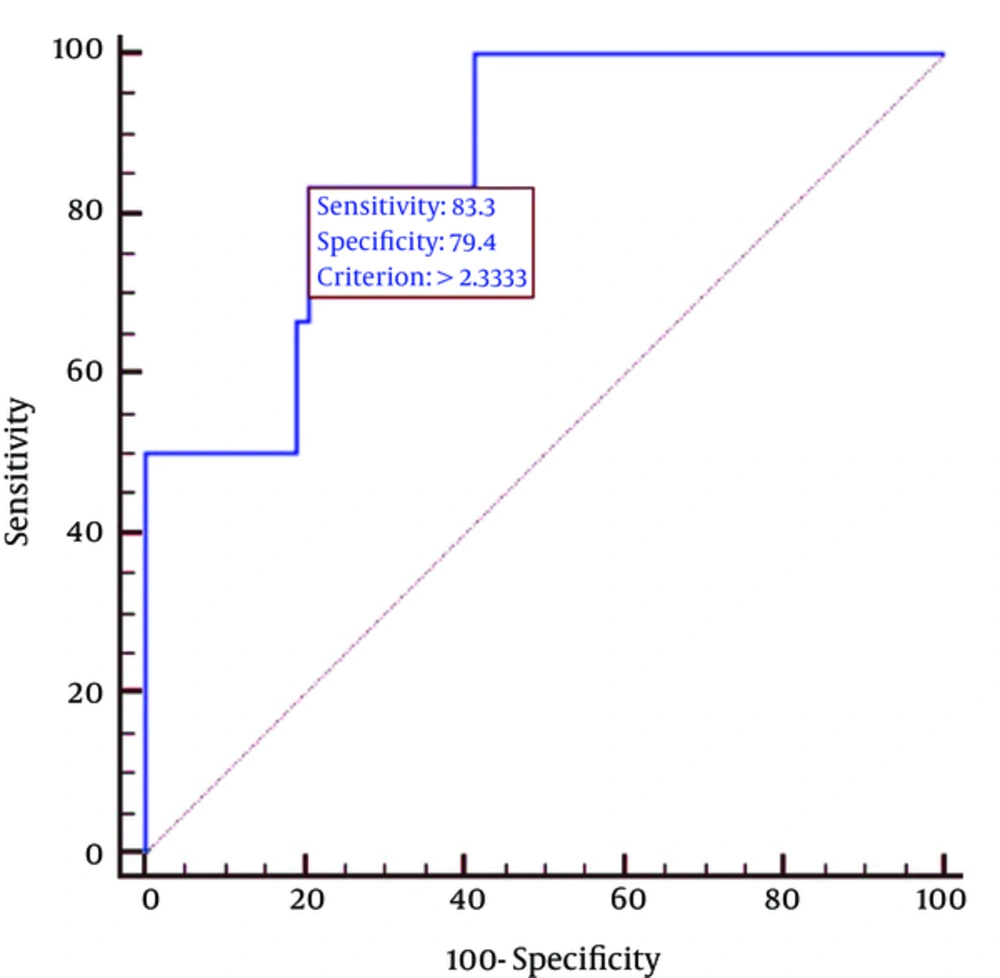
Figure 2.
Receiver operating characteristic curve for detection of HER2-positive subtype. The area under the curve (AUC) for the detection of the HER2-positive subtype using the tumor-to-liver standard uptake value (SUV) ratio was 0.87.
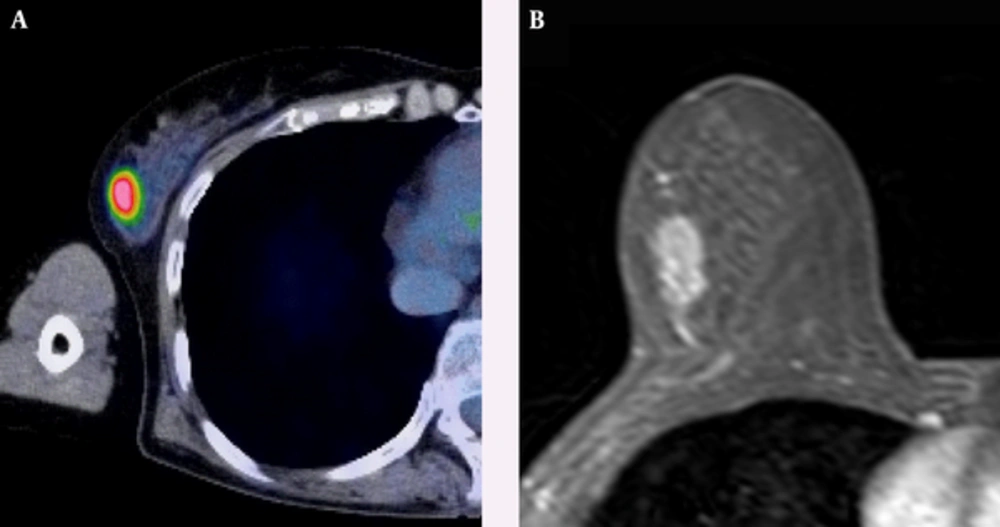
Figure 3.
A 63-year-old woman with HER2-positive subtype breast cancer. A, Axial F-18 positron emission tomography/computed tomography (PET/CT) and B, Dynamic contrast-enhanced MR images show intense Fluorine-18 fluorodeoxyglucose (F-18 FDG) uptake (tumor maximum standard uptake value (SUVmax): 8.25, and tumor-to-liver SUV ratio: 2.93) in a 17-mm right breast mass confirmed to be an invasive ductal carcinoma.
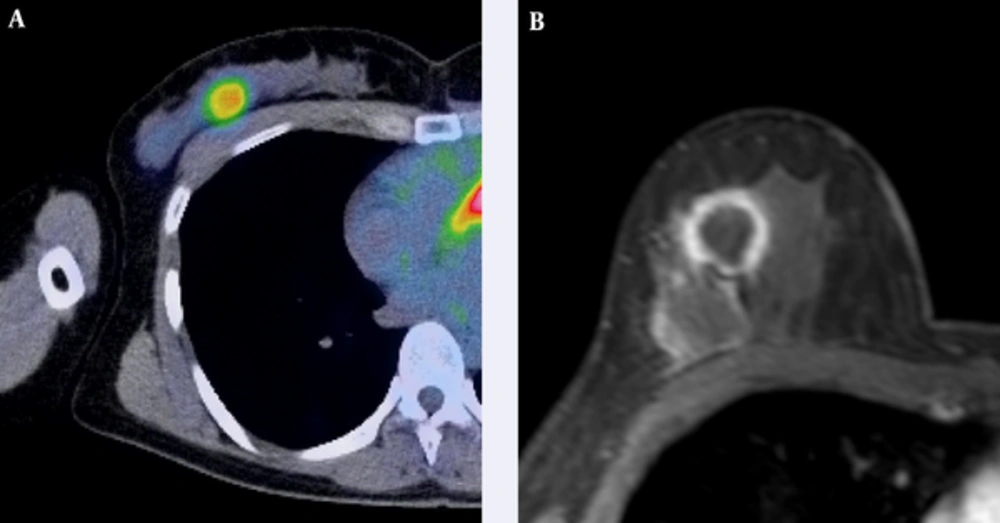
Figure 4.
A 52-year-old woman with triple-negative subtype breast cancer. A, Axial F-18 positron emission tomography/computed tomography (PET/CT) and B, Dynamic contrast-enhanced MR images show intense Fluorine-18 fluorodeoxyglucose (F-18 FDG) uptake (tumor maximum standard uptake value (SUVmax): 4.31, tumor-to-liver SUV ratio: 1.93) in a 25-mm right breast mass that was confirmed as an invasive ductal carcinoma.
The tumor-to-liver SUV ratio correlated independently with the HER2-positive subtype (P = 0.0049), whereas no correlations were observed between independent factors and other subtypes. Therefore, we focused our detailed analysis on the relationship between the tumor-to-liver SUV ratio and the HER2-positive subtype.
The sensitivity and specificity of the tumor-to-liver SUV ratio for detection of the HER2-positive subtype were 83% and 79%, respectively, when employing a cutoff value of 2.33. The AUC for detection of the HER2-positive subtype was 0.87 (95% confidence interval (CI), 0.76 - 0.94) when using the tumor-to-liver SUV ratio (Figure 2). Representative F-18 FDG-PET/CT and magnetic resonance (MR) images of HER2-positive and triple-negative subtype tumors are illustrated in Figures 3 and 4, respectively. Our sample size of 66 patients was sufficient to show a 5% difference with a 35% power.
5. Discussion
The local recurrence and distant metastasis rates and mortality rate are higher among patients with HER2-positive and triple-negative subtype tumors, compared to those with luminal A and B subtype tumors (17). Previous studies have correlated F-18 FDG uptake with histopathologic grade, tumor size, and the hormonal receptor expression status, all of which are important prognostic factors for the long-term survival of patients with breast cancer (18-20). Notably, HER2-positive and triple-negative subtype tumors have a significantly higher mean SUVmax, compared with luminal A and B subtype tumors (21).
In a previous study, the mean SUVmax of triple-negative subtype tumors was greater than that of HER2-positive subtype tumors (22). However, in our study, the mean tumor-to-liver SUV ratio of HER2-positive subtype tumors was significantly greater than that of luminal A subtype tumors and greater than those of other subtypes, although those differences were not significant. On dynamic contrast-enhanced MR imaging, triple-negative subtype tumors tend to exhibit rim enhancement. The presence of a fibrotic focus in the center of an invasive breast cancer, regardless of necrosis, is associated with tumor metastasis and mortality (23, 24). In our study population, we included four patients with triple-negative subtype tumors. Of these four patients, three (75%) exhibited rim enhancement on dynamic contrast-enhanced MR imaging. We believed that the SUV of triple-negative subtype tumors with a fibrotic focus, regardless of necrosis, might be lower than that of HER2-positive subtype tumors.
In our study, we used the tumor-to-liver SUV and tumor-to-spleen SUV ratios in addition to the tumor SUVmax. The liver and spleen represent organs with high reticuloendothelial system activity. Reticuloendothelial system cells, including phagocytic cells, primary macrophages, and Kupffer cells phagocytose and thus remove dying cells, debris, and malignant cells (25). The mean SUVs of the liver and spleen tend to be greater in patients with viable malignant tumors (26). In our study, the mean liver SUV was slightly lower among HER2-positive and triple-negative subtype tumors than among luminal A and B subtype tumors, although this difference was not significant. According to a stepwise logistic regression analysis, although tumor SUVmax was not a significant parameter with regard to the discrimination of each molecular subtype, the tumor-to-liver SUV ratio correlated independently with the HER2-positive subtype. Notably, the use of the tumor SUVmax alone led to a considerable overlap among the four subtypes.
Our study had several limitations. First, this was a retrospective study with a relatively small sample size, which might have potentially caused selection bias because a post hoc power analysis showed a power of 35%. Further clinical studies involving larger sample sizes may be needed to validate our preliminary results. Second, we included small tumors in our study. The SUVmax of a small tumor may be underestimated because of the partial volume effect (27). In our study, however, all IBCs exhibited positive F-18 FDG uptake, regardless of tumor size. Finally, we only evaluated F-18 FDG uptake when detecting each molecular subtype. However, other prognostic factors, including clinical stage, axillary lymph node involvement, distant metastasis, histologic grade, and nuclear grade, might also contribute to the wide variability in the outcomes of patients with IBCs.
In summary, our study demonstrated a significant correlation between the tumor-to-liver SUV ratio and HER2-positive subtype breast cancer. The tumor-to-liver SUV ratio appears to be a valuable index for identifying the HER2-positive subtype, thus supporting the potential of F-18 FDG-PET/CT as an imaging biomarker that could help to guide the clinical management of patients with breast cancer.