


1. Background
2. Objectives
3. Patients and Methods
3.1. Research Design Type
3.2. Sample Size Calculation
3.3. Sampling Method
3.4. Clinical Data
3.5. Study Methods
3.5.1. Spontaneous Breathing Trial (SBT)
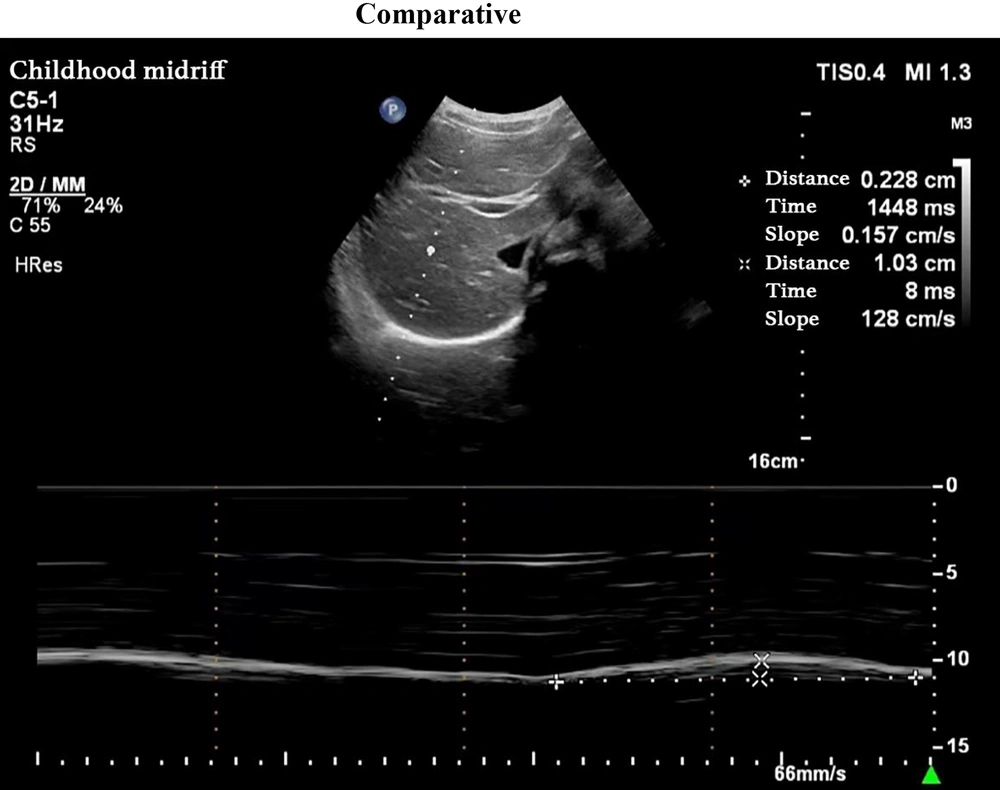
Measurement of diaphragm excursion; probe position: The low frequency convex array probe (1 - 5 MHz) was placed under the right clavicular midline and costal margin, with the liver as the acoustic window; measurement method: The B-mode was used to determine where the diaphragm displacement was the largest, and the M-mode was switched. The sampling line was perpendicular to the diaphragm, and the displacement curve of the diaphragm with breathing was recorded; figure meaning: The highest point of the curve represents the position of the diaphragm at the end of inspiration, the lowest point represents the position of the diaphragm at the end of expiratory breath, and the distance between the two is the diaphragm excursion.
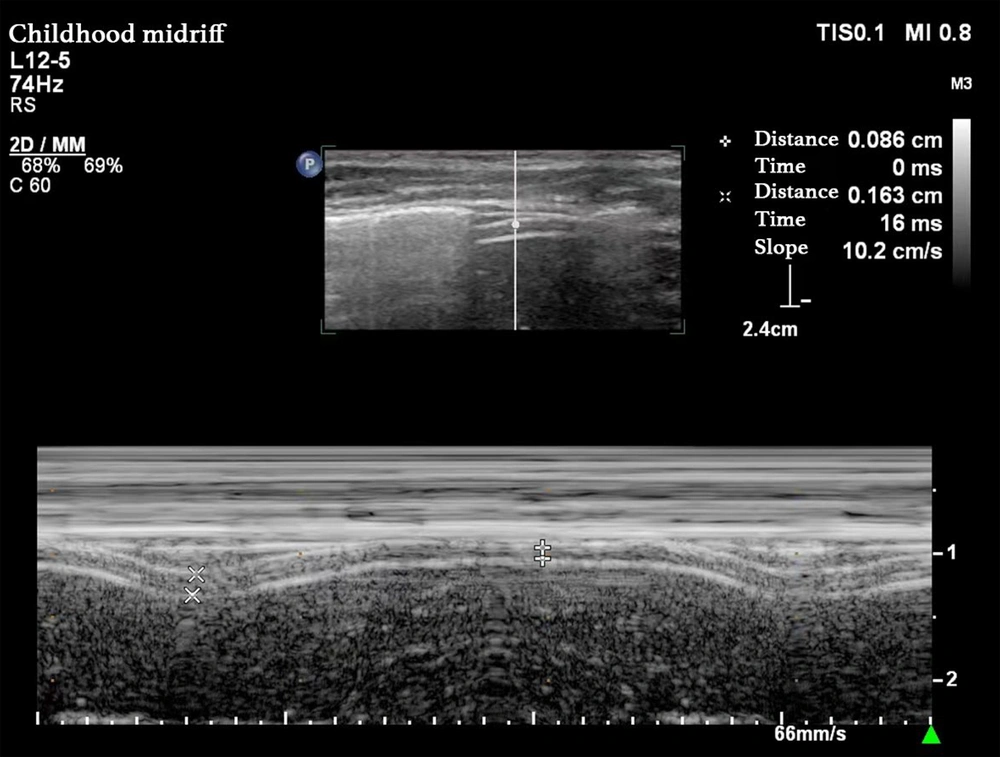
Measurement of diaphragm thickness; probe position: The high-frequency linear array probe (3 - 12 MHz) was placed in the area between the right midaxillary line and the 8 - 10 ribs, with the liver as the sound window; measurement methods: The B-type mode was used to obtain the high-low-three-layer echo structure of the diaphragm, and the M-type mode was switched. The sampling line was perpendicular to the diaphragm, and the curve of the thickness of the diaphragm with breathing was recorded; figure meaning: The two high echo lines represent the parietal pleural line and the peritoneal line respectively, and the low echo area in the middle is the diaphragm. The end expiratory thickness (Tee) was the minimum diaphragm thickness, and the end inspiratory thickness (Tei) was the maximum diaphragm thickness.
3.6. Statistical Analysis
4. Results
4.1. Comparison of Diaphragmatic Parameters Between the Control Group and the Mechanical Ventilation Group
| Ultrasound Parameters | Normal Control Group (n = 40) | MV Group (n = 60) | t/χ2 | P-Value |
|---|---|---|---|---|
| Age | 3.45 ± 1.87 | 2.45 ± 1.25 | -1.56 | > 0.05 |
| Gender (male/female) | 25/15 | 35/25 | 0.56 | > 0.05 |
| BMI (kg/m2) | 18.11 ± 2.56 | 17.56 ± 2.35 | -1.02 | > 0.05 |
| DE (mm) | 12.12 ± 1.82 | 10.24 ± 2.98 | 5.342 | < 0.05 |
| Tei (mm) | 2.32 ± 0.15 | 1.67 ± 2.23 | 8.856 | < 0.05 |
| Tee (mm) | 1.71 ± 0.14 | 1.29 ± 0.16 | 6.342 | < 0.05 |
| DTF (%) | 33.21 ± 2.34 | 26.57 ± 6.89 | 4.537 | < 0.05 |
| DE-RSB [breaths/(min.mm)] | 1.78 (1.34, 2.26) | 2.89 (2.34, 3.65) | 5.648 | < 0.05 |
| DTF-RSBI (breaths/min) | 64.34 (61.23, 72.24) | 89.13 (76.86, 113.56) | 5.753 | < 0.05 |
Abbreviations: MV, mechanical ventilation; BMI, Body Mass Index; DE, diaphragm excursion; Tei, diaphragmatic end-inspiratory thickness; Tee, diaphragmatic end-expiratory thickness; DTF, diaphragm thickening fraction; DE-RSBI, diaphragm excursion-rapid shallow breathing index; DTF-RSBI, diaphragm thickening fraction-rapid shallow breathing index.
a Values expressed as mean ± SD, median (25th percentile, 75th percentile) or number.
4.2. Comparison of General Data Between the Successful and Failed Weaning Groups
| General Data | Successful Weaning Group (n = 39) | Failed Weaning Group (n = 21) | χ2/t/F | P-Value |
|---|---|---|---|---|
| Age | 1.58 (0.75, 5.92) | 2.33 (0.41, 6.58) | 0.145 | > 0.05 |
| BMI (kg/m2) | 17.23 ± 2.34 | 17.89 ± 3.23 | 0.145 | > 0.05 |
| Gender | ||||
| Male | 23 | 12 | 0.019 | > 0.05 |
| Female | 16 | 9 | ||
| Machine ventilation reason | > 0.05 | |||
| Severe pneumonia | 4 (10.25) | 3 (14.29) | ||
| Acute laryngitis | 3 (7.69) | 2 (9.52) | ||
| Acute asthma attack | 3 (7.69) | 2 (9.52) | ||
| Airway foreign body obstruction | 3 (7.69) | 1 (4.76) | ||
| Central nervous system disease | 6 (15.38) | 1 (4.76) | ||
| Accidental injury | 7 (17.94) | 4 (19.05) | ||
| Postoperative thoracic and cardiac surgery | 5 (12.82) | 4 (19.05) | ||
| Cardiopulmonary resuscitation | 5 (12.82) | 2 (9.52) | ||
| Other | 3 (7.69) | 2 (9.52) | ||
| MV duration (d) | 5 (3, 7) | 12 (5, 14) | 4.234 | < 0.05 |
| Total hospital stay (d) | 11 (4, 14) | 23 (14, 29) | 5.234 | < 0.05 |
Abbreviations: BMI, Body Mass Index; MV, mechanical ventilation.
a Values expressed as mean ± SD, median (25th percentile, 75th percentile) or No. (%).
4.3. Comparison of Diaphragmatic Ultrasound Parameters Between Successful and Failed Weaning Groups
| Ultrasound Parameters | Successful Weaning Group (n = 39) | Failed Weaning Group (n = 21) | t | P-Value | Cohen's d |
|---|---|---|---|---|---|
| DE (mm) | 9.23 ± 1.93 | 5.74 ± 1.34 | 5.342 | < 0.05 | 1.81 |
| Tei (mm) | 1.79 ± 0.16 | 1.73 ± 0.19 | 0.936 | > 0.05 | - |
| Tee (mm) | 1.45 ± 0.14 | 1.39 ± 0.15 | 0.631 | > 0.05 | - |
| DTF (%) | 29.34 ± 5.74 | 21.45 ± 6.04 | 3.153 | < 0.05 | 1.34 |
| DE-RSBI [breaths/(min.mm)] | 2.86 ± 0.35 | 4.78 ± 1.35 | 4.259 | < 0.05 | - |
| DTF-RSBI (breaths/min) | 92.34 ± 31.34 | 132.34 ± 60.23 | 3.682 | < 0.05 | - |
Abbreviations: DE, diaphragm excursion; Tei, diaphragmatic end-inspiratory thickness; Tee, diaphragmatic end-expiratory thickness; DTF, diaphragm thickening fraction; DE-RSBI, diaphragm excursion-rapid shallow breathing index; DTF-RSBI, diaphragm thickening fraction-rapid shallow breathing index.
a Values are expressed as mean ± SD.
4.4. Predictive Efficacy of Diaphragmatic Parameters
| Ultrasound Parameters | Cut-Off Point | AUC | Upper- Lower Limit; 95% CI | Sensitivity (%) | Specificity (%) |
|---|---|---|---|---|---|
| DE (mm) | 10.2 | 0.882 | 0.780 - 0.975 | 81.23 | 88.12 |
| Tei (mm) | 1.9 | 0.443 | 0.268 - 0.613 | 42.26 | 61.26 |
| Tee (mm) | 1.4 | 0.487 | 0.313 - 0.659 | 44.19 | 65.62 |
| DTF (%) | 28.5 | 0.723 | 0.559 - 0.861 | 68.23 | 76.78 |
| DE-RSBI breaths/(min.mm) | 2.4 | 0.810 | 0.663 - 0.952 | 67.78 | 85.26 |
| DTF-RSBI (breaths/min) | 78.3 | 0.752 | 0.562 - 0.884 | 68.16 | 80.04 |
Abbreviations: AUC, area under the curve; CI, confidence interval; DE, diaphragm excursion; Tei, diaphragmatic end-inspiratory thickness; Tee, diaphragmatic end-expiratory thickness; DTF, diaphragm thickening fraction; DE-RSBI, diaphragm excursion-rapid shallow breathing index; DTF-RSBI, diaphragm thickening fraction-rapid shallow breathing index.
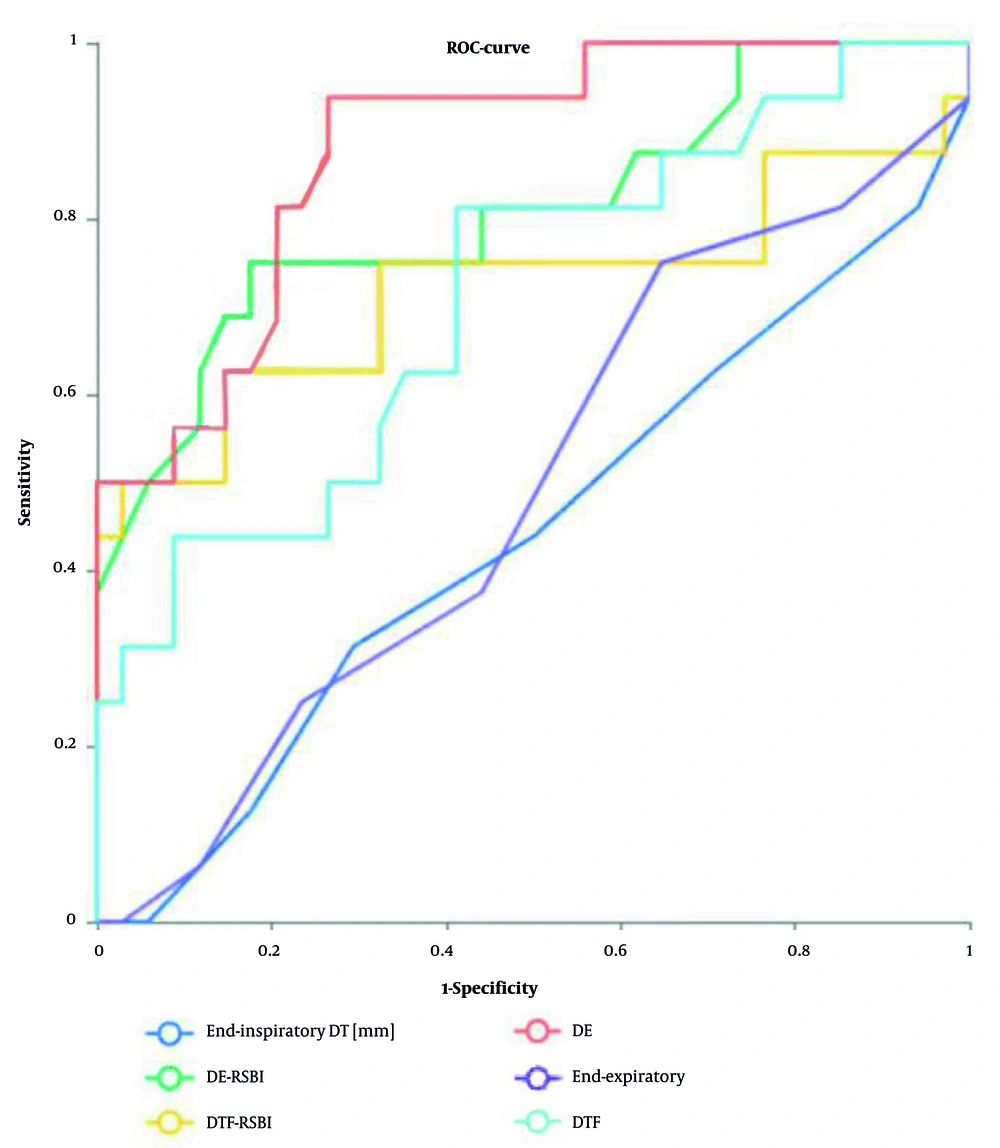
Predictive Efficacy of diaphragm ultrasound parameters on withdrawal Results (ROC curve); curve meaning: ROC curves of DE, DTF, diaphragmatic excursion to rapid shallow breathing index (DE-RSBI), and diaphragmatic thickening fraction to rapid shallow breathing index (DTF-RSBI) are shown in the figure to predict withdrawal results; Area under the curve (AUC) : The AUC of DE is 0.882, the AUC of DTF is 0.723, the AUC of DE-RSBI is 0.810 and the AUC of DTF-RSBI is 0.725; truncation value: The best truncation value for DE is 8.5 mm, and the best truncation value for DTF is 25%.


