


1. Background
2. Objectives
3. Patients and Methods
3.1. Study Design, Patients and Data Collection
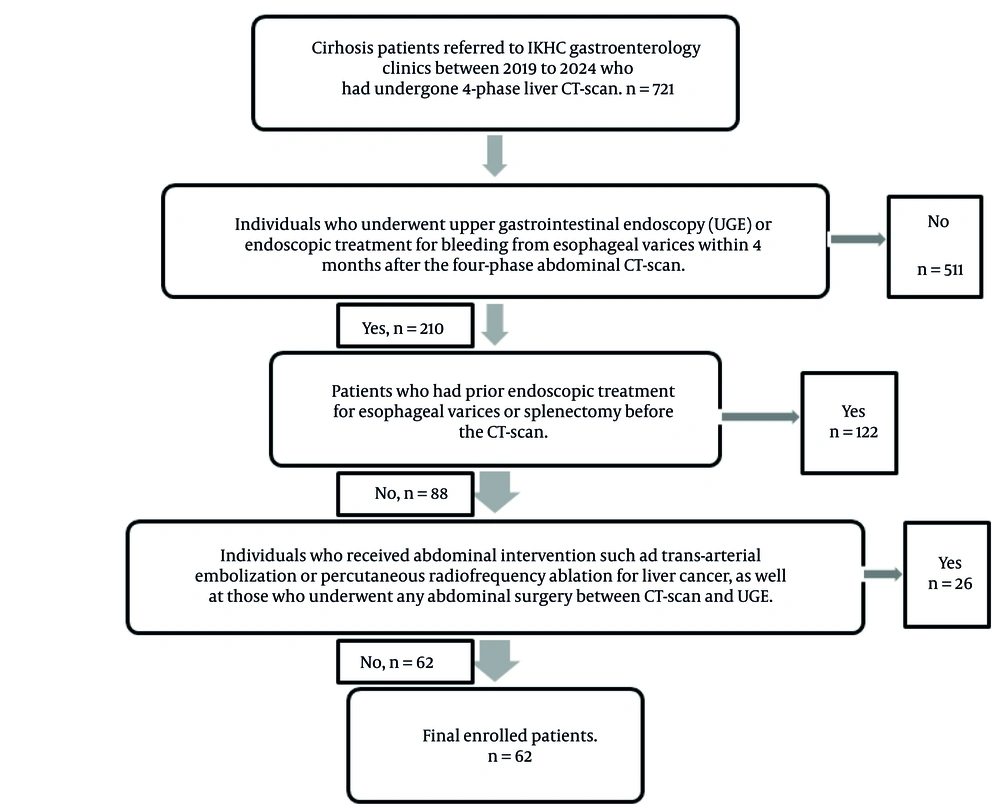
Patient’s enrollment
3.2. Liver, Spleen, and Pancreas Computed Tomography Protocol and Administration of Contrast
3.3. Measurements
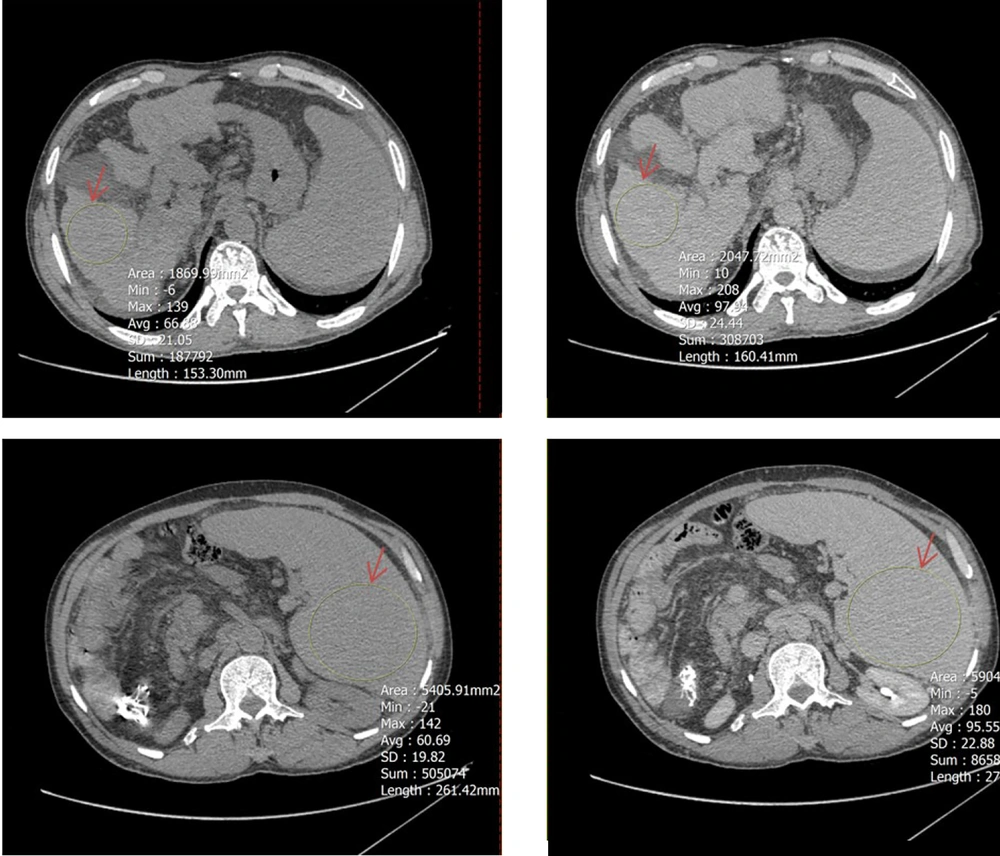
A circular region of interest (ROI, indicated by red arrows) was placed as large as possible on axial computed tomography (CT) images in both noncontrast (left) and equilibrium (right) phases. The upper panels show ROI placement in the right hepatic lobe at the level of the porta hepatis, while the lower panels demonstrate ROI positioning within the spleen at its maximum cross-sectional area, excluding visible vessels and focal lesions.
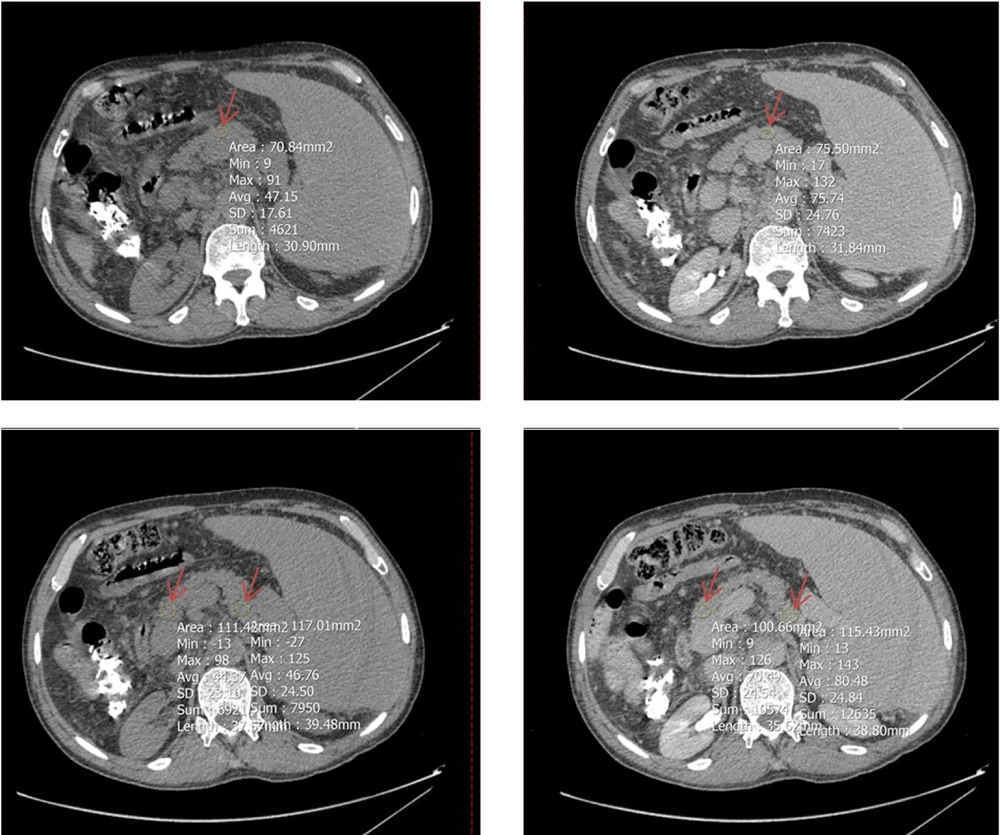
A circular region of interest (ROI, indicated by red arrow) was positioned as large as possible on Axial computed tomography (CT)-scan images (left: Non-contrast phases, right: Equilibrium phases) at three segments of the pancreas: Head and tail (two lower images) and body (two upper images); the average HU value from these parts was used to represent the entire organ.
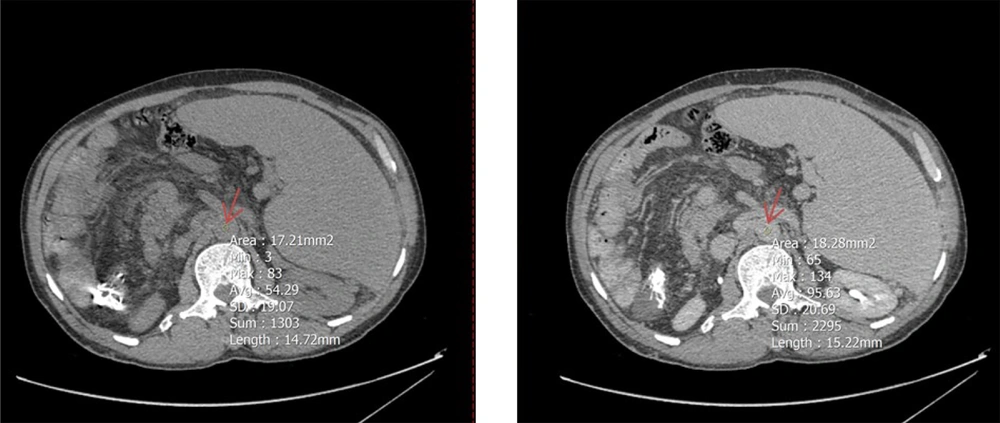
A circular region of interest (ROI, 15 mm in diameter; indicated by red arrow) was placed at the center of the abdominal aorta at the level of the renal artery origin on axial computed tomography (CT) images. The left panel corresponds to the noncontrast phase, and the right panel depicts the equilibrium phase.
3.4. Statistical Analysis
4. Results
| Variables | HRG (n = 35) | NHRG (n = 27) | OR (95% CI) | Cohen's d (95% CI) | Invariable | Multivariable |
|---|---|---|---|---|---|---|
| P-value | ||||||
| Age | 50.7 ± 11.1 | 49.6 ± 12.2 | - | 0.09 (-0.41 to 0.59) | NS | - |
| Gender (M/F) | 23/12 | 16/11 | 1.3 (0.5 - 3.7) | - | NS | - |
| CPS: A/B/C | 0/12/23 | 5/11/11 | 1.9 (1.4 - 3.8) | 0.015 | 0.012 | |
| MELDS | 21.6 ± 4.9 | 20.5 ± 6.4 | - | 0.19 (-0.31 to 0.69) | NS | - |
| Liver ECV | 42.3 ± 5.1 | 34.9 ± 3.3 | - | -0.18 (-0.69 to 0.32) | NS | - |
| Spleen ECV | 44.4 ± 5.1 | 34.9 ± 3.3 | - | 2.14 (1.51 to 2.76) | 0.001 | 0.001 |
| Pancreas ECV | 40.1 ± 12.6 | 43.1 ± 11.9 | - | -0.24 (-0.74 to 0.27) | NS | - |
| Spleen Volume | 38.3 ± 8.3 | 22.7 ± 4.7 | - | 0.77 (0.24 to 1.29) | 0.001 | NS |
| PVD | 13.7 ± 4.4 | 13.3 ± 2.8 | - | 0.13 (-0.38 to 0.63) | NS | - |
| SVD | 10.9 ± 5.2 | 10.2 ± 4.7 | - | 0.29 (-0.22 to 0.79) | NS | - |
| SMVD | 13 ± 2.7 | 12.3 ± 2.2 | - | 0.14 (-0.37 to 0.64) | NS | - |
| SRC (P/N) | 25/10 | 16/11 | 1.7 (0.6 - 4.9) | - | NS | - |
| IPS (P/N) | 3/32 | 2/25 | 1.2 (0.2 - 7.6) | - | NS | - |
| DV-CT (P/N) | 35/0 | 14/13 | 0.3 (0.2 - 0.5) | - | 0.001 | 0.003 |
Abbreviations: HRG, high-risk variceal group; NHRG, non-high-risk variceal group; NS, not significant; M/F, male/female; HCV/HBV, hepatitis C virus/hepatitis B virus; CPS, Child-Pugh score; MELDS, model for End-Stage liver diseases score; ECV, extracellular volume fraction; PVD, portal vein diameter (mm); SVD, splenic vein diameter (mm); SMVD, superior mesenteric vein diameter (mm); SRC, splenorenal collaterals; IPS,intrahepatic portosystemic shunt; DV-CT, direct visualization of esophago-gastric varices on portal phase CT; P/N, positive/negative; OR, odds ratio.
| Step | Parameter | Action | Chi-square LR | P-value | R2 | AIC | BIC | 95%CI |
|---|---|---|---|---|---|---|---|---|
| 1 | Spleen ECV | Entered | 22.5 | 0.001 | 0.537 | 50.7 | 59.3 | -0.06 , -0.02 |
| 2 | DV-CT | Entered | 5.9 | 0.003 | 0.586 | 33.8 | 42.2 | 0.13, 0.61 |
| 3 | CPS | Entered | 5.5 | 0.012 | 0.626 | 32.2 | 38.5 | -0.29, -0.03 |
Abbreviations: LR, likelihood ratio; AIC, akaike information criterion; BIC, bayesian information criterion; CI, confidence interval; ECV, extracellular volume.
| Statistics | Value | 95% confidence interval (lower-upper) |
|---|---|---|
| AUC | 0.984 | 0.896 - 1 |
| Sensitivity (%) | 91.4 | 76.9 - 98.2 |
| Specificity (%) | 88.9 | 70.8 - 97.7 |
| PPV (%) | 92.4 | 78.5 - 96.9 |
| NPV (%) | 95.6 | 72.9 - 95.9 |
| Accuracy (%) | 90.3 | 80.2 - 96.4 |
| Prevalence (%) | 56.5 | 43.3 - 69.1 |
Abbreviations: AUC, area under curve; PPV, positive predictive value; NPV, negative predictive value.
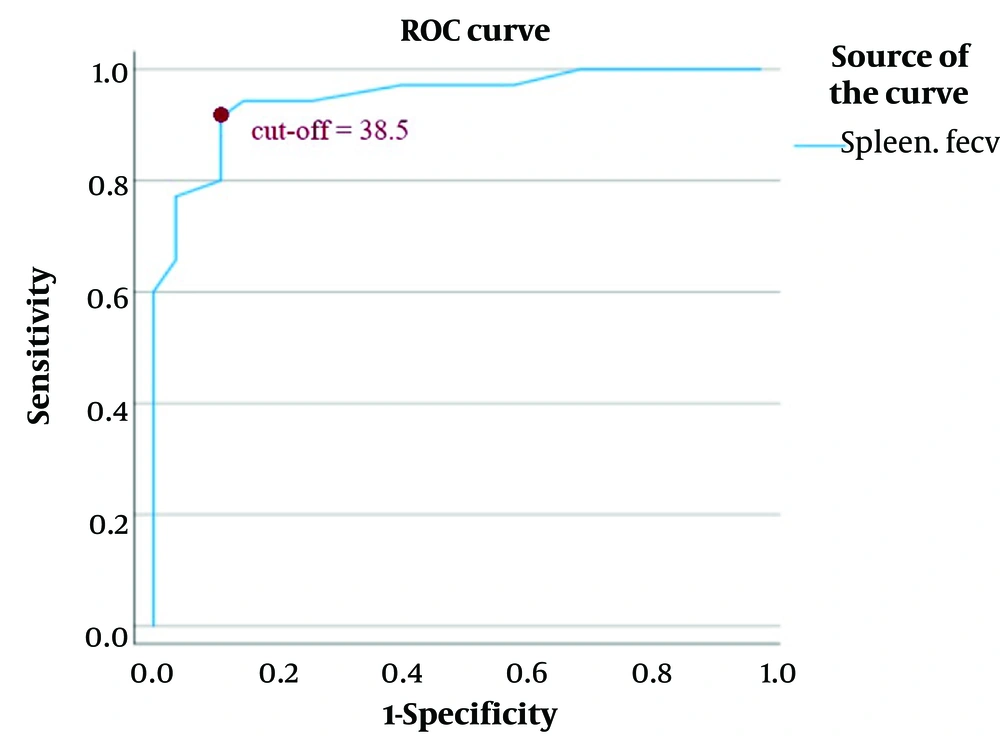
Regions of interest (ROIs) curve of spleen extracellular volume (ECV); the optimal cut-off value for splenic ECV (also referred to as fractional ECV or ECV) was identified as 38.5, yielding a sensitivity of 91.4% and a specificity of 88.9%. The positive predictive value was 92.4%, and the negative predictive value was 95.6%. The area under the receiver operating characteristic curve (AUC) was 0.948 (95% CI: 0.896 - 1.000). A direct association was observed between higher splenic ECV values and increased risk of esophageal varices.


