I J Radiol

Image Credit:I J Radiol

Anatomical Variations of the Canalis Sinuosus in the Anterior Maxilla: A Cone-Beam Computed Tomography Study

Author(s):
Solmaz ValizadehSolmaz ValizadehSolmaz Valizadeh ORCID1, Mitra Ghazizadeh AhsaieMitra Ghazizadeh Ahsaie1, Hadis AhmadvandHadis Ahmadvand2, S. Marjan ArianezhadS. Marjan Arianezhad3,*
1Department of Oral and Maxillofacial Radiology, School of Dentistry, Shahid Beheshti University of Medical Sciences, Tehran, Iran
2School of Dentistry, Shahid Beheshti University of Medical Sciences, Tehran, Iran
3Department of Oral and Maxillofacial Radiology, School of Dentistry, Shahed University of Medical Sciences, Tehran, Iran

IJ Radiology:Vol. 22, issue 4; e166836
Published online:Oct 31, 2025
Article type:Research Article
Received:Jun 24, 2025
Accepted:Oct 26, 2025
How to Cite:Valizadeh S, Ghazizadeh Ahsaie M, Ahmadvand H, Arianezhad SM. Anatomical Variations of the Canalis Sinuosus in the Anterior Maxilla: A Cone-Beam Computed Tomography Study. I J Radiol. 2025;22(4):e166836. doi: https://doi.org/10.5812/iranjradiol-166836

Abstract

Background:

The canalis sinuosus (CS) is an intraosseous canal transmitting the anterior superior alveolar neurovascular bundle. Despite its clinical significance, it is often overlooked.

Objectives:

This study aimed to evaluate the diameter, location, and distances of the CS relative to adjacent structures using cone-beam computed tomography (CBCT).

Patients and Methods:

This retrospective cross-sectional study analyzed 580 CBCT scans. Multiplanar reconstructions were used to measure canal diameter (CS-D), distance to the anterior nasal spine-posterior nasal spine axis (CS-ANS/PNS), buccal cortical plate (CS-BCP), alveolar crest (CS-AC), and adjacent tooth apices (CS-ATA). CBCT records were evaluated using OnDemand 3D software version 10.0.1. Statistical analyses included chi-square tests, independent t-tests, and generalized estimating equations (GEE). Analyses were adjusted for key confounders.

Results:

CSs were observed in 219 patients (37.8%), totaling 337 canals. The lateral incisor region was the most common location (44.6%), and the first premolar region the least common (3.6%). Mean CS-D was 0.89 ± 0.38 mm, mean CS-ANS/PNS 14.92 ± 3.35 mm, mean CS-BCP 7.44 ± 1.16 mm, mean CS-AC 8.24 ± 2.34 mm, and mean CS-ATA 3.83 ± 1.38 mm. Canal position significantly influenced all measured distances (P < 0.001). In contrast, laterality (right vs. left) showed a statistically significant difference only for CS-BCP (P = 0.005), with slightly greater values on the right.

Conclusion:

The CS showed significant anatomical variability. Preoperative CBCT evaluation is essential to minimize injury and ensure predictable surgical outcomes. Radiologists must identify and localize CS and locate it meticulously in presurgical radiological reports of the anterior maxilla.

1. Background

The anterior superior alveolar nerve is an important sensory branch that innervates the maxillary anterior teeth and adjacent soft tissues. The canalis sinuosus (CS) is a frequently overlooked anatomical canal that transmits the anterior superior alveolar neurovascular bundle (1). The term “canalis sinuosus” was first proposed by Frederic Wood Jones in 1939, who described it as a double-curved bony channel branching from the lateral wall of the infraorbital canal (2). Subsequent studies have confirmed Jones’ observations, noting that the CS typically originates from the infraorbital canal and is most frequently situated posterior to its midpoint (2-5). As the exclusive intraosseous canal for the anterior superior alveolar nerve and vessels, the CS plays a crucial role in anterior maxillary anatomy. Accessory canals, which represent anatomic variations of the CS, are occasionally present in the anterior maxilla; however, they are difficult to identify on conventional two-dimensional (2D) radiographs and are often overlooked by clinicians.
On 2D radiographs, extensions of the CS toward the anterior maxillary teeth may present as well-defined circular radiolucency. In such cases, their proximity to the root apices can lead to misinterpretation as periapical pathology, including inflammatory lesions, cystic changes, or external root resorption (6, 7). Similarly, on panoramic radiographs, the course of the canal may be misinterpreted as a developmental cleft or a fracture (8). Cone-beam computed tomography (CBCT) overcomes the limitations of 2D imaging by providing high-resolution, three-dimensional information without superimposition of surrounding structures (9-12). It is a cost-effective and accessible method for evaluating hard tissues and obtaining precise quantitative measurements (10, 11). CBCT is regarded as the gold standard for both angular and linear assessments in dentistry (9), as it provides accurate visualization of the CS, determining both its location and its relationship with adjacent structures.
The CS represents an anatomical variation of the anterior superior alveolar nerve, and its precise identification is clinically important (2). A variety of surgical procedures are performed in the anterior maxilla, including maxillary sinus surgery, removal of impacted canines, placement of implants for orthodontic anchorage, and, most critically, dental implant placement in the esthetic zone, where functional and biomechanical demands are high (5, 13, 14). The CS is considered a potential risk factor in orthognathic surgery, particularly during the LeFort I osteotomy, due to the possibility of injury to CS and surrounding neurovascular structures such as the posterior superior alveolar artery, nasopalatine artery, descending palatine artery, and internal maxillary artery (2). Additionally, certain otorhinolaryngologic (ENT) interventions involving the nasal cavity or anterior maxilla may also place the CS at risk (1, 15). Iatrogenic injury to the CS during surgeries can lead to unpredictable complications such as postoperative pain, paresthesia, or even epistaxis, in some cases necessitating implant removal for resolution (14, 16). Therefore, a thorough understanding of the exact anatomy and variations of the CS is essential to minimize complications and ensure safe surgical outcomes.

2. Objectives

The CS is an anatomical variation that has not been adequately described (2, 5, 14). Moreover, many clinicians have limited awareness of this canal and the potential complications it may cause during dental and surgical procedures. Therefore, the aim of this study was to evaluate the anatomical properties of the CS, including the diameter, location, and multiplanar distances of the CS relative to adjacent structures, including the anterior nasal spine-posterior nasal spine (ANS/PNS) axis, buccal cortical plate, alveolar crest (AC), and adjacent tooth apices, using CBCT.

3. Patients and Methods

3.1. Study Design and Settings

This retrospective cross-sectional anatomical observational study, with both descriptive and comparative aims, was conducted on patients referred to the Department of Oral and Maxillofacial Radiology, School of Dentistry, Shahid Beheshti University of Medical Sciences, Tehran, Iran, between August 2023 and August 2025.
The study was conducted in accordance with the principles of the Declaration of Helsinki and was approved by the institutional ethics committee (IR.SBMU.DRC.REC.1401.097). All CBCT images had been acquired for diagnostic purposes unrelated to this research, and no additional radiation dose was imposed on the patients. All patients’ data were anonymized, and medical records were used solely for research purposes.

3.2. Eligibility Criteria and Selection Methods
In line with previous studies (3, 6, 13), and considering an estimated prevalence of P = 0.4, a 95% confidence level, and a 4% maximum accepted error, the required sample size was calculated to be 580 using the following formula:
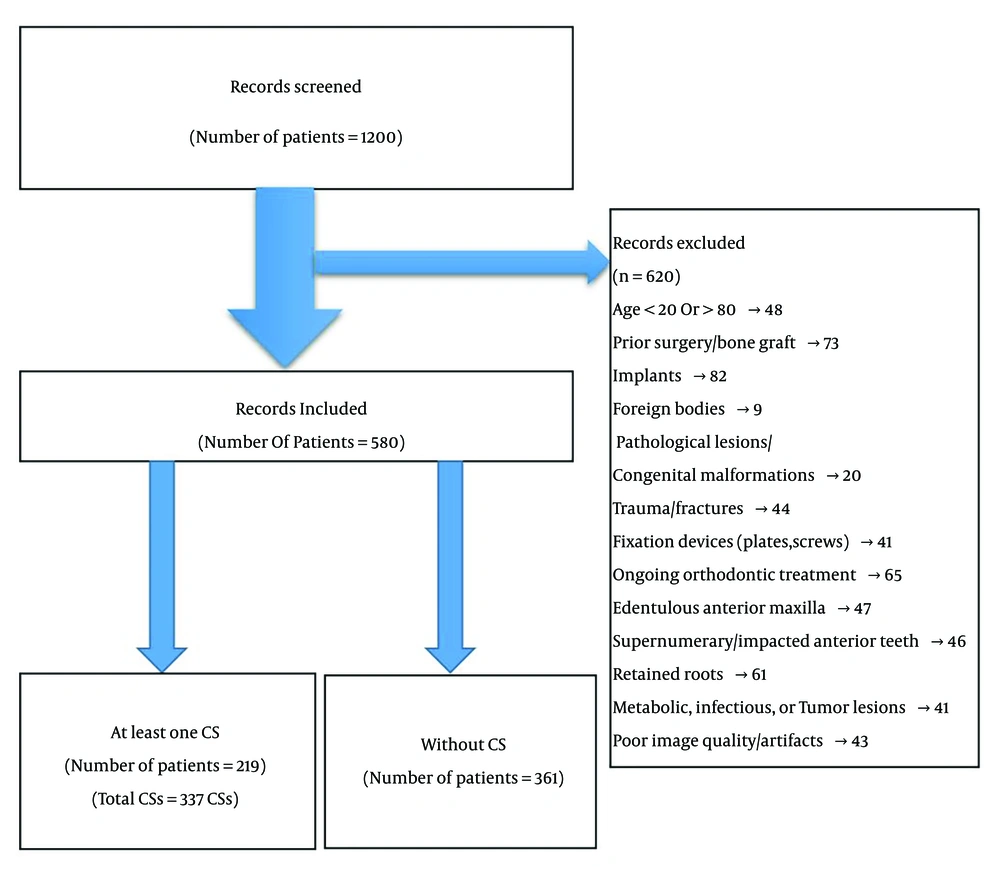
Strict eligibility criteria were applied to minimize potential confounding factors. To minimize the effect of selection bias, 1200 CBCT scans were assessed for eligibility, and 580 were selected according to the eligibility criteria. Figure 1 shows the study selection process. Patients were consecutively selected based on the availability of complete medical records and the following criteria:
Flow chart of patient enrolment (Abbreviations: CS, canalis sinuosus)
Figure 1.

Flow chart of patient enrolment (Abbreviations: CS, canalis sinuosus)

The inclusion criteria: (1) Patients aged 18 to 80 years (to exclude cases with mixed dentition and advanced age-related bone changes), (2) high-quality CBCT images with a field of view (FOV) covering the entire maxilla, extending from the superior border above the infraorbital rim to the inferior alveolar ridge, and including the complete dental arch, (3) images with adequate resolution and diagnostic quality, with minimal artifacts or distortions that could compromise evaluation (3, 13).
The exclusion criteria: (1) History of surgery/bone graft in the anterior maxilla, (2) presence of implants in the anterior maxilla, (3) foreign body in the area of interest, (4) pathological lesions with bone resorption, congenital malformations such as cleft palate and lip, (5) trauma/fractures in the anterior maxilla, (5) fixation devices (plates, screws), (6) ongoing orthodontic treatment, (7) edentulous anterior maxilla, (8) supernumerary or impacted anterior teeth, (9) retained roots, (10) presence of a metabolic, infectious, or tumor lesion affecting the maxillary region, (11) motion artifacts or poor image quality compromising diagnostic evaluation (3, 13).

3.3. Cone-Beam Computed Tomography Acquisition

All patients underwent CBCT scan by the same operator, using the same CBCT [NewTom VGi CBCT system (Verona, Italy)] with consistent exposure settings, including a 300-μm voxel size, 8 × 12 FOV, variable tube current (mA), and 110 kVp; high resolution. Images were saved in DICOM format and analyzed blindly by two experienced oral and maxillofacial radiologists, and any disagreements were resolved by consensus.

3.4. Image Analysis

For interpretation, real-time reconstruction was performed using On Demand 3D Application; Version 10.0.1 (Cybermed, Seoul, Korea). On the multiplanar reconstruction (MPR) screen, the anatomical axial, coronal, and sagittal planes were properly aligned. For axial images, the plates of the pterygoid processes of the sphenoid bone were aligned with the coronal plane, thereby positioning the ANS along the sagittal plane. In sagittal images, the maxillary plane served as a reference to ensure that the plane connecting the anterior and posterior nasal spines (PNS) was parallel to the horizontal (axial) plane. In coronal sections, the floor of the nasal cavity was oriented parallel to the horizontal plane. Cross-sectional views were constructed perpendicular to the alveolar ridge.
The presence of the CS was assessed in axial slices by scrolling (0 mm thickness). A canal meeting the following criteria was considered CS: (1) Corticated, partially corticated, or non-corticated; (2) distinct from the nasopalatine canal; (3) identified in all three planes (axial, sagittal, and coronal); and (4) originating from the infraorbital canal and coursing toward the anterior wall of the nasal cavity and the alveolar process. The canal was identified in the axial and subsequently confirmed in the sagittal and coronal views.
When the CS was present, its emergence was classified into seven possible locations relative to the teeth or incisive foramen: (A) central incisor region, (B) region between the central and lateral incisors, (C) lateral incisor region, (D) canine region, (E) first premolar region, (F) lateral to the incisive foramen, and (G) posterior to the incisive foramen, as described by de Oliveira-Santos et al. (3). Canals were further classified as unilateral or bilateral.
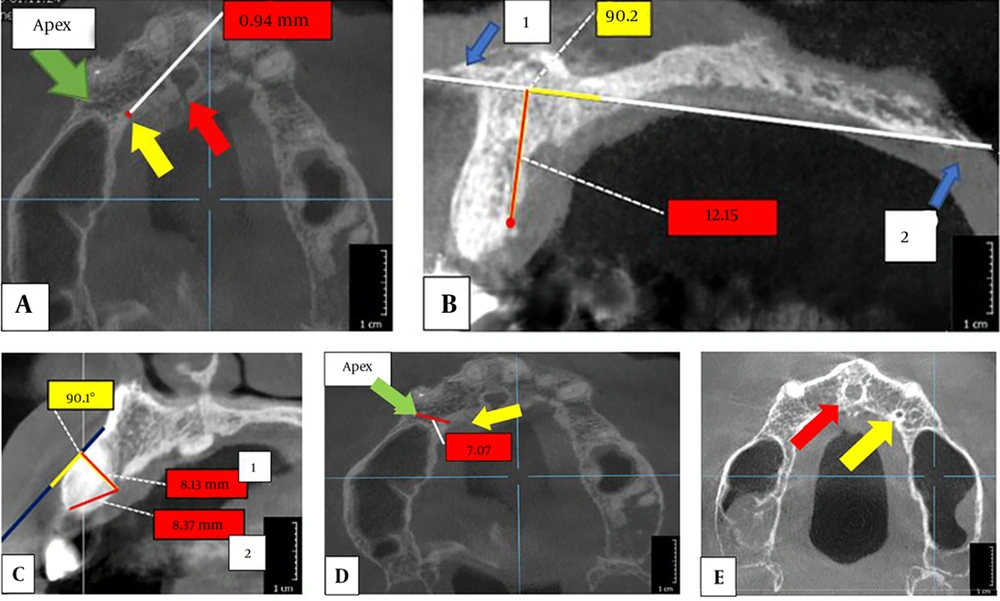
Measurements of the CS location relative to the alveolar ridge were performed (Figure 2). The parameters evaluated included: Canal diameter at the level of the adjacent tooth apex (CS-D), Canal opening relative to the ANS–PNS axis in sagittal (CS-ANS/PNS), Distance to the buccal cortical plate in cross-sectional (CS-BCP), Distance to the AC in cross-sectional (CS-AC), Distance to the apex of the adjacent tooth in sagittal (CS-ATA) (17).
Measurements of the canalis sinuosus (CS) location. The nasopalatine canal is indicated by the red marker, the CS is indicated by the yellow marker, and the apex of the adjacent tooth is indicated by the green marker. A, Canal diameter (CS-D): In the axial view, at the level of the adjacent tooth apex, the internal diameter of the CS canal was measured by considering the inner borders of the canal; B, Distance from the CS canal to the ANS-PNS axis (CS-ANS/PNS): In the sagittal view, a reference line was drawn between point 1 (anterior nasal spine, ANS) and point 2 (posterior nasal spine, PNS). The perpendicular distance from the ANS-PNS line to the CS canal was then measured (12.15 mm). The 90° angle shown in the figure confirms that the measurement was taken perpendicular to the ANS–PNS line; C, Measurements in cross-sectional views: C1. Distance to the buccal cortical plate (CS-BCP): A line tangential to the buccal cortical plate was drawn (blue line), and the perpendicular distance from this line to the most anterior point of the CS was measured as CS-BCP (8.13 mm). The 90.1° angle confirms that the measurement was taken vertically. C2. Distance to the alveolar crest (CS-AC): From the same most anterior point of the CS, the linear distance to the highest point of the alveolar bone (alveolar crest) was measured as CS-AC (8.37 mm); D, Distance to the apex of the adjacent tooth (CS-ATA): In the axial view, at the level of the adjacent tooth apex, the linear distance from the tooth apex to the center of the CS canal was measured; E, Distinction between the nasopalatine canal and the canalis sinuosus: The nasopalatine canal and the CS were distinguished based on their anatomical course, location, relative size, and relationship to adjacent structures, as demonstrated in the figure.
Figure 2.

Measurements of the canalis sinuosus (CS) location. The nasopalatine canal is indicated by the red marker, the CS is indicated by the yellow marker, and the apex of the adjacent tooth is indicated by the green marker. A, Canal diameter (CS-D): In the axial view, at the level of the adjacent tooth apex, the internal diameter of the CS canal was measured by considering the inner borders of the canal; B, Distance from the CS canal to the ANS-PNS axis (CS-ANS/PNS): In the sagittal view, a reference line was drawn between point 1 (anterior nasal spine, ANS) and point 2 (posterior nasal spine, PNS). The perpendicular distance from the ANS-PNS line to the CS canal was then measured (12.15 mm). The 90° angle shown in the figure confirms that the measurement was taken perpendicular to the ANS–PNS line; C, Measurements in cross-sectional views: C1. Distance to the buccal cortical plate (CS-BCP): A line tangential to the buccal cortical plate was drawn (blue line), and the perpendicular distance from this line to the most anterior point of the CS was measured as CS-BCP (8.13 mm). The 90.1° angle confirms that the measurement was taken vertically. C2. Distance to the alveolar crest (CS-AC): From the same most anterior point of the CS, the linear distance to the highest point of the alveolar bone (alveolar crest) was measured as CS-AC (8.37 mm); D, Distance to the apex of the adjacent tooth (CS-ATA): In the axial view, at the level of the adjacent tooth apex, the linear distance from the tooth apex to the center of the CS canal was measured; E, Distinction between the nasopalatine canal and the canalis sinuosus: The nasopalatine canal and the CS were distinguished based on their anatomical course, location, relative size, and relationship to adjacent structures, as demonstrated in the figure.

Cone-beam computed tomography images were displayed on a 21.3-inch flat panel, color active matrix and thin-film transistor medical monitor with 2048 × 2560 resolution, 11.9 bits, and 75 Hz (NEC MultiSync, Munich, Germany). The examiners could change the contrast and brightness of the images to ensure optimal visualization. To minimize examiner fatigue, the evaluations were conducted in multiple sessions throughout the day, and the images were presented in a randomized order. To assess intra-observer reproducibility, 25% of the cases were randomly re-evaluated after a 15-day interval using the same methodology. In the case of any disagreements, consensus was reached through discussion.

3.5. Statistical Analysis

Data were analyzed using the chi-square and independent t-tests. The Shapiro-Wilk test was used to assess the normality of data distribution within the study groups. Since some patients contributed more than one canal, the statistical analysis was conducted at two levels: Patient and canal. Both patient-level and canal-level analyses were performed for prevalence, laterality, and sex distribution. Canal-level analyses were specifically applied to morphometric measurements. At the canal level, marginal models with generalized estimating equations (GEE) accounted for clustered data, and pairwise comparisons were performed with the Games-Howell test using IBM SPSS Statistics for Windows, version 28.0 (IBM Corp. Released 2021. IBM SPSS Statistics for Windows, version 28.0. Armonk, NY: IBM Corp). For continuous outcomes, a Gaussian distribution with an identity link was specified (Appendix 1 in Supplementary File). For binary outcomes, a binomial distribution with a logit link was applied (Appendix 1 in Supplementary File). To account for multiple comparisons, P-values from pairwise tests were adjusted using the Benjamini-Hochberg method. A P-value < 0.05 was considered statistically significant. Effect sizes were interpreted in relation to the CBCT voxel size (0.3 mm) to distinguish statistically significant findings from those with potential clinical relevance.

4. Results

4.1. Intra- and Inter-Observer Reliability

Measurement reproducibility was assessed. Intra-observer reliability for continuous variables was excellent (Intraclass Correlation Coefficient [ICC] = 0.868 - 0.966; two-way mixed-effects model, single measures, consistency). Inter-observer reliability was substantial to excellent (ICCs = 0.84 - 0.92; two-way random with absolute agreement). For categorical variables, intra- and inter-observer agreement were substantial (κ = 0.72 and κ = 0.70, respectively).

4.2. Epidemiologic Result by Sex, Side, and Location
A total of 580 CBCT scans (epidemiologic unit) were analyzed, comprising 311 females (53.6%) and 269 males (46.4%). The CS was observed in 219 patients, with a total of 337 CSs (anatomical unit). In patient-level outcomes, higher prevalence was observed in males (44.6%) compared to females (31.8%). 145 patients (66.2%) had a unilateral canal and 74 (33.8%) a bilateral canal. In males with CS, 66% were unilateral and 34% bilateral, while in females, 67% were unilateral and 33% bilateral, with no significant differences.
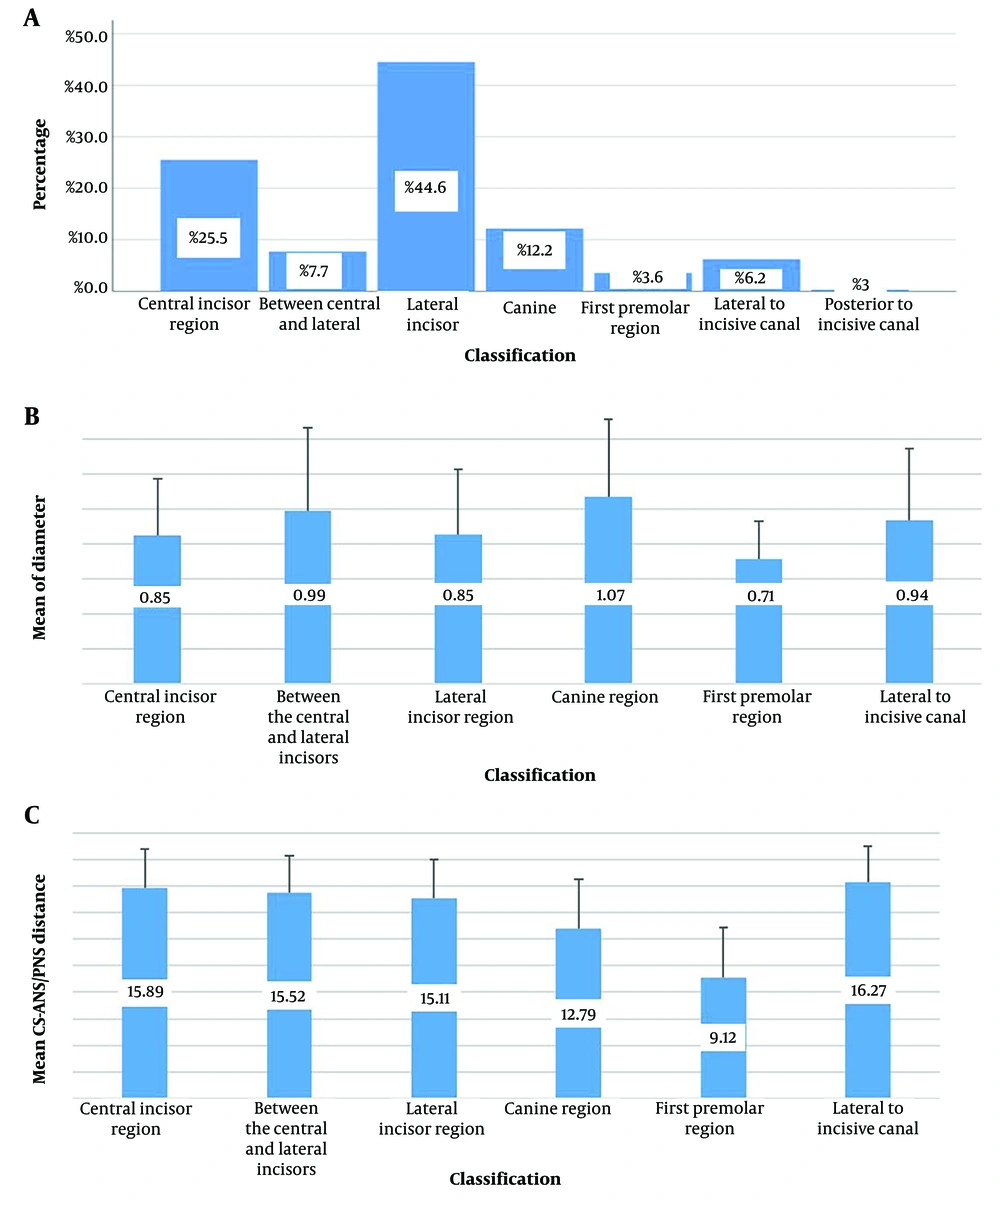
The most common location of the CS was in the lateral incisor (44.6%), whereas the least common was in the first premolar (3.6%) (Figure 3A).
A, Prevalence of classifications of the CS canal according to percentage (%), based on the canal-level analysis; B, Comparison of the mean CS diameter by classification groups; C, Comparison of the mean CS-ANS/PNS distance by classification groups (abbreviations: CS, canalis sinuosus; CS (N), number of CS; CS-ANS/PNS, canal opening to the ANS–PNS axis in sagittal).
Figure 3.

A, Prevalence of classifications of the CS canal according to percentage (%), based on the canal-level analysis; B, Comparison of the mean CS diameter by classification groups; C, Comparison of the mean CS-ANS/PNS distance by classification groups (abbreviations: CS, canalis sinuosus; CS (N), number of CS; CS-ANS/PNS, canal opening to the ANS–PNS axis in sagittal).

In canal-level outcomes, the mean number of CSs among subjects with at least one canal was 1.58 ± 0.86 in males and 1.52 ± 0.86 in females. No significant sex-related difference was observed in the mean number of CS (P = 0.608). Further information is illustrated in Table 1.
Table 1.Distribution of Numbers of Canalis Sinuosus by Sex in Patient-Level a
CS numberFemaleMaleTotal
164 (61.4)73 (60.0)137 (62.6)
224 (24.2)32 (26.7)56 (25.6)
38 (8.1)8 (6.7)16 (7.3)
42 (2.0)7 (5.8)9 (4.1)
61 (1.0)0 (0.0)1 (0.5)
Total patients99120219

Abbreviation: CS, canalis sinuosus.

a Values are expressed as No. (%).

In canal-level analysis, 173 CSs (51.6%) were located in the right and 163 (48.4%) in the left. Moreover, the mean CS-D was 0.89 ± 0.38 mm on the right and 0.90 ± 0.39 mm on the left. Overall, the mean CS-D was 0.89 ± 0.38 mm (Table 2). A statistically significant difference between CS-D and classification was observed (P < 0.001), indicating variation of diameters across different anatomical locations. However, no significant difference was observed between the right and left (P = 0.998). Since only one CS was located at position G, it was excluded from further analysis, resulting in a total of 336 CSs presented in Tables 2. and 3.
Table 2.Comparison of Canalis Sinuosus Diameter and CS-ANS/PNS Distance by Side (CS-Level Analysis)
Measurements/sidesCS (N)Mean ± SD (mm)Min-Max (mm)95% CI for mean (lower-upper)
CS diameter
R1730.885 ± 0.3750.37 - 2.170.829 - 0.942
L1630.895 ± 0.3930.32 - 2.540.835 - 0.956
Total3360.890 ± 0.3830.32 - 2.540.849 - 0.931
CS-ANS/PNS distance
R17315.052 ± 3.3822.47 - 22.9014.544 - 15.560
L16314.771 ± 3.3244.98 - 21.8414.257 - 15.285
Total33614.916 ± 3.3522.47 - 22.9014.556 - 15.275

Abbreviations: CS, canalis sinuosus; CS (N), number of CS; SD, standard deviation; mean ± SD, or median; Min, minimum; Max, maximum; mm, millimeter; CI, confidence interval; R, right; L, left; CS diameter, canal diameter at the level of the adjacent tooth apex; CS-ANS/PNS distance, canal opening to the ANS-PNS axis in sagittal.

Table 3.Comparison of Canalis Sinuosus Distances by Side (CS-Level Analysis)
Measurement/sidesCS (N)Mean ± SD (mm)Min (mm)Max (mm)95% CI for mean (lower-upper)
CS-BCP distance
R1737.515 ± 1.1194.3611.867.347 - 7.683
L1637.370 ± 1.2044.6711.757.184 - 7.556
Total3367.444 ± 1.1614.3611.867.320 - 7.569
CS-AC distance
R1738.247 ± 2.2043.2017.457.916 - 8.578
L1638.248 ± 2.4904.1016.317.862 - 8.633
Total3368.247 ± 2.3443.2017.457.996 - 8.500
CS-ATA distance
R1733.750 ± 1.3381.269.053.544 - 3.951
L1633.929 ± 1.4210.589.193.709 - 4.149
Total3363.837 ± 1.3800.589.193.689 - 3.985

Abbreviations: CS, canalis sinuosus; CS (N), number of CS; SD, standard deviation; mean ± SD, or median; Min, minimum; Max, maximum; mm, millimeter; R, right; L, left; CI, confidence interval; CS-BCP, canalis sinuosus distance to buccal cortical plate in cross-sectional; CS-AC, canalis sinuosus distance to the alveolar crest in cross-sectional; CS-ATA, canalis sinuosus distance to the apex of the adjacent tooth in sagittal.

4.3. Morphological Results
Pairwise comparisons of mean diameter across positions (A-E) were conducted using the Games-Howell test. The mean CS-D in A was significantly smaller than in D (P < 0.001), and in C significantly smaller than in D (P = 0.029). D had a significantly larger mean CS-D compared to E (P = 0.049). All other comparisons among A-E were not statistically significant (Figure 3B).
The mean CS-ANS/PNS was 15.05 ± 3.38 mm in the right and 14.77 ± 3.32 mm in the left. Overall, the mean distance was 14.92 ± 3.35 (Table 2). GEE analysis showed that position had a statistically significant effect on the CS-ANS/PNS (P < 0.001), indicating that the mean distance differed across positions. In contrast, no statistically significant difference in mean CS-ANS/PNS was observed between the right and left (P = 0.616).
Pairwise comparisons of the CS-ANS/PNS across positions (A-F) were performed using the Games-Howell test. Significant differences were observed between A and D (P < 0.001) and A and E (P = 0.001), with mean distance higher in A. B had a significantly higher mean than D (P = 0.001) and E (P = 0.001). C showed a significantly higher mean than D (P = 0.014) and E (P = 0.002). D had a significantly lower mean compared to F (P < 0.001), and E had a significantly lower mean than F (P < 0.001). No other comparisons among positions were statistically significant (Figure 3C).
The CS-BCP in the right was 7.51 ± 1.12 mm, compared to 7.37 ± 1.20 mm in the left, with an overall mean of 7.44 ± 1.16 mm (Table 3). GEE analysis showed both position and side had a statistically significant effect on the CS-BCP: The mean distance differed significantly among positions (P < 0.001), and the distance on the right was significantly greater than on the left (P = 0.005).
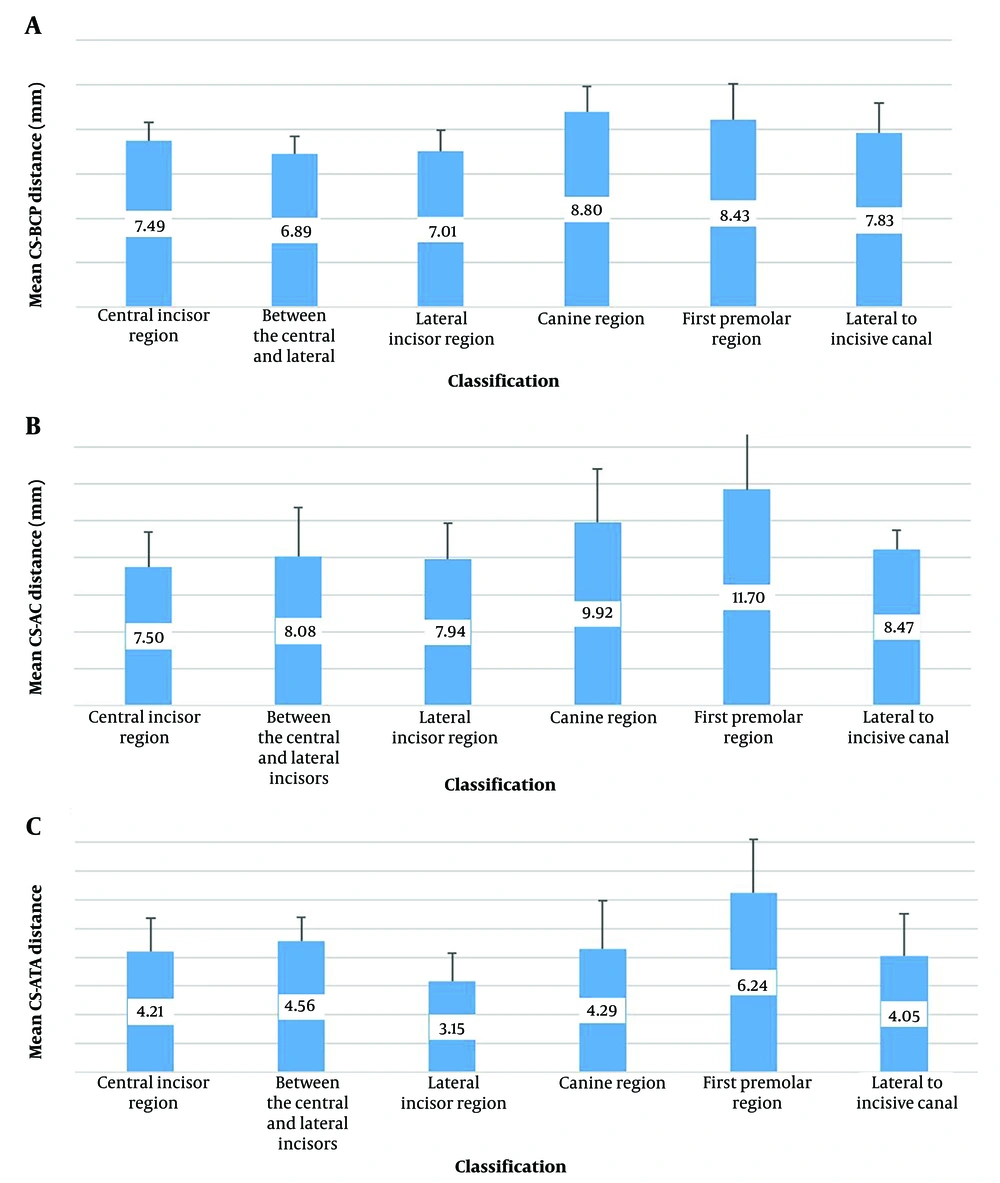
Pairwise comparisons using the Games-Howell test revealed significant differences among regions A-E: The mean distance was higher in A than B and C (P = 0.022, P < 0.001, respectively), lower in A than D (P < 0.001), lower in B than D (P < 0.001), and lower in C than D (P < 0.001). All other comparisons were not statistically significant (Figure 4A).
In the right, the CS-AC was 8.25 ± 2.20 mm, and in the left, it was 8.25 ± 2.49 mm. Across the 336 canals, the overall mean CS-AC was 8.24 ± 2.34 mm (Table 3). GEE analysis indicated that position had a statistically significant effect on the CS-AC (P < 0.001), showing that the mean distance differed among positions. In contrast, there was no significant difference between the right and left (P = 0.979).
Comparison of the mean A, CS-BCP; B, CS-AC distance; C, CS-ATA distance by classification groups (Abbreviations: CS, canalis sinuosus; CS (N), number of CS; CS-BCP, canalis sinuosus distance to buccal cortical plate in cross-sectional; CS-AC, canalis sinuosus distance to the alveolar crest in cross-sectional; CS-ATA, canalis sinuosus distance to the apex of the adjacent tooth in sagittal).

Figure 4.

Comparison of the mean A, CS-BCP; B, CS-AC distance; C, CS-ATA distance by classification groups (Abbreviations: CS, canalis sinuosus; CS (N), number of CS; CS-BCP, canalis sinuosus distance to buccal cortical plate in cross-sectional; CS-AC, canalis sinuosus distance to the alveolar crest in cross-sectional; CS-ATA, canalis sinuosus distance to the apex of the adjacent tooth in sagittal).

Pairwise comparisons of the CS-AC across positions (A-F), performed using the Games-Howell test, revealed statistically significant differences between A and D (P < 0.001), A and E (P = 0.009), A and F (P = 0.027), B and E (P = 0.034), C and D (P = 0.002), and C and E (P = 0.020). Specifically, the mean distance was smaller in A than in D, E, and F, smaller in B than in E, and smaller in C than in D and E. All other comparisons among positions were not statistically significant (Figure 4B).
In the right, the CS-ATA was 3.75 ± 1.34 mm, while in the left, it was 3.93 ± 1.42 mm. Overall, the mean CS-ATA was 3.83 ± 1.38 mm (Table 3). GEE analysis indicated that position had a statistically significant effect on the CS-ATA (P < 0.001), showing that the mean distance differed among positions. In contrast, there was no significant difference between the right and left (P = 0.708).
Pairwise comparisons of the CS-ATA across positions (A-F) were performed using the Games-Howell test. Significant differences were observed between A and C (P < 0.001) and A and E (P = 0.028), with the mean distance higher in A than C but lower than E. B showed a significantly higher mean than C (P < 0.001), while C was significantly lower than D (P = 0.002) and E (P = 0.001). D had a significantly lower mean than E (P = 0.044), and E was significantly lower than F (P = 0.024). All other comparisons among positions were not statistically significant (Figure 4C).
A sensitivity analysis was conducted by introducing a realistic measurement error of ±0.3 mm, corresponding to the CBCT voxel size. The resulting estimates changed by less than 2% across all distances, and the statistical significance of all findings remained unchanged, indicating that the results are robust to measurement variability.

5. Discussion

5.1. Summary of Key Findings

Anatomical variations play a key role in both treatment planning and post-treatment outcomes, as they help prevent complications during surgeries and support a more predictable prognosis. The CS has been described in early anatomical literature, with Macalister first reporting its terminal portion (1, 2), and it is also noted in modern anatomy textbooks (18, 19). Nevertheless, many clinicians remain unfamiliar with this structure (2, 5, 13). Therefore, we aimed to provide a comprehensive evaluation of the anatomical characteristics and spatial relationships of the CS using CBCT.

5.2. Comparison with Existing Literature

Our findings revealed that the CS was present in 37.8% of patients, highlighting that CS is more common than often recognized in clinical practice. 51.6% of canals were located in the right and 48.4% in the left. By contrast, von Arx et al. (20) reported 27 canals (40.3%) on the right and 40 (59.7%) on the left. This difference may reflect the smaller sample size in their study, population variations, and differences in inclusion and exclusion criteria.
In this study, the CS was most frequently observed in region C at 44.6%, and least frequently in region E at 3.6% (3). In approximately 12% of cases where the middle alveolar nerve is absent, the anterior superior alveolar nerve may provide secondary innervation to the premolar region, which may explain the lower prevalence of the CS in this area. The current findings are in agreement with previous studies (13, 21, 22), which reported the lateral incisor region as the most common site. In contrast, Shan et al. reported the highest prevalence of the CS between the central and lateral incisors, noting that canal openings in this region and the central incisor were closer to the AC (14). Similarly, Aoki et al. identified the central incisor as the most prevalent site (6). These differences may be attributed to the smaller sample size (200 patients), population differences (Brazilian cohort), and the exclusion of certain patients in the current study, such as anterior maxillary implants, cleft palate, edentulous areas, supernumerary, impacted teeth, or mixed dentition in the anterior maxilla.
In this study, the mean CS-D was 0.89 ± 0.38 mm. This is consistent with Rao et al. (22), who reported a CS-D of 0.88 mm. Although the CS is smaller than structures such as the incisive foramen, it should not be overlooked during surgery. Even minute canals, including alveolar or accessory lingual foramina (< 1 mm), can contribute to significant bleeding during implant placement or other maxillary procedures (23, 24). For comparison, the descending palatine artery, a common source of hemorrhage in posterior maxillary surgery, has a diameter of 1.1 - 2 mm (mean 1.7 mm) (2, 5). Given the tortuous course of the CS, especially near tooth apices, reporting both minimum and maximum diameters provides valuable insight for surgical planning.
In our study, the mean CS-ANS/PNS was 14.92 ± 3.35 mm, ranging from 2.47 mm adjacent to the right central incisor to 22.9 mm near the right incisive canal. The distance varied significantly by canal position (P < 0.001). Additionally, the spatial location of the CS, namely, CS-BCP, CS-AC, and CS-ATA, was overall 7.44 ± 1.16 mm, 8.24 ± 2.34 mm, and 3.83 ± 1.38 mm, respectively. Canal position significantly influenced these measured distances (P < 0.001), indicating variability across positions A-F. In contrast, laterality (right vs. left) had no significant effect on CS-AC (P = 0.979), CS-ATA (P = 0.708), or CS-ANS/PNS distance (P = 0.616), while CS-BCP showed a small but statistically significant difference between sides (P = 0.005), with slightly greater values on the right. These findings are consistent with previous reports. Manhaes Junior et al. (13) observed slightly different distances to the cortical plate (right: 6.83 mm, left: 7.94 mm) and AC (right: 7.71 mm, left: 9.28 mm), likely due to smaller sample size, population differences, and differing inclusion/exclusion criteria. Yeap et al. (17) reported a mean CS-ATA of 1.25 ± 2.16 mm in an Australian cohort. The short distances between the CS and adjacent tooth apices highlight the critical importance of precise localization of this structure before performing any surgical procedure in the anterior maxilla. Accidental injury to the neurovascular bundle of the CS may compromise osseointegration and lead to complications such as bleeding, pain, or temporary or permanent paresthesia (16, 21, 24). Therefore, preoperative CBCT evaluation is essential to accurately identify the CS course and maintain an adequate safety margin, preferably at least 2 mm, when determining implant position, angulation, and depth. Awareness of this anatomical variability is equally important in LeFort I orthognathic surgery, ENT interventions, bone grafting, and cyst enucleation in the anterior maxilla (6, 14, 16). Cone-beam computed tomography is the most reliable method for visualizing the CS, enabling clinicians to minimize neurovascular risks and achieve predictable surgical outcomes (10, 12, 25).

5.3. Implications for Radiology Practice

From a clinical perspective, it is essential to distinguish statistical significance from clinical relevance. Given the CBCT voxel size of 0.3 mm used in this study, differences smaller than this threshold may fall within measurement uncertainty and should be interpreted with caution. In our study, although the side-related difference in CS-BCP was statistically significant, its magnitude is unlikely to influence clinical decision-making in isolation. In contrast, position-dependent differences including CS-ANS/PNS, CS-AC, and CS-ATA exceeded 1 mm. These differences may be clinically meaningful during implant planning in the anterior maxilla, where safety margins are limited and proximity to neurovascular structures is critical. Even modest absolute differences can become relevant when multiple anatomical constraints coexist in esthetic and high-risk regions. Therefore, reporting effect sizes alongside their confidence intervals provides a more clinically informative framework than P-values alone.

5.4. Study Limitations and Directions for Future Research

This study has some limitations. First, the age group from childhood to early adulthood was not categorized into smaller subgroups. Second, the retrospective nature of the study posed some limitations on data analysis and interpretation. A larger sample size is needed to improve the generalizability of the results. Future longitudinal studies are recommended to evaluate the biological and developmental factors associated with the formation and variation of the CS.

5.5. Conclusions

In conclusion, these findings highlight the anatomical variability of the CS and its clinical relevance, particularly for implant placement, anterior maxillary surgery, orthognathic procedures, and ENT procedures involving the nasal cavity or anterior maxilla. Careful preoperative evaluation of the CS using CBCT is essential to minimize the risk of neurovascular injury and ensure predictable surgical outcomes. Radiologists should carefully assess and identify this anatomical variation and locate it meticulously in presurgical radiological reports to avoid injury.

Footnotes

References

  • 1.
    Samunahmetoglu E, Kurt MH. Assessment of Canalis Sinuosus located in maxillary anterior region by using cone beam computed tomography: a retrospective study. BMC Med Imaging. 2023;23(1):46. [PubMed ID: 36978007]. [PubMed Central ID: PMC10045502]. https://doi.org/10.1186/s12880-023-01000-x.
  • 2.
    Ferlin R, Pagin BSC, Yaedu RYF. Canalis sinuosus: a systematic review of the literature. Oral Surg Oral Med Oral Pathol Oral Radiol. 2019;127(6):545-51. [PubMed ID: 30772255]. https://doi.org/10.1016/j.oooo.2018.12.017.
  • 3.
    de Oliveira-Santos C, Rubira-Bullen IR, Monteiro SA, Leon JE, Jacobs R. Neurovascular anatomical variations in the anterior palate observed on CBCT images. Clin Oral Implants Res. 2013;24(9):1044-8. [PubMed ID: 22587228]. https://doi.org/10.1111/j.1600-0501.2012.02497.x.
  • 4.
    Gurler G, Delilbasi C, Ogut EE, Aydin K, Sakul U. Evaluation of the morphology of the canalis sinuosus using cone-beam computed tomography in patients with maxillary impacted canines. Imaging Sci Dent. 2017;47(2):69-74. [PubMed ID: 28680842]. [PubMed Central ID: PMC5489671]. https://doi.org/10.5624/isd.2017.47.2.69.
  • 5.
    Wanzeler AM, Marinho CG, Alves Junior SM, Manzi FR, Tuji FM. Anatomical study of the canalis sinuosus in 100 cone beam computed tomography examinations. Oral Maxillofac Surg. 2015;19(1):49-53. [PubMed ID: 24752931]. https://doi.org/10.1007/s10006-014-0450-9.
  • 6.
    Aoki R, Massuda M, Zenni LTV, Fernandes KS. Canalis sinuosus: anatomical variation or structure? Surg Radiol Anat. 2020;42(1):69-74. [PubMed ID: 31606782]. https://doi.org/10.1007/s00276-019-02352-2.
  • 7.
    Devathambi TJR, Aswath N. Assessment of canalis sinuosus, rare anatomical structure using cone-beam computed tomography: A prospective study. J Clin Imaging Sci. 2024;14:8. [PubMed ID: 38628609]. [PubMed Central ID: PMC11021114]. https://doi.org/10.25259/JCIS_6_2024.
  • 8.
    Valcu M, Rusu MC, Sendroiu VM, Didilescu AC. The lateral incisive canals of the adult hard palate - aberrant anatomy of a minor form of clefting? Rom J Morphol Embryol. 2011;52(3):947-9. [PubMed ID: 21892545].
  • 9.
    Rouientan A, Khodaparast MB, Safi Y. Evaluation of diagnostic accuracy of cone beam computed tomography and multi-detector computed tomography for detection of anatomical variations in rhinoplasty. Head Face Med. 2024;20(1):1. [PubMed ID: 38172987]. [PubMed Central ID: PMC10763271]. https://doi.org/10.1186/s13005-023-00401-1.
  • 10.
    Vasegh Z, Safi Y, Azar MS, Ahsaie MG, Arianezhad SM. Assessment of bony changes in temporomandibular joint in patients using cone beam computed tomography - a cross sectional study. Head Face Med. 2023;19(1):47. [PubMed ID: 37898789]. [PubMed Central ID: PMC10612346]. https://doi.org/10.1186/s13005-023-00392-z.
  • 11.
    Javaheri Z, Jafari-Pozve S, Jafari-Pozve N, Aryanezhad SS, Arianezhad SM. Evaluation of pulp stones in unerupted teeth and their correlation with principal biochemical factors using cone beam computed tomography. Gen Dent. 2025;73(3):35-41. [PubMed ID: 40258254].
  • 12.
    Yari A, Hasheminasab M, Fasih P, Nouralishahi A, Arianezhad SM. The pattern of maxillofacial fractures associated with rollover accidents: A 7-year retrospective study. Dent Traumatol. 2024;40(2):213-20. [PubMed ID: 37881161]. https://doi.org/10.1111/edt.12900.
  • 13.
    Manhaes Junior LR, Villaca-Carvalho MF, Moraes ME, Lopes SL, Silva MB, Junqueira JL. Location and classification of Canalis sinuosus for cone beam computed tomography: avoiding misdiagnosis. Braz Oral Res. 2016;30(1). e49. [PubMed ID: 27119586]. https://doi.org/10.1590/1807-3107BOR-2016.vol30.0049.
  • 14.
    Shan T, Qu Y, Huang X, Gu L. Cone beam computed tomography analysis of accessory canals of the canalis sinuosus: A prevalent but often overlooked anatomical variation in the anterior maxilla. J Prosthet Dent. 2021;126(4):560-8. [PubMed ID: 33004226]. https://doi.org/10.1016/j.prosdent.2020.05.028.
  • 15.
    Yang Z, Yuzi J, Beibei L. Cone-beam computed tomographic evaluation of styloid process: a retrospective study of 498 patients with maxillofacial diseases. BMC Med Imaging. 2024;24(1):333. [PubMed ID: 39639186]. [PubMed Central ID: PMC11622470]. https://doi.org/10.1186/s12880-024-01516-w.
  • 16.
    Volberg R, Mordanov O. Canalis Sinuosus Damage after Immediate Dental Implant Placement in the Esthetic Zone. Case Rep Dent. 2019;2019:3462794. [PubMed ID: 31934462]. [PubMed Central ID: PMC6942755]. https://doi.org/10.1155/2019/3462794.
  • 17.
    Yeap CW, Danh D, Chan J, Parashos P. Examination of canalis sinuosus using cone beam computed tomography in an Australian population. Aust Dent J. 2022;67(3):249-61. [PubMed ID: 35285958]. https://doi.org/10.1111/adj.12910.
  • 18.
    von Arx T, Lozanoff S. Clinical Oral Anatomy. Cham, Switzerland: Springer Cham; 2017. https://doi.org/10.1007/978-3-319-41993-0.
  • 19.
    Standring S. Gray's Anatomy: The Anatomical Basis of Clinical Practice. 42nd ed. Amsterdam, Netherlands: Elsevier Health Sciences; 2020.
  • 20.
    von Arx T, Lozanoff S, Sendi P, Bornstein MM. Assessment of bone channels other than the nasopalatine canal in the anterior maxilla using limited cone beam computed tomography. Surg Radiol Anat. 2013;35(9):783-90. [PubMed ID: 23539212]. https://doi.org/10.1007/s00276-013-1110-8.
  • 21.
    Tomrukcu DN, Kose TE. Assesment of accessory branches of canalis sinuosus on CBCT images. Med Oral Patol Oral Cir Bucal. 2020;25(1):e124-30. [PubMed ID: 31880280]. [PubMed Central ID: PMC6982980]. https://doi.org/10.4317/medoral.23235.
  • 22.
    Rao WX, Ma YX, Li MX, Wen YM, Rao YL, Wu JQ, et al. Cone Beam Computed Tomography in observing the presence and location of canalis sinuosus. Eur Rev Med Pharmacol Sci. 2024;28(3):939-48. [PubMed ID: 38375699]. https://doi.org/10.26355/eurrev_202402_35331.
  • 23.
    Lamas Pelayo J, Penarrocha Diago M, Marti Bowen E, Penarrocha Diago M. Intraoperative complications during oral implantology. Med Oral Patol Oral Cir Bucal. 2008;13(4):E239-43. [PubMed ID: 18379448].
  • 24.
    Hong YH, Mun SK. A case of massive maxillary sinus bleeding after dental implant. Int J Oral Maxillofac Surg. 2011;40(7):758-60. [PubMed ID: 21377328]. https://doi.org/10.1016/j.ijom.2010.11.027.
  • 25.
    Aryanezhad SS, Jafari-Pozve N, Abrishami M, Arianezhad SM. Investigating the Anatomy and Location of the Infraorbital Canal in Relation to the Adjacent Structures in Cone Beam Computed Tomography (CBCT) Images. J Maxillofac Oral Surg. 2025;24(2):542-56. [PubMed ID: 40182441]. [PubMed Central ID: PMC11961809]. https://doi.org/10.1007/s12663-024-02191-8.

Crossmark
Crossmark
Checking
Share on
Cited by
Metrics

Ordering Reprints

Articles are published under the Creative Commons license stated on each article. No permission or royalty fee is required for uses permitted by that license. CCC handles optional bulk and customized reprint orders. Any quotation covers production and delivery services only, not copyright permission. > Request Reprints from CCC 

Search Relations

Author(s):

Related Articles