I J Radiol

Image Credit:I J Radiol

Deep Learning-Based CT Splenic Segmentation and Morphometrics: A Spleen Volume Prediction Model

Author(s):
Tian TanTian Tan1, Xiaoying WangXiaoying WangXiaoying Wang ORCID1,*, Yaofeng ZhangYaofeng Zhang2, Xiaodong ZhangXiaodong Zhang1, Kexin WangKexin Wang1
1Department of Radiology, Peking University First Hospital, Beijing, China
2Beijing Smart Tree Medical Technology, Beijing, China

IJ Radiology:Vol. 22, issue 4; e168436
Published online:Apr 13, 2026
Article type:Research Article
Received:Nov 27, 2025
Accepted:Feb 25, 2026
How to Cite:Tan T, Wang X, Zhang Y, Zhang X, Wang K. Deep Learning-Based CT Splenic Segmentation and Morphometrics: A Spleen Volume Prediction Model. I J Radiol. 2025;22(4):e168436. doi: https://doi.org/10.5812/iranjradiol-168436

Abstract

Background:

Quantitative assessment of spleen volume on computed tomography (CT) is clinically relevant but is often approximated using linear measurements. Deep learning–based segmentation enables automated volumetry; however, population-specific normative spleen volume models for Chinese adults remain limited.

Objectives:

To develop a deep learning–based automated CT segmentation model for normal spleens and to derive a Chinese adult standard spleen volume (SSV) prediction model based on key physiologic factors.

Patients and Methods:

A 3D V-Net spleen segmentation model was trained using Dataset 1 (training, n = 3418; validation, n = 413; test, n = 443). Internal validation used Dataset 2 from our institution (n = 1996; January-April 2024), and external validation used 2809 publicly available thin-slice CT examinations. Model performance was evaluated using the Dice similarity coefficient (DSC), Hausdorff distance (HD), and volume similarity (VS). For normative modeling, spleen volumes from 578 healthy adults on portal venous phase CT were analyzed, and candidate prediction variables were assessed using correlation and regression analyses.

Results:

Segmentation performance was high on the test set {DSC, 0.988 (0.984 - 0.989) [median (IQR)]; VS, 0.997 (0.994 - 0.999); HD, 0.017 (0.014 - 0.021)} and remained robust on external validation [DSC, 0.982 (0.974 - 0.987)]. Volume agreement analyses showed a mean absolute error of 1.945 mL (test set), 3.829 mL (internal validation), and 5.806 mL (external validation). In the cohort of 578 adults, the spleen volumes ranged from 51.09 to 644.38 cm³, with a median of 177.90 cm³. The median (IQR) of the x-, y-, and z-axis diameters were 8.71 (7.97 - 9.53) cm, 9.20 (8.20 - 10.46( cm, and 9.10 )8.00 - 10.30( cm, respectively. Age (r = -0.24, P < 0.0001) and gender (male = 0, female = 1; r = -0.32, P < 0.0001) were negatively correlated with splenic volume (SV), while height (r = 0.35, P < 0.0001), weight (W; r = 0.45, P < 0.0001), Body Mass Index (BMI; r = 0.32, P < 0.0001), and body surface area (BSA; r = 0.46, P < 0.0001) were positively correlated with SV. Based on thin-slice portal venous phase CT images, a bidirectional stepwise selection procedure identified body surface area (BSA) and age as significant predictors. The final model was: log (SSV) = 3.708 + 0.987 × BSA − 0.00629 × Age (R² = 0.269).

Conclusion:

A 3D V-Net model enabled accurate automated spleen segmentation with consistent performance across internal and external validation cohorts. An SSV prediction model based on BSA and age provides a population-specific reference for quantitative spleen volumetry in Chinese adults.

1. Background

The spleen is an essential organ implicated in immunity and hematopoiesis. Its volume is variable and correlates with multiple disorders. Esophageal variceal bleeding results in a death rate of 25% to 35% in patients with decompensated liver cirrhosis. Research indicates that splenomegaly serves as an independent predictor of this issue (1-5). Chronic dysfunctions of the digestive, circulatory, and immunological systems, together with acute viral infections, arterial embolism, and connective tissue disorders, might influence spleen volume. Moreover, age, height, weight, and gender significantly influence spleen volume (6, 7). Computed tomography (CT) imaging can identify both diffuse and localized density irregularities in the spleen. The quantitative assessment of spleen volume by CT closely corresponds with actual measurements (8, 9). Radiologists typically diagnose splenomegaly using semi-quantitative criteria, most commonly a transverse splenic diameter exceeding five rib units on axial CT. This technique may neglect minor alterations in spleen volume, leading to erroneous assessments regarding the initial advancement of the disease and inadequate decision-making. Establishing the normal range of spleen volume and creating standardized volume prediction models are essential for assessing splenomegaly and monitoring disease progression (10, 11). Artificial intelligence (AI) in medical imaging has led to deep learning segmentation models for the precise segmentation of parenchymal organs such as the pancreas, prostate, kidney, and musculoskeletal system (12-16). Automatic organ dimension, density, and volume measurement is possible with this approach. This technique provides objective, measurable clinical diagnostic evidence that surpasses qualitative analysis. This study is reported in accordance with the CLAIM 2024 Update for AI in medical imaging and the TRIPOD+AI 2024 statement for prediction model studies using regression or machine-learning methods; completed checklists are provided in the Supplementary Materials (17, 18).

2. Objectives

This project aims to develop a deep learning-based automated segmentation model for normal adult spleens, enabling precise, automated quantification of splenic diameter, volume, and CT values. We will establish a normative model for predicting adult splenic volume in the Chinese population via correlation analyses with anthropometric parameters (age, height, and weight). This work will provide valuable clinical tools for the quantitative evaluation of splenomegaly and monitoring of disease progression in clinical settings.

3. Patients and Methods

3.1. Patients’ Enrollment
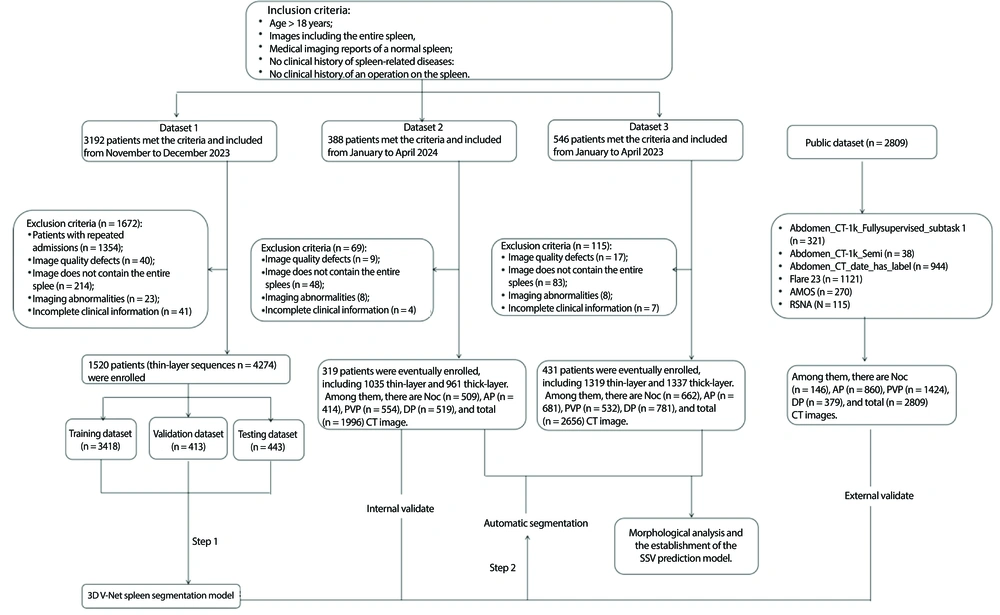
This retrospective study was approved by the institutional review board [No. 2024 (222-004)]. We retrospectively collected abdominal CT examinations performed at our institution between January 2023 and April 2024, including both non-contrast CT (NCCT) and contrast-enhanced CT (CECT), and identified cases with clinical and imaging evidence of a “normal” spleen. Inclusion criteria were: (1) Age ≥ 18 years; (2) CT coverage of the entire spleen; (3) radiology reports confirming a normal spleen; and (4) no history of splenic disease or conditions associated with splenomegaly/hypersplenism (e.g., hematologic disorders such as aplastic or hemolytic anemia, hereditary spherocytosis, leukemia, lymphoma, macroglobulinemia, or myelofibrosis) and no prior splenic surgery. Exclusion criteria were: (1) Incomplete examinations, insufficient scan range, or severe respiratory motion artifacts; (2) postsplenectomy status or marked splenic deformity; (3) abnormalities on image re-review (e.g., abnormal splenic structure or attenuation, or suspected focal lesions); and (4) incomplete clinical information. Eligible examinations were organized into three datasets: Dataset 1 (n = 4274) for spleen segmentation model development (training n = 3418; validation n = 413; test n = 443), Dataset 2 (n = 1996) for internal validation. Dataset 2 and Dataset 3 (n = 2656) were used as the candidate pool for morphometric analyses and standard spleen volume (SSV) modeling; after applying the above criteria and restricting analyses to portal venous phase imaging, 578 healthy adults were included for SSV model development. In the inpatient-derived cohort, some individuals had multiple admissions; therefore, we deduplicated records by retaining a single examination per patient. The overall enrollment, exclusions, dataset usage, and institutional cohort characteristics are summarized in Figure 1 and Supplementary Table S1.
Flowchart of patient enrollment and dataset allocation for model development and evaluation. Abbreviations: NOC, non-contrast; AP, arterial phase; PVP, portal venous phase; DP, delayed phase; SSV, standard spleen volume.
Figure 1.

Flowchart of patient enrollment and dataset allocation for model development and evaluation. Abbreviations: NOC, non-contrast; AP, arterial phase; PVP, portal venous phase; DP, delayed phase; SSV, standard spleen volume.

3.2. Parameters for CT Acquisition

CT imaging was performed using eight multidetector CT scanner models at our institution: Siemens SOMATOM Definition Flash, Siemens SOMATOM Drive, Siemens SOMATOM Force, GE Discovery CT750HD, GE Optima CT680 Expert, GE Revolution CT, Philips iCT 256, and Neusoft NeuViz Prime. Examinations included non-contrast (NOC) and contrast-enhanced acquisitions across multiple phases, including arterial phase (AP), portal venous phase (PVP), and delayed phase (DP). Imaging parameters included slice thicknesses of 5 mm/3 mm (thick) and ≤ 1.25 mm (thin), a matrix size of 512 × 512, tube voltage of 80 - 140 kVp, tube current of 150 - 350 mAs, and a gantry rotation time of 0.5 - 0.8 s. Imaging characteristics available from the public releases (including slice thickness and contrast phase when provided) are summarized in Supplementary Table S2.

3.3. Training the Segmentation Model Using Dataset 1

Abdominal CT spleen images in Dataset 1 (n = 4274) were annotated using ITK-SNAP software (version 3.6.0). Two experienced radiologists manually contoured the spleen slice by slice, excluding adjacent structures (splenic vein, splenic artery, diaphragm, gastric wall, and intestinal tract) and precisely outlining the irregularly lobulated splenic margin. Discrepancies were resolved by consensus review, and the final reference mask for each case was saved only after joint confirmation by both readers. Dataset 1 was randomly split into training (n = 3418), validation (n = 413), and test (n = 443) sets for model development and evaluation.

3.4. Anthropometric Parameters

The Body Mass Index (BMI) is calculated using the formula BMI = W/H², where W is weight in kilograms and H is height in meters. Body surface area (BSA) is computed using the Stevenson formula, adjusted for Chinese body types: BSA (m²) = 0.0061height (cm) + 0.0124weight (kg)-0.0099 (19). According to Chinese BMI assessment guidelines for adults 18 and older, the classes are as follows: A healthy range is 18.5 kg/m² ≤ BMI < 24.0 kg/m², with underweight being BMI < 18.5 kg/m², overweight being 24.0 ≤ BMI < 28.0 kg/m², and obesity being BMI ≥ 28.0 kg/m².

3.5. Model Training

A 3D V-Net architecture with an Nvidia Tesla P100 16G GPU (Nvidia Corporation, Santa Clara, CA) and PyTorch v1.7.1 + cu110 (https://pytorch.org/) served as the foundation for this investigation. The model takes CT scans as input and returns three-dimensional diameters, average CT values, and spleen volume. Image preprocessing included downsizing to 128 px × 192 px × 256 px, adjusting the window (center 30 HU, width 300 HU), and enhancing the image with techniques such as noise injection, denoising, rotation, and shearing. Batch size 6, learning rate 0.0001, and epoch 400 were the training settings.

3.6. Evaluation of the Segmentation Model
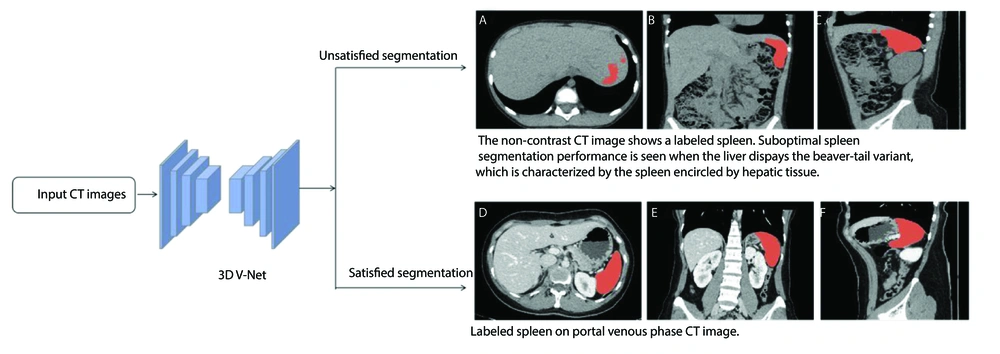
The spleen segmentation model was evaluated using both objective and subjective metrics. Objective performance for the training and test sets was quantified using Hausdorff distance (HD), volume similarity (VS), and Dice similarity coefficient (DSC), standard metrics for assessing segmentation accuracy. For subjective evaluation, two experienced radiologists reviewed segmentation outputs from the external validation cohort, focusing on complete inclusion of the entire splenic parenchyma (ensuring that no functional splenic tissue was missed), accurate exclusion of adjacent non-splenic structures (diaphragm, gastric wall, intestines, splenic artery, and splenic vein), and boundary fidelity: Segmentation was classified as under-segmented if the missed splenic volume exceeded 5% of the total splenic volume and over-segmented if extraneous labeling outside the splenic margin exceeded 5% of the total splenic volume. Suboptimally segmented images (either under- or over-segmented) were manually corrected to generate final segmentation masks. Figure 2 displays the visual results of satisfactory and unsatisfactory segmentation, respectively. External validation was performed using 2809 public CT examinations from AbdomenCT-1K, FLARE23, AMOS, and RSNA. Dataset-stratified performance is reported in Supplementary Table S3.
3D V-Net–based automatic spleen segmentation workflow and representative satisfactory/unsatisfactory examples.
Figure 2.

3D V-Net–based automatic spleen segmentation workflow and representative satisfactory/unsatisfactory examples.

3.7. Quantitative Measurement of the Spleen in Dataset 2 and Dataset 3

The CT series in Dataset 2 (n = 1996) and Dataset 3 (n = 2656) underwent automated spleen segmentation using the trained model to obtain spleen masks and volumetric measurements. Dataset 2 was used for internal validation of segmentation and volume estimation. Dataset 3 served as the institutional candidate pool for morphometric analyses and SSV modeling; after applying the predefined eligibility criteria and restricting to portal venous phase imaging, 578 healthy adults were included for normative modeling.

3.8. Statistical Analysis

All statistical analyses were performed using R (version 4.4.2; R Foundation for Statistical Computing, Vienna, Austria). A significance level was set at α = 0.05 (P < 0.05 indicating significant differences). Measurement data with a normal distribution were reported as mean ± standard deviation, while skewed data were presented as median [interquartile range]. An independent-samples t-test was conducted for comparisons of two independent samples, contingent upon the fulfillment of normality assumptions; if these assumptions were not met, the Mann-Whitney U rank test was employed. For multiple-group comparisons, one-way analysis of variance (ANOVA) was applied if data were normally distributed and passed homogeneity of variance tests; otherwise, the Kruskal-Wallis H test was utilized. Pearson correlation was used to examine relationships between normally distributed variables and spleen volume. Agreement between AI-derived and reference volumes was evaluated using Bland-Altman analysis (mean bias and 95% limits of agreement), along with the mean absolute error (MAE) and plots of absolute error versus true volume. Spleen volume distribution was assessed using descriptive statistics and graphical methods. Linear regression was used to model spleen volume as a function of candidate anthropometric and demographic predictors (age, height, weight, BMI, and BSA). Candidate variable selection for prediction was performed using bidirectional stepwise regression with Akaike Information Criterion optimization, and multicollinearity was evaluated using variance inflation factors. Model assumptions were assessed using residual diagnostics, including graphical evaluation of normality and homoscedasticity and formal testing where appropriate. Because residual diagnostics indicated violations of normality and constant variance, the response variable was log-transformed, and the final model was fitted on the log scale. Model performance was summarized using R², adjusted R², and root mean square error. Internal validation was performed using 1,000 bootstrap resamples to estimate optimism-corrected performance metrics and model shrinkage. Calibration was evaluated descriptively using observed-versus-predicted plots on the log scale, with calibration intercept and slope interpreted cautiously due to in-sample assessment. Regression coefficients from the log-linear model were exponentiated to provide multiplicative interpretations on the original volume scale. Sensitivity analyses compared reduced models, and interaction terms were tested to assess effect modification by sex.

4. Result

4.1. Evaluation of the Spleen Segmentation Model

Table 1 Objective evaluation results of the spleen segmentation model. Table 1 summarizes the objective evaluation of the segmentation model across the test, internal validation, and external validation cohorts. In the external validation set (n = 2809), the model maintained strong and consistent performance, with a DSC of 0.982 [0.974, 0.987] [median (IQR)], a HD of 0.018 [0.012, 0.027] mm [median (IQR)], and a VS of 0.995 [0.989, 0.998] [median (IQR)]. Patient-level segmentation results are further detailed in Table 2, and agreement of AI-derived spleen volumes with the manual reference standard, reported as mean absolute error (MAE) and relative error (%), is presented in Table 3; volume agreement and error characteristics are additionally illustrated in Figure 3A-F. Overall, segmentation performance differed significantly across datasets (P < 0.001).
Table 1.Objective Evaluation Results of the Spleen Segmentation Model a
VariablesExternal validation set; (N = 2809)Internal validation set (N = 1996)Test set; (N = 443)Training set (N = 3418)Validate set (N = 413)StatisticP-value
DSC0.982 [0.974, 0.987]0.979 [0.974, 0.983]0.988 [0.984, 0.989]0.988 [0.986, 0.990]0.988 [0.985, 0.989]2684.469< 0.001
VS0.995 [0.989, 0.998]0.990 [0.986, 0.994]0.997 [0.994, 0.999]0.998 [0.996, 0.999]0.997 [0.995, 0.999]2381.773< 0.001
HD0.018 [0.012, 0.027]0.019 [0.015, 0.026]0.017 [0.014, 0.021]0.015 [0.013, 0.018]0.016 [0.014, 0.020]388.389< 0.001

Abbreviations: DSC, dice similarity coefficient; VS, volume similarity; HD, Hausdorff distance; Q1, quartile 1; Q3, quartile 3.

a Values are expressed as median [Q1, Q3].

Table 2.Patient-Level Segmentation Metrics a
DataSetNo. of PatientsDSCVSHD
Test set1660.9876 (0.9864, 0.9879)0.9971 (0.9965, 0.9975)0.0170 (0.0160, 0.0179)
Internal validation3190.9791 (0.9788, 0.9796)0.9911 (0.9906, 0.9917)0.0192 (0.0184, 0.0198)
External validation28090.9817 (0.9813, 0.9822)0.9946 (0.9944, 0.9948)0.0181 (0.0177, 0.0184)

Abbreviations: DSC, Dice similarity coefficient; VS, volume similarity; HD, Hausdorff distance; CI, confidence interval.

a Values are expressed as median (95% CI of the median; bootstrap).

Table 3.MAE and Relative Error (%) for Volume Estimates a
DataSetMAERelative-error-percentage
Test set1.9450.900
Internal validation3.8292.122
External validation5.8062.924

Abbreviation: MAE, mean absolute error.

a Mean absolute error (MAE) and relative error (%) for volume estimates. MAE is reported in milliliters (cm³). Relative error is |AI − reference| / reference × 100%.
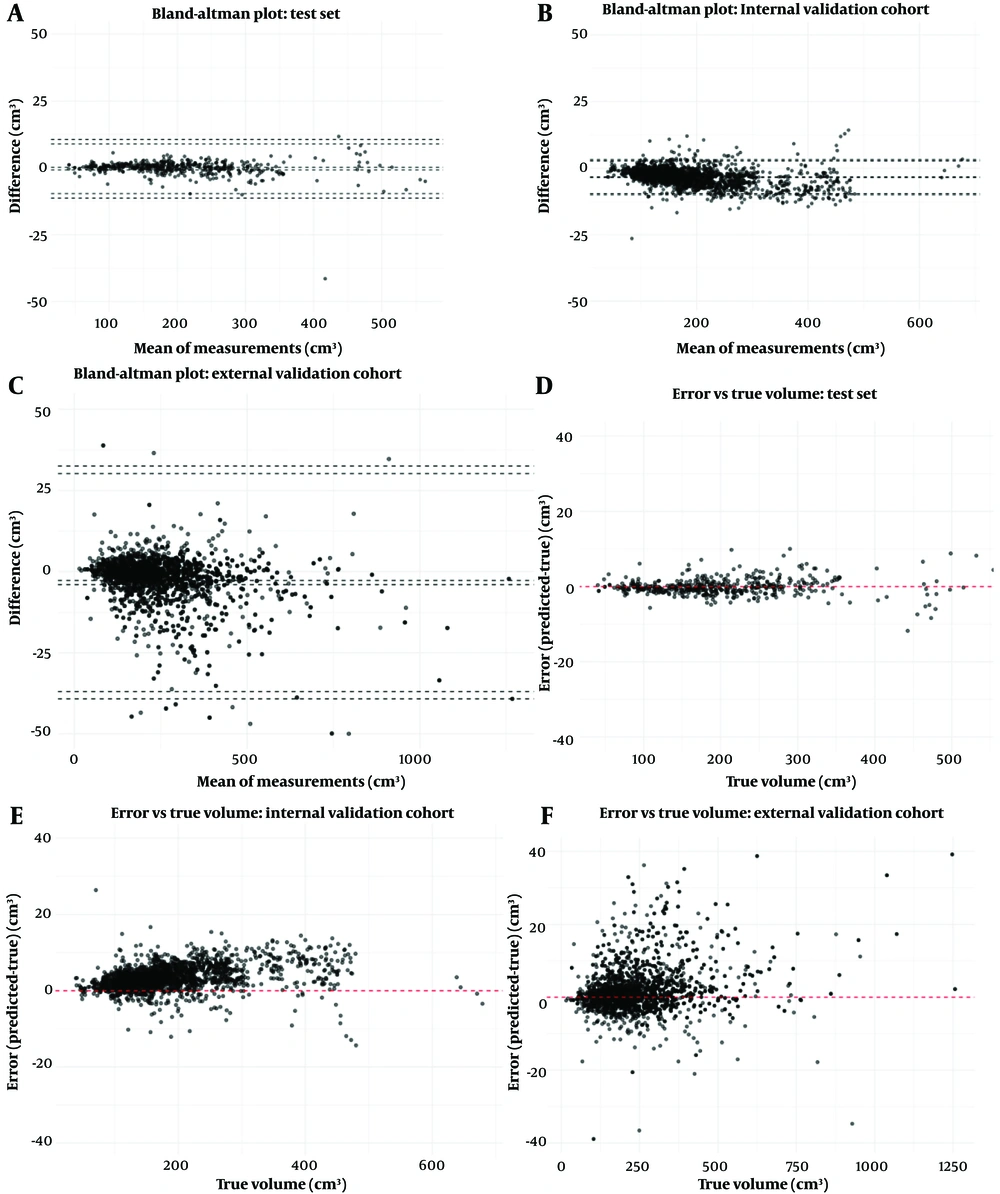
Volume agreement and error characteristics of AI-derived spleen volumetry versus the manual reference. A-C, Show Bland-Altman plots comparing AI-derived spleen volumes (computed from the predicted segmentation masks) with volumes from radiologist-confirmed reference masks in the test set (n = 443; A), internal validation cohort (n = 1996; B), and external validation cohort (n = 2809; C). Each point represents one CT examination. The central solid line indicates the mean bias (AI-reference), and the upper and lower dashed lines indicate the 95% limits of agreement (mean bias ± 1.96 SD), allowing assessment of systematic bias and dispersion across the volume range. D-F, Plot absolute volume error versus the manual reference volume for the test set (n = 443; D), internal validation cohort (n = 1996; E), and external validation cohort (n = 2809; F). These panels illustrate whether volume error varies with spleen size (e.g., heteroscedasticity or increased error at larger volumes) and complement the Bland–Altman analyses. Quantitative volume agreement statistics (MAE and relative error) for all cohorts are reported in <a href="#A168436TBL3">Table 3</a>.
Figure 3.

Volume agreement and error characteristics of AI-derived spleen volumetry versus the manual reference. A-C, Show Bland-Altman plots comparing AI-derived spleen volumes (computed from the predicted segmentation masks) with volumes from radiologist-confirmed reference masks in the test set (n = 443; A), internal validation cohort (n = 1996; B), and external validation cohort (n = 2809; C). Each point represents one CT examination. The central solid line indicates the mean bias (AI-reference), and the upper and lower dashed lines indicate the 95% limits of agreement (mean bias ± 1.96 SD), allowing assessment of systematic bias and dispersion across the volume range. D-F, Plot absolute volume error versus the manual reference volume for the test set (n = 443; D), internal validation cohort (n = 1996; E), and external validation cohort (n = 2809; F). These panels illustrate whether volume error varies with spleen size (e.g., heteroscedasticity or increased error at larger volumes) and complement the Bland–Altman analyses. Quantitative volume agreement statistics (MAE and relative error) for all cohorts are reported in Table 3.

4.2. Analysis of Spleen Morphometric Parameters

Table 4 Baseline characteristics of participants included in SSV model development (n = 578) Table 4 summarizes the baseline characteristics of the 578 participants included for SSV model development. Out of 578 eligible individuals, 283 were female (48.96%) and 295 were male (51.04%). Significant differences were observed in height, weight, BMI, and BSA between the two groups (P < 0.05), although age differences were not significant (P > 0.05). This study calculated spleen volume, CT values (density), and three-dimensional dimensions using the automated spleen segmentation model. Thin-slice and thick-slice spleen volumes correlated significantly throughout the portal venous phase (PVP) using linear regression. A significant linear correlation was observed between spleen volumes with varying thick slices (r = 0.9946, P < 0.0001). The correlation equation is expressed as y = 1.013x + 1.519, with y representing the thin-slice volume and x denoting the thick-slice volume. The distribution of thin-slice PVP spleen volume (SV), CT values, and three-dimensional dimensions across BMI groups (Table 5) showed significant differences (P < 0.05). Table 6 and Figure 4 provide intergroup comparisons of SV and three-dimensional dimensions (x, y, and z axes) in thin-slice imaging non-contrast (NOC), arterial phase (AP), portal venous phase (PVP), and delayed phase (DP) sequences.
Table 4.Baseline Characteristics of Participants Included in SSV Model Development (n = 578) a
VariablesTotal (n = 578)F (n = 283)M (n = 295)StatisticP-value
Age (y)56.00 [44.00, 64.00]56.00 [46.00, 64.00]56.00 [41.00, 64.50]-0.340.734
Height (cm)167.00 [160.00, 172.00]160.00 [158.00, 164.00]172.00 [170.00, 176.00]-18.32< 0.001
Weight (kg)66.00 [60.00, 75.00]60.00 [55.00, 66.00]74.00 [66.00, 80.00]-13.26< 0.001
BSA (m²)1.83 [1.71, 1.96]1.72 [1.65, 1.81]1.95 [1.86, 2.06]-15.71< 0.001
BMI (kg/m²)24.22 [22.03, 26.47]23.44 [21.48, 25.94]24.86 [22.58, 26.86]12.160.007
BMI < 18.5 kg/m²15 (2.60)10 (3.53)5 (1.69)--
18.5 kg/m² ≤ BMI < 24.0 kg/m²258 (44.64)144 (50.88)114 (38.64)--
24.0 kg/m² ≤ BMI < 28.0 kg/m²229 (39.62)97 (34.28)132 (44.75)--
BMI ≥ 28.0 kg/m²76 (13.15)32 (11.31)44 (14.92)--

Abbreviations: BMI, Body Mass Index; BSA, body surface area; SD, standard deviation; SSV, standard spleen volume; Q1, quartile 1; Q3, quartile 3.

a Values are expressed as mean ± SD or median [Q1, Q3].

Table 5.Distribution of Spleen Volume, CT Values, and Three-Dimensional Diameters Among Different Body Mass Index Groups a
VariablesTotal; (n = 578)BMI < 18.5 kg/m²; (n = 15)18.5 ≤ BMI < 24.0 kg/m²; (n = 258)24.0 ≤ BMI < 28.0 kg/m²; (n = 229)BMI ≥ 28.0 kg/m² (n = 76)StatisticP-value
Volume (cm³)195.82 ± 85.04175.46 ± 75.01168.76 ± 69.03212.82 ± 85.31240.50 ± 103.1221.01< 0.001
CT Value (HU)101.72 ± 14.00110.40 ± 13.51105.77 ± 13.9898.75 ± 12.9195.22 ± 12.5519.74< 0.001
x (cm)8.71 [7.97, 9.53]8.35 [7.52, 8.92]8.30 [7.50, 8.90]9.10 [8.33, 9.69]9.93 [8.72, 10.43]107.08< 0.001
y (cm)9.20 [8.20, 10.46]8.55 [7.59, 9.09]8.91 [7.88, 9.92]9.50 [8.48, 10.83]9.88 [8.66, 11.06]33.03< 0.001
z (cm)9.10 [8.00, 10.30]9.17 [8.39, 10.35]8.80 [7.62, 9.80]9.30 [8.20, 10.60]9.50 [8.30, 10.63]20.94< 0.001

Abbreviations: BMI, Body Mass Index; HU, Hounsfield unit; Q1, quartile 1; Q3, quartile 3; SD, standard deviation.

a Values are expressed as mean ± SD or median [Q1, Q3].

Table 6.Distribution of Spleen Volume, CT values, and Three-Dimensional Diameters in Different Phases a
VariablesTotal (n=2354)NOCAPPVPDP
Male; (n=1245)Female; (n=1109)Statistic (P-value)Male; (n=308)Female; (n=266)Statistic (P-value)Male (n=276)Female; (n=284)Statistic (P-value)Male (n=295)Female; (n=283)Statistic (P-value)Male; (=366)Female; (n=276)Statistic (P-value)
CT value (HU)80.76 [54.92, 97.19]89.32 [55.03, 110.5]570894 (< 0.001)46.59 [43.07, 50.2]45.34 ± 4.546159 (0.01)102.34 [93.78, 110.93]114.99 [104.59, 126.08]20722 (< 0.001)96.08 [88.96, 103.48]105.6 [96.26, 114.75]25640 (< 0.001)73.83 [67.89, 80.14]80.09 [73.19, 85.09]35210 (< 0.001)
Volume (cm³)202.74 [160.43, 260.52]149.92 [119.64, 192.66]979201 (< 0.001)200.40 [154.66, 252.56]143.98 [115.89, 191.18]57546 (< 0.001)203.08 [158.06, 256.03]148.37 [118.93, 185.02]55890 (< 0.001)203.80 [161.65, 261.21]158.33 [122.88, 199.80]58463 (< 0.001)205.13 [166.90, 267.31]149.97 [120.84, 194.99]72441 (< 0.001)
x (cm)9.17 [8.41, 9.87]8.32 [7.59, 9.08]961649.5 (< 0.001)9.09 ± 1.218.25 ± 1.128.61 (< 0.001)9.08 ± 1.108.28 [7.53, 8.98]54463 (< 0.001)9.14 ± 1.128.31 [7.53, 9.15]57770 (< 0.001)9.26 ± 1.068.46 ± 1.059.52 (< 0.001)
y (cm)9.62 [8.47, 10.90]8.90 [7.72, 9.93]867135.5 (< 0.001)9.59 [8.50, 10.80]8.86 [7.66, 10.01]51623.5 (< 0.001)9.71 ± 1.908.87 [7.72, 9.85]49464 (< 0.001)9.62 [8.50, 10.89]8.96 [7.84, 9.89]52142 (< 0.001)9.74 ± 1.928.97[7.67,10.05]63098.5 (< 0.001)
z (cm)9.43 ± 1.858.50 [7.52, 9.52]881738.5 (< 0.001)9.31 ± 1.818.45 [7.50, 9.50]51987 (< 0.001)9.44 ± 1.828.45 [7.50, 9.50]51171 (< 0.001)9.54 ± 1.908.70 [7.69, 9.70]52175 (< 0.001)9.43 ± 1.868.40 [7.50, 9.52]65141.5 (< 0.001)

Abbreviations: HU, hounsfield unit; Q1, quartile 1; Q3, quartile 3; SD, standard deviation; NOC, non-contrast; AP, arterial phase; PVP, portal venous phase; DP, delayed phase.

a Values are expressed as mean±SD or median [Q1, Q3].
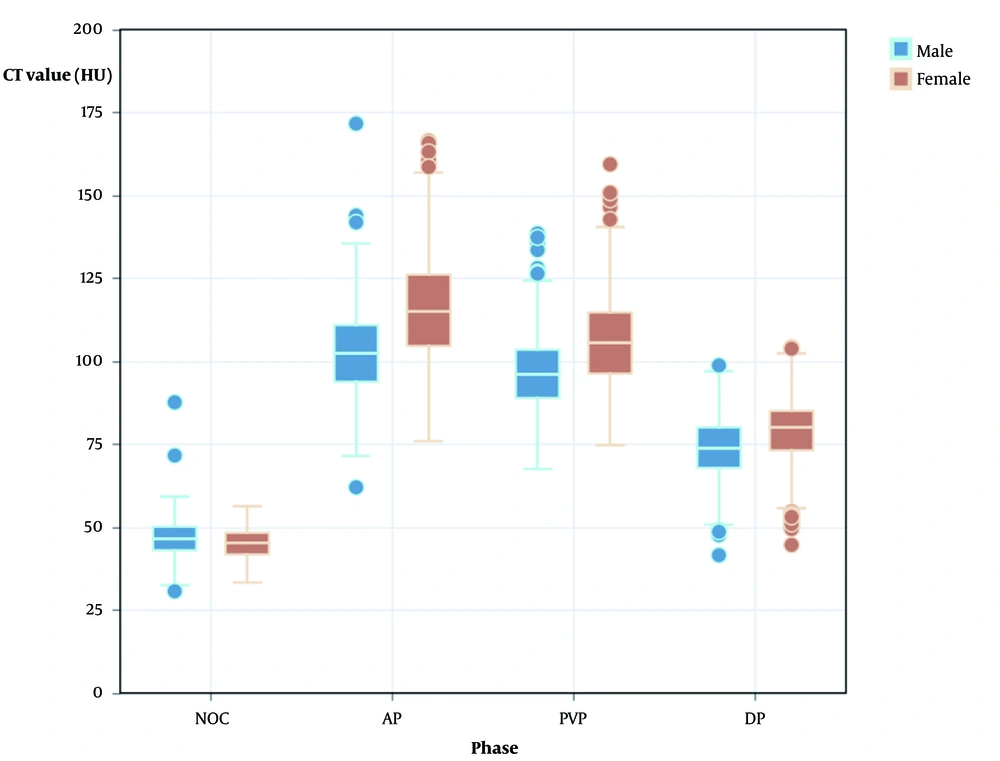
Average CT values (HU) on contrast-enhanced CT across different phases in males and females. Across all contrast-enhanced spleen CT phases, males exhibited significantly lower mean splenic attenuation than females (P &lt; 0.05). Abbreviations: HU, Hounsfield unit; NOC, non-contrast; AP, arterial phase; PVP, portal venous phase; DP, delayed phase.
Figure 4.

Average CT values (HU) on contrast-enhanced CT across different phases in males and females. Across all contrast-enhanced spleen CT phases, males exhibited significantly lower mean splenic attenuation than females (P < 0.05). Abbreviations: HU, Hounsfield unit; NOC, non-contrast; AP, arterial phase; PVP, portal venous phase; DP, delayed phase.

4.3. Standard Adult Spleen Volume Prediction Model
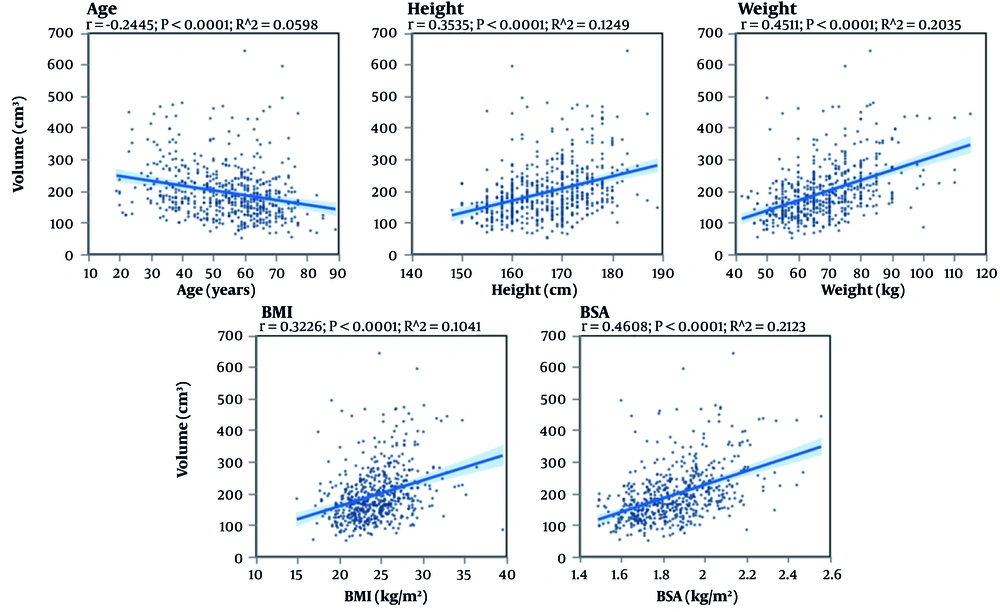
Thin-slice CT portal venous phase images were used to assess relevant factors affecting spleen volume in healthy patients using simple linear regression analysis (Figure 5). A total of 578 healthy individuals were included. Spleen volume demonstrated substantial right skewness, prompting log transformation for modeling. Bidirectional stepwise selection identified BSA and age as the strongest predictors of spleen volume. The final log-linear model was: log (SSV) = 3.708 + 0.987 × BSA - 0.00629 × Age, and its back-transformed multiplicative form for clinical application: SSV = 40.79 × (2.682) BSA × (0.994) Age, where spleen volume is measured in milliliters (cm³), BSA in m², and age in years. In this model, each 1-m² increase in BSA multiplied expected spleen volume by 2.682 (168.2% increase), while each additional year of age was associated with a 0.6% decrease. The model explained 26.9% of the variance on the log scale (R² = 0.269) and demonstrated stable performance after bootstrap internal validation (optimism-corrected R² = 0.261). Residual diagnostics indicated approximate normality and homoscedasticity after transformation. Descriptive calibration analysis showed close agreement between observed and predicted values without evidence of systematic bias. No significant interactions with sex were observed, and sensitivity analyses confirmed the superiority of the BSA plus age model over reduced alternatives. Detailed model diagnostics, validation procedures, and additional analyses are provided in Supplementary Tables S4-S10 and Supplementary Figures S1-S12.
A correlation study was performed on the determinants affecting spleen volume in healthy persons, listed in the following sequence: Age, height, body weight, Body Mass Index (BMI), and body surface area (BSA).

Figure 5.

A correlation study was performed on the determinants affecting spleen volume in healthy persons, listed in the following sequence: Age, height, body weight, Body Mass Index (BMI), and body surface area (BSA).

5. Discussion

This study developed and validated a 3D V-Net framework based on deep learning for the automated segmentation of the spleen from routine CT scans. The model consistently performed well across three different validation cohorts: An internal test set, an independent institutional validation set, and a large external validation set from public datasets. In addition to assessing overlap and surface metrics, we evaluated the agreement between the segmented volumes and radiologist-confirmed reference masks (Figure 3A-F; Table 3), which further supports the use of automated segmentation for accurate spleen volumetry. Building on this, we established a population-specific SSV prediction model for healthy Chinese adults using key physiological factors such as BSA and age, providing an individualized reference for spleen volume assessment. Given the distinct baseline anthropometrics of Chinese individuals compared with other populations, our SSV calculation provides a particularly relevant reference for Chinese adults. Spleen volume measurement is of considerable importance in clinical practice, as alterations in spleen volume can be utilized to monitor treatment responses and predict prognoses in patients receiving maintenance chemotherapy for malignant tumors, immunotherapy for metastatic tumors, and post-transcatheter arterial chemoembolization (TACE) for hepatocellular carcinoma. In patients with uremia undergoing peritoneal dialysis, those exhibiting severe liver fibrosis, and individuals experiencing esophageal variceal bleeding, the measurement of spleen volume contributes to the stratification of disease risk (20-25). Therefore, accurate measurement of spleen volume is essential for personalized diagnostic and therapeutic decision-making. This study's model exhibits superior segmentation performance on the training dataset, establishing a basis for its application in complex clinical scenarios. This study developed a spleen segmentation model for thin-slice CT images using a 3D V-Net architecture, enabling automated spleen segmentation across a large sample cohort. It employed thin-slice PVP CT images for spleen volume analysis because of their superior organ contrast, extensive scanning coverage, and distinct thin-slice reconstruction capabilities. Subsequent analysis revealed a significant correlation between spleen volumes derived from thin-slice and thick-slice CT images — meaning that in the absence of thin-slice data, conventional spleen volume prediction models can still assess volume normality by leveraging this correlation with thick-slice-derived volumes. Across all phases of contrast-enhanced spleen CT, males exhibited a significantly lower average CT value than females (P < 0.05), consistent with findings from a previous study (26). Most prior deep learning-based spleen segmentation studies focused on populations in which spleen volume might be affected, such as patients with liver fibrosis or those undergoing peritoneal dialysis (24, 25) — and rarely included systematic analyses of spleen morphological traits or their association with physiological parameters. In contrast, this study marks the first application of such an approach to a healthy cohort, examining how these physiological variables correlate with spleen volume. Consistent with prior research, linear regression analysis showed significant correlations between adult spleen volume and age, gender, weight, height, BSA, and BMI (all P < 0.05) (27-30). The study conducted a BMI-stratified analysis to investigate factors affecting spleen volume, revealing statistically significant differences in volume among BMI categories (P < 0.05). Adult males had a significantly larger median spleen volume (203.80 cm³) than females (158.33 cm³, P = 0.005), a result consistent with the findings reported by other authors (28, 29).
Moreover, age showed a negative association with spleen volume, a trend likely due to age-related organ atrophy, as supported by extensive prior research (12, 14, 29, 31, 32). Existing evidence indicates that spleen volume varies with population characteristics and anthropometric factors, and differences across countries and ethnic groups have been reported (33-35). Therefore, using fixed linear cutoffs (e.g., a single spleen-length threshold) as universal criteria for splenomegaly may not adequately account for inter-individual differences in body size and may lead to misclassification (27, 36). CT-based volumetric studies further show that although single linear measurements can be convenient for rapid screening, they are sensitive to splenic morphology and spatial orientation. Because enlargement may occur in a multidirectional and irregular manner, linear surrogates can deviate from true volume in a systematic way (37). These observations support threshold strategies that incorporate covariates such as age, sex, and BMI rather than relying on a single “one-size-fits-all” length cutoff (34). In addition, automated volumetry offers a practical route to clinical implementation. Prior work has demonstrated automated spleen volume analysis for splenomegaly detection and grading (10), and later large-scale opportunistic screening studies using deep learning–based segmentation established workflows that link automated volumetry to weight-adjusted volumetric thresholds for initial screening (27). Related studies also suggest that volumetric metrics may provide incremental value over two-dimensional measurements for risk assessment and longitudinal monitoring in chronic liver disease settings (38, 39). Against this background, the present study focuses on population calibration by developing an SSV prediction model for healthy Chinese adults, acknowledging potential baseline anthropometric differences from previously reported Western cohorts (34). Consistent with a physiology-driven framework, BMI-stratified analyses in our cohort showed statistically significant differences in spleen volume across BMI categories (P < 0.05). With respect to future implementation, the proposed “automated segmentation + SSV prediction” approach can be used in opportunistic screening by quantifying the deviation of observed spleen volume from the individualized SSV (e.g., as a percent deviation on the original scale), thereby enabling an interpretable assessment of whether spleen volume exceeds the expected range without reliance on a single linear cutoff. Future work in disease-enriched cohorts (e.g., cirrhosis/portal hypertension and hematologic disorders) should evaluate these SSV-referenced deviation metrics against established weight-based volumetric thresholds and commonly used linear indices to define clinically useful screening cutoffs and operating points (37). This research has several limitations: The single-center design risks introducing selection bias, and the uneven age distribution may compromise the generalizability of the results — subsequent multicenter, multi-population, large-sample studies will be essential to enhance the universality of the conclusions. The study included only adults aged 18 - 89 years, so the SSV formula may not apply to children or adolescents. Model efficacy also requires validation through prospective studies to confirm its diagnostic utility for early splenomegaly. Additionally, the model was developed for individuals with morphologically normal spleens and has limited adaptability to anatomical variants (e.g., splenohepatic wrapping associated with beaver tail liver) or pathological conditions; incorporating more complex clinical scenarios will be key to improving the algorithm’s robustness. Given these limitations, the clinical application of the study’s conclusions should be approached cautiously. Moreover, these findings point to future research directions: Expanding sample diversity, integrating multi-source data, and strengthening algorithm validation in complex clinical settings.
In conclusion, the deep learning-based 3D V-Net spleen segmentation model functions as an effective tool for accurately quantifying spleen characteristics, including volume, CT values, and three-dimensional diameters. The SSV formula presented [log (SSV) = 3.708 + 0.987 × BSA − 0.00629 × Age (R² = 0.269)] and the reference range for normal spleen size offer quantitative benchmarks tailored to the Chinese population, which can aid in identifying splenomegaly. By incorporating variables such as age, gender, and body weight, the model enables personalized prediction of spleen volume, providing a foundation for clinical decision-making. Future research should focus on improving the model’s efficacy in complex scenarios (e.g., anatomical variants or pathological conditions) and advancing the clinical application of quantitative imaging for evaluating splenic diseases.

Footnotes

References

  • 1.
    Berzigotti A, Zappoli P, Magalotti D, Tiani C, Rossi V, Zoli M. Spleen enlargement on follow-up evaluation: a noninvasive predictor of complications of portal hypertension in cirrhosis. Clin Gastroenterol Hepatol. 2008;6(10):1129-34. [PubMed ID: 18619917]. https://doi.org/10.1016/j.cgh.2008.05.004.
  • 2.
    Graham DY, Smith JL. The course of patients after variceal hemorrhage. Gastroenterology. 1981;80(4):800-9. [PubMed ID: 6970703].
  • 3.
    Chalasani N, Imperiale TF, Ismail A, Sood G, Carey M, Wilcox CM, et al. Predictors of large esophageal varices in patients with cirrhosis. Am J Gastroenterol. 1999;94(11):3285-91. [PubMed ID: 10566731]. https://doi.org/10.1111/j.1572-0241.1999.1539_a.x.
  • 4.
    Thomopoulos KC, Labropoulou-Karatza C, Mimidis KP, Katsakoulis EC, Iconomou G, Nikolopoulou VN. Non-invasive predictors of the presence of large oesophageal varices in patients with cirrhosis. Dig Liver Dis. 2003;35(7):473-8. [PubMed ID: 12870732]. https://doi.org/10.1016/s1590-8658(03)00219-6.
  • 5.
    Lewis SM, Williams A, Eisenbarth SC. Structure and function of the immune system in the spleen. Sci Immunol. 2019;4(33). [PubMed ID: 30824527]. [PubMed Central ID: PMC6495537]. https://doi.org/10.1126/sciimmunol.aau6085.
  • 6.
    Nemati M, Hajalioghli P, Jahed S, Behzadmehr R, Rafeey M, Fouladi DF. Normal Values of Spleen Length and Volume: An Ultrasonographic Study in Children. Ultrasound Med Biol. 2016;42(8):1771-8. [PubMed ID: 27108037]. https://doi.org/10.1016/j.ultrasmedbio.2016.03.005.
  • 7.
    Chow KU, Luxembourg B, Seifried E, Bonig H. Spleen Size Is Significantly Influenced by Body Height and Sex: Establishment of Normal Values for Spleen Size at US with a Cohort of 1200 Healthy Individuals. Radiology. 2016;279(1):306-13. [PubMed ID: 26509293]. https://doi.org/10.1148/radiol.2015150887.
  • 8.
    Geraghty EM, Boone JM, McGahan JP, Jain K. Normal organ volume assessment from abdominal CT. Abdom Imaging. 2004;29(4):482-90. [PubMed ID: 15024516]. https://doi.org/10.1007/s00261-003-0139-2.
  • 9.
    Caglar V, Alkoc OA, Uygur R, Serdaroglu O, Ozen OA. Determination of normal splenic volume in relation to age, gender and body habitus: a stereological study on computed tomography. Folia Morphol (Warsz). 2014;73(3):331-8. [PubMed ID: 25465038]. https://doi.org/10.5603/FM.2014.0038.
  • 10.
    Linguraru MG, Sandberg JK, Jones EC, Summers RM. Assessing splenomegaly: automated volumetric analysis of the spleen. Acad Radiol. 2013;20(6):675-84. [PubMed ID: 23535191]. [PubMed Central ID: PMC3945039]. https://doi.org/10.1016/j.acra.2013.01.011.
  • 11.
    Garcia-Tsao G, Sanyal AJ, Grace ND, Carey WD; Practice Guidelines Committee of American Association for Study of Liver Diseases; Practice Parameters Committee of American College of Gastroenterology. Prevention and management of gastroesophageal varices and variceal hemorrhage in cirrhosis. Am J Gastroenterol. 2007;102(9):2086-102. [PubMed ID: 17727436]. https://doi.org/10.1111/j.1572-0241.2007.01481.x.
  • 12.
    Cai J, Guo X, Wang K, Zhang Y, Zhang D, Zhang X, et al. Automatic quantitative evaluation of normal pancreas based on deep learning in a Chinese adult population. Abdom Radiol (NY). 2022;47(3):1082-90. [PubMed ID: 35064795]. https://doi.org/10.1007/s00261-021-03327-x.
  • 13.
    Wei X, Chen X, Lai C, Zhu Y, Yang H, Du Y. Automatic Liver Segmentation in CT Images with Enhanced GAN and Mask Region-Based CNN Architectures. Biomed Res Int. 2021;2021:9956983. [PubMed ID: 34957310]. [PubMed Central ID: PMC8702320]. https://doi.org/10.1155/2021/9956983.
  • 14.
    Chen Y, Yang J, Zhang Y, Sun Y, Zhang X, Wang X. Age-related morphometrics of normal adrenal glands based on deep learning-aided segmentation. Heliyon. 2023;9(6). e16810. [PubMed ID: 37346358]. [PubMed Central ID: PMC10279821]. https://doi.org/10.1016/j.heliyon.2023.e16810.
  • 15.
    Zhu Y, Wei R, Gao G, Ding L, Zhang X, Wang X, et al. Fully automatic segmentation on prostate MR images based on cascaded fully convolution network. J Magn Reson Imaging. 2019;49(4):1149-56. [PubMed ID: 30350434]. https://doi.org/10.1002/jmri.26337.
  • 16.
    Sun Z, Cui Y, Liu X, Lin Z, Liu W, Wang X, et al. Quantitative evaluation of chronically obstructed kidneys from noncontrast computed tomography based on deep learning. Eur J Radiol. 2021;136:109535. [PubMed ID: 33460954]. https://doi.org/10.1016/j.ejrad.2021.109535.
  • 17.
    Collins GS, Moons KG, Dhiman P, Riley RD, Beam AL, Van Calster B, et al. TRIPOD+ AI statement: updated guidance for reporting clinical prediction models that use regression or machine learning methods. BMJ. 2024;385. [PubMed ID: 38626948]. [PubMed Central ID: PMC11019967]. https://doi.org/10.1136/bmj-2023-078378.
  • 18.
    Tejani AS, Klontzas ME, Gatti AA, Mongan JT, Moy L, Park SH, et al. Checklist for Artificial Intelligence in Medical Imaging (CLAIM): 2024 Update. Radiol Artif Intell. 2024;6(4). e240300. [PubMed ID: 38809149]. [PubMed Central ID: PMC11304031]. https://doi.org/10.1148/ryai.240300.
  • 19.
    Hu YM, Wu XL, Hu ZH, Ren AH, Wei XQ, Wang XC, et al. [Study of formula for calculating body surface areas of the Chinese adults]. Sheng Li Xue Bao. 1999;51(1):45-8. ZH. [PubMed ID: 11972174].
  • 20.
    Lee CM, Lee SS, Choi WM, Kim KM, Sung YS, Lee S, et al. An index based on deep learning-measured spleen volume on CT for the assessment of high-risk varix in B-viral compensated cirrhosis. Eur Radiol. 2021;31(5):3355-65. [PubMed ID: 33128186]. https://doi.org/10.1007/s00330-020-07430-3.
  • 21.
    Humpire-Mamani GE, Bukala J, Scholten ET, Prokop M, van Ginneken B, Jacobs C. Fully Automatic Volume Measurement of the Spleen at CT Using Deep Learning. Radiol Artif Intell. 2020;2(4). e190102. [PubMed ID: 33937830]. [PubMed Central ID: PMC8082410]. https://doi.org/10.1148/ryai.2020190102.
  • 22.
    Aslan V, Karabork Kilic AC, Ozet A, Uner A, Gunel N, Yazici O, et al. The role of spleen volume change in predicting immunotherapy response in metastatic renal cell carcinoma. BMC Cancer. 2023;23(1):1045. [PubMed ID: 37904131]. [PubMed Central ID: PMC10617093]. https://doi.org/10.1186/s12885-023-11558-y.
  • 23.
    Muller L, Kloeckner R, Mahringer-Kunz A, Stoehr F, Duber C, Arnhold G, et al. Fully automated AI-based splenic segmentation for predicting survival and estimating the risk of hepatic decompensation in TACE patients with HCC. Eur Radiol. 2022;32(9):6302-13. [PubMed ID: 35394184]. [PubMed Central ID: PMC9381627]. https://doi.org/10.1007/s00330-022-08737-z.
  • 24.
    Araujo NC, Suassuna JHR. The spleen size in patients undergoing hemodialysis. J Bras Nefrol. 2021;43(1):61-7. [PubMed ID: 33079128]. [PubMed Central ID: PMC8061966]. https://doi.org/10.1590/2175-8239-JBN-2020-0116.
  • 25.
    Son JH, Lee SS, Lee Y, Kang BK, Sung YS, Jo S, et al. Assessment of liver fibrosis severity using computed tomography-based liver and spleen volumetric indices in patients with chronic liver disease. Eur Radiol. 2020;30(6):3486-96. [PubMed ID: 32055946]. https://doi.org/10.1007/s00330-020-06665-4.
  • 26.
    Becker J, Huber A, Bette S, Rubeck A, Arndt TT, Muller G, et al. Are we systematically overdosing women? Revisiting standardized contrast protocols for thoracoabdominal CT scans. Eur Radiol. 2025;35(7):3729-38. [PubMed ID: 39786513]. [PubMed Central ID: PMC12165885]. https://doi.org/10.1007/s00330-024-11329-8.
  • 27.
    Perez AA, Noe-Kim V, Lubner MG, Somsen D, Garrett JW, Summers RM, et al. Automated Deep Learning Artificial Intelligence Tool for Spleen Segmentation on CT: Defining Volume-Based Thresholds for Splenomegaly. AJR Am J Roentgenol. 2023;221(5):611-9. [PubMed ID: 37377359]. https://doi.org/10.2214/AJR.23.29478.
  • 28.
    Watanabe Y, Todani T, Noda T, Yamamoto S. Standard splenic volume in children and young adults measured from CT images. Surg Today. 1997;27(8):726-8. [PubMed ID: 9306587]. https://doi.org/10.1007/BF02384985.
  • 29.
    Harris A, Kamishima T, Hao HY, Kato F, Omatsu T, Onodera Y, et al. Splenic volume measurements on computed tomography utilizing automatically contouring software and its relationship with age, gender, and anthropometric parameters. Eur J Radiol. 2010;75(1):e97-101. [PubMed ID: 19775843]. https://doi.org/10.1016/j.ejrad.2009.08.013.
  • 30.
    Asghar A, Agrawal D, Yunus SM, Sharma PK, Zaidi SH, Sinha A. Standard Splenic Volume Estimation in North Indian Adult Population: Using 3D Reconstruction of Abdominal CT Scan Images. Anat Res Int. 2011;2011:707325. [PubMed ID: 22567297]. [PubMed Central ID: PMC3335666]. https://doi.org/10.1155/2011/707325.
  • 31.
    Harada K, Ishinuki T, Ohashi Y, Tanaka T, Chiba A, Numasawa K, et al. Nature of the liver volume depending on the gender and age assessing volumetry from a reconstruction of the computed tomography. PLoS One. 2021;16(12). e0261094. [PubMed ID: 34879120]. [PubMed Central ID: PMC8654223]. https://doi.org/10.1371/journal.pone.0261094.
  • 32.
    Frank H, DeLand MD. Normal Spleen Size. Radiology. 1970;97(3). https://doi.org/10.1148/97.3.589.
  • 33.
    Mustapha Z, Tahir A, Tukur M, Bukar M, Lee WK. Sonographic determination of normal spleen size in an adult African population. Eur J Radiol. 2010;75(1):e133-5. [PubMed ID: 19836180]. https://doi.org/10.1016/j.ejrad.2009.09.025.
  • 34.
    Kim DW, Ha J, Lee SS, Kwon JH, Kim NY, Sung YS, et al. Population-based and Personalized Reference Intervals for Liver and Spleen Volumes in Healthy Individuals and Those with Viral Hepatitis. Radiology. 2021;301(2):339-47. [PubMed ID: 34402668]. https://doi.org/10.1148/radiol.2021204183.
  • 35.
    Tamura A, Fujita K, Ieko Y, Suzuki Y, Maki I, Yoshioka K. Establishment of normative spleen volume in a Japanese cohort using automated CT segmentation: diagnostic implications for liver fibrosis. BMC Gastroenterol. 2025;25(1):775. [PubMed ID: 41168695]. [PubMed Central ID: PMC12577029]. https://doi.org/10.1186/s12876-025-04383-z.
  • 36.
    Bezerra AS, D'Ippolito G, Faintuch S, Szejnfeld J, Ahmed M. Determination of splenomegaly by CT: is there a place for a single measurement? Ame J Roentgenol. 2005;184(5):1510-3.
  • 37.
    Kucybala I, Ciuk S, Teczar J. Spleen enlargement assessment using computed tomography: which coefficient correlates the strongest with the real volume of the spleen? Abdom Radiol (NY). 2018;43(9):2455-61. [PubMed ID: 29460042]. [PubMed Central ID: PMC6105139]. https://doi.org/10.1007/s00261-018-1500-9.
  • 38.
    Yu Q, Xu C, Li Q, Ding Z, Lv Y, Liu C, et al. Spleen volume-based non-invasive tool for predicting hepatic decompensation in people with compensated cirrhosis (CHESS1701). JHEP Rep. 2022;4(11):100575. [PubMed ID: 36204707]. [PubMed Central ID: PMC9531280]. https://doi.org/10.1016/j.jhepr.2022.100575.
  • 39.
    Kutaiba N, Chung W, Goodwin M, Testro A, Egan G, Lim R. The impact of hepatic and splenic volumetric assessment in imaging for chronic liver disease: a narrative review. Insights Imaging. 2024;15(1):146. [PubMed ID: 38886297]. [PubMed Central ID: PMC11183036]. https://doi.org/10.1186/s13244-024-01727-3.

Crossmark
Crossmark
Checking
Share on
Cited by
Metrics

Ordering Reprints

Articles are published under the Creative Commons license stated on each article. No permission or royalty fee is required for uses permitted by that license. CCC handles optional bulk and customized reprint orders. Any quotation covers production and delivery services only, not copyright permission. > Request Reprints from CCC 

Search Relations

Author(s):

Related Articles