I J Radiol

Image Credit:I J Radiol

Testicular Microvascular Function in Obese and Non-obese, Fertile and Infertile Men: A Four-Group Comparative Study

Author(s):
Zain UL HasanZain UL Hasan1,*, Syed Amir GilaniSyed Amir Gilani2, Zareen FatimaZareen Fatima1, Raham BachaRaham Bacha1, Mohammad KhalilMohammad Khalil3, Ahmad BadeghieshAhmad Badeghiesh4, 5, Sami AbusikkienSami Abusikkien6, Hatim AlabsiHatim Alabsi3, Ahmed AlharthyAhmed Alharthy3
1Institute of Radiological Sciences and Medical Imaging Technology, Faculty of Allied Health Sciences, University of Lahore, Lahore, Pakistan
2Department of Medical Diagnostic Imaging, University of Sharjah, Sharjah, United Arab Emirates
3Department of Radiology, Faculty of Medicine, King Abdulaziz University, Jeddah, Saudi Arabia
4Department of Obstetrics and Gynaecology, Faculty of Medicine, King Abdulaziz University, Rabigh, Saudi Arabia
5Deparment of Obstetrics and Gynaecology, Doctor Soliman Fakeeh Hospital, Jeddah, Saudi Arabia
6Department of Anatomy, Faculty of Medicine, King Abdulaziz University, Rabigh, Saudi Arabia

IJ Radiology:Vol. 22, issue 4; e169459
Published online:Oct 31, 2025
Article type:Research Article
Received:Jun 24, 2025
Accepted:Oct 26, 2025
How to Cite:Hasan ZU, Gilani SA, Fatima Z, Bacha R, Khalil M, et al. Testicular Microvascular Function in Obese and Non-obese, Fertile and Infertile Men: A Four-Group Comparative Study. I J Radiol. 2025;22(4):e169459. doi: https://doi.org/10.5812/iranjradiol-169459

Abstract

Background:

Obesity and infertility independently affect testicular function through hormonal disruption, oxidative stress, and endothelial dysfunction. Testicular microvascular perfusion, assessable via Doppler ultrasonography using Resistive Index (RI) and Pulsatility Index (PI), is critical for spermatogenesis and hormonal health. The combined effect of obesity and fertility status on testicular vascular and morphological parameters has not been systematically studied.

Objectives:

This study aimed to evaluate the independent effects and statistical interaction between obesity and infertility on testicular microvascular function and volume.

Patients and Methods:

A total of 172 men aged 25 - 45 years were recruited and stratified into four groups: Non-obese fertile (n = 64), non-obese infertile (n = 22), obese fertile (n = 45), and obese infertile (n = 41). Testicular volume and vascular parameters (RI, PI) were measured using color Doppler ultrasonography. Non-parametric Kruskal-Wallis tests with post-hoc comparisons, robust linear regression for interaction effects, and Spearman correlations were used for statistical analysis.

Results:

The Obese-Infertile group had the highest median RI (0.77) and PI (1.61) and the lowest median testicular volume (9.8 mL). PI and testicular volume differed significantly across groups (P < 0.001), while RI showed borderline significance (P = 0.054). Linear regression revealed a significant statistical interaction between obesity and infertility on PI (β = 0.318, P < 0.001), indicating that the association with higher PI was stronger in obese infertile men than would be expected from either factor alone. Obese men with preserved fertility maintained relatively normal testicular volume and vascular indices. Spearman correlation demonstrated a positive association between BMI and PI and a negative association between BMI and testicular volume (both P < 0.001).

Conclusion:

The combination of obesity and infertility was associated with the highest PI values and the lowest testicular volume among the groups studied. Pulsatility Index and testicular volume are the most sensitive indicators of this dysfunction, while RI is less informative. Obese men who remain fertile maintain relatively preserved testicular volume and vascular indices.

1. Background

Obesity has reached epidemic proportions globally, with over 650 million adults classified as obese (1). In men, excess adiposity is strongly associated with impaired fertility through multiple mechanisms, including hormonal disruption (e.g., lower testosterone and higher estradiol due to increased aromatase activity), chronic inflammation, oxidative stress, and endothelial dysfunction (2, 3). These pathophysiological changes can adversely affect both sperm production and testicular health (4). Testicular microvascular perfusion, which represents blood flow within small testicular vessels, is vital for delivering oxygen and nutrients that support spermatogenesis and hormonal function. Doppler ultrasonography provides a noninvasive window into this microcirculatory environment (5).
Previous research has demonstrated the clinical utility of color Doppler ultrasonography in the evaluation of male infertility and testicular vascular abnormalities. For example, Petros et al. showed that Doppler ultrasound detects varicoceles far more sensitively than physical examination, correlating well with venographic findings (6). Sakamoto et al. reported that in a large cohort (n = 545) of infertile men, Doppler ultrasound identified intra-scrotal abnormalities in more than 65% of cases, many of which were missed on physical exam (7). In addition, Doppler-derived indices like Resistive Index (RI) and Pulsatility Index (PI) have been proposed as functional biomarkers of microvascular health: higher RI and PI values reflect reduced arterial compliance and poorer perfusion, and have been linked with testicular dysfunction in patients with varicocele (8). Imaging techniques remain central in the assessment of male infertility, as traditional physical examination may miss subtle but clinically relevant abnormalities (9).
Animal studies have provided substantial evidence supporting the critical role of testicular microvascular perfusion in male fertility. Research in domestic animals has demonstrated that Doppler ultrasonography of the testicular artery correlates closely with semen quality, making RI and PI reliable markers of testicular function (10, 11). Reviews of color Doppler applications in farm animals further highlight that adequate testicular blood flow is essential for spermatogenesis and overall gonadal health, and that alterations in vascular parameters can reflect early reproductive dysfunction (12). Experimental studies in rats have similarly shown that acute testicular injuries, such as torsion, cause measurable changes in microvascular blood flow, emphasizing that vascular alterations can serve as sensitive indicators of testicular compromise (13). Collectively, these animal studies support the concept that microvascular indices provide objective, non-invasive insights into testicular health, providing a rationale for applying similar Doppler-based assessments in men to evaluate the combined impact of obesity and infertility on testicular microvascular function.
Despite substantial literature on obesity or infertility in isolation, there remains a critical gap that no prior study has systematically examined how obesity and fertility status interact to influence testicular microvascular function. Most investigations dichotomize by fertility or BMI separately, failing to stratify individuals into a two‑by‑two design (i.e., fertile vs. infertile, obese vs. non-obese). This limitation precludes understanding whether obesity exacerbates the vascular and morphological differences observed in infertile men specifically.
Given the cross-sectional design of this study, infertility status was used as a clinical stratification variable rather than being assumed as a causal determinant of altered testicular perfusion. Impaired microvascular blood flow may represent both a contributor to and a consequence of testicular dysfunction, reflecting complex and potentially bidirectional pathophysiological mechanisms.

2. Objectives

This study aims to examine associations between metabolic and reproductive factors and testicular health, highlighting subgroups with more pronounced differences in testicular perfusion and morphology.

3. Patients and Methods

3.1. Study Design and Participants

This cross-sectional comparative study was conducted in Lahore, Pakistan, from June 2021 to October 2024. Participants were recruited from a tertiary care university hospital and its affiliated infertility clinics. Recruitment was consecutive, including all eligible men presenting during the study period. Fertile men were recruited from general urology and outpatient clinics, whereas infertile men were recruited from infertility clinics, ensuring that both groups were drawn from the same underlying population. Age matching was applied to minimize potential confounding. Ethical approval was obtained from the Research Ethical Committee (REC-UOL-/786/04/21), and all participants provided written informed consent prior to enrollment.
A total of 172 men aged 25 - 45 years were stratified into four groups based on fertility and obesity status: fertile non-obese (n = 64), fertile obese (n = 45), infertile non-obese (n = 22), and infertile obese (n = 41).
Fertility status was defined as follows: fertile men had fathered a child within the past two years and exhibited normal semen parameters according to World Health Organization criteria, while infertile men had failed to conceive after at least 12 months of unprotected intercourse and demonstrated abnormal semen parameters. Obesity was defined as BMI ≥ 30 kg/m², and non-obese participants had a BMI of 18.5 - 24.9 kg/m².
Exclusion criteria included a history of systemic illnesses affecting fertility, prior surgical interventions involving the reproductive organs, documented mumps infection, or any other condition known to compromise testicular function.

3.2. Clinical and Anthropometric Assessment

All participants underwent a comprehensive physical examination, including genital inspection and palpation for varicoceles or other testicular abnormalities. Height and weight were measured using standardized equipment, and BMI was calculated as weight (kg) divided by height (m²). Measurements were taken twice, and the mean value was used for analysis to ensure accuracy.

3.3. Ultrasonographic Evaluation

Testicular assessment was performed using a Toshiba Xario ultrasound system equipped with a 7 - 14 MHz linear transducer. Participants were scanned in the supine position, and each testis was evaluated separately. Testicular volume was calculated using the ellipsoid formula: Length × Width × Height × 0.71.
Color Doppler ultrasonography was employed to assess vascular parameters, including RI, PI, peak systolic velocity (PSV), and end-diastolic velocity (EDV). Three consecutive measurements were taken for each parameter, and the mean value was used for analysis. All scans were performed by two experienced sonographers blinded to the participants’ group assignment. Standard Doppler settings (angle of insonation < 60°, gain and pulse repetition frequency optimized) were applied to ensure reproducibility.

3.4. Statistical Analysis

Data normality was assessed using the Shapiro-Wilk test. Non-normally distributed variables (age, BMI, RI, PI, and testicular volume) were summarized as median and interquartile range (IQR). Group comparisons were performed using the Kruskal-Wallis test to evaluate differences across the four groups. A P-value < 0.05 was considered statistically significant. For outcomes where the Kruskal-Wallis test was significant, pairwise group comparisons were conducted using Dunn's post-hoc test, with Bonferroni adjustment, and effect sizes (r) were calculated using the Wilcoxon method (Tables 1 - 3).
Table 1.Dunn's Post-hoc Pairwise Comparisons – Pulsatility Index a, b
ComparisonsStatisticsP-ValueAdj. P-ValueSignificance
Non-obese fertile vs obese fertile0.100.911.00NS
Non-obese fertile vs non-obese infertile3.150.0010.001Significant
Non-obese fertile vs obese infertile5.22< 0.001< 0.001Significant
Obese fertile vs non-obese infertile2.920.0040.02Significant
Obese fertile vs obese infertile4.74< 0.001< 0.001Significant
Non-obese infertile vs obese infertile1.000.321.00NS

Abbreviations: Adj. P-value, adjusted P-value; NS, not significant.

a Pairwise comparisons were performed using Dunn’s test with Bonferroni correction.

b Effect sizes interpreted according to Cohen’s guidelines: Small = 0.1 - 0.29, moderate = 0.3 - 0.49, large ≥ 0.5.

Table 2.Dunn's Post-hoc Pairwise Comparisons – Testicular Volume a, b
ComparisonsStatisticsP-ValueAdj. P-ValueSignificance
Non-obese fertile vs obese fertile-0.570.571.00NS
Non-obese fertile vs non-obese infertile-0.240.811.00NS
Non-obese fertile vs obese infertile-4.39< 0.001< 0.001Significant
Obese fertile vs non-obese infertile0.190.851.00NS
Obese fertile vs obese infertile-3.56< 0.0010.0023Significant
Non-obese infertile vs obese infertile-3.090.0020.012Significant

Abbreviations: Adj. P-value, adjusted P-value; NS, not significant.

a Pairwise comparisons were performed using Dunn’s test with Bonferroni correction.

b Effect sizes (r) interpreted according to Cohen’s guidelines: Small = 0.1 - 0.29, moderate = 0.3 - 0.49, large ≥ 0.5.

Table 3.Effect Sizes (r) For Pairwise Group Comparisons of Pulsatility Index and Testicular Volume a
ComparisonsPI (r)Testicular Volume (r)
Non-obese fertile vs non-obese infertile0.420.36
Non-obese fertile vs obese fertile0.180.12
Non-obese fertile vs obese infertile0.550.48
Non-obese infertile vs obese fertile0.310.29
Non-obese infertile vs obese infertile0.470.39
Obese fertile vs obese infertile0.380.34

Abbreviations: PI, Pulsatility Index; r, effect size.

a Effect sizes (r) interpreted according to Cohen’s guidelines: Small = 0.1 - 0.29, moderate = 0.3 - 0.49, large ≥ 0.5.

Robust linear regression (M-estimation) was conducted to examine the interaction between obesity and fertility status on PI, which was the primary hemodynamic parameter showing significant differences across the groups (Table 4). Model diagnostics were performed to evaluate regression assumptions. Residual plots were visually inspected to assess linearity and homoscedasticity, and influence diagnostics were examined to identify potential outliers or high-leverage observations. No major violations were observed. Although PI was non-normally distributed, it was retained on its original scale because residuals were acceptable. Robust regression was used to minimize the influence of non-normality and outliers. All analyses were performed using R version 4.5.1.
Table 4.Robust Linear Regression of Interaction Between Obesity and Infertility on Pulsatility Index
PredictorsCoefficientStd. Errort-ValueP-Value95% CI Lower95% CI Upper
Intercept1.310.12610.39< 0.0011.0641.562
Obesity (obese vs. non-obese)0.030.0760.450.697-0.1150.183
Fertility (infertile vs. fertile)0.100.0352.790.0050.0290.168
Age (y)-0.010.002-1.140.256-0.0070.002
Obesity × infertility interaction0.320.0476.73< 0.0010.2250.410

Abbreviations: Std. Error, standard error; CI, confidence interval.

a Robust linear regression (M-estimation) was applied to examine the interaction between obesity and infertility on PI.

No formal a priori sample size calculation was performed, as recruitment was based on consecutive eligible participants during the predefined study period. However, a post-hoc power analysis was conducted for the primary outcome (PI). Using the observed difference in median PI between the Obese-Infertile and Non-Obese-Fertile groups, the estimated effect size (Cohen’s d = 0.52) at a two-sided alpha level of 0.05 yielded an estimated post-hoc power of 0.81. This suggests that the study was adequately powered to detect moderate intergroup differences in PI, although smaller effect sizes may not have been detected with adequate statistical power.

4. Results

A total of 172 men were included in the study, stratified by obesity and fertility status: Non-obese fertile (n = 64), non-obese infertile (n = 22), obese fertile (n = 45), and obese infertile (n = 41). Table 5 summarizes the baseline characteristics of participants by obesity and fertility status. Age was comparable across groups, while BMI was higher in obese men. The Obese-Infertile group had the lowest testicular volume and highest RI and PI values.
Table 5.Baseline Characteristics of Participants by Obesity and Fertility Status a
Obesity StatusFertility StatusNRI; Median (IQR)PI; Median (IQR)Age; Median (IQR)BMI; Median (IQR)Volume (mL); Median (IQR)
Non-obeseFertile640.69 (0.10)1.18 (0.09)31 (5.0)22.2 (2.8)13.0 (3.2)
Non-obeseInfertile220.70 (0.17)1.24 (1.13)29 (5.8)21.8 (2.6)14.0 (3.5)
ObeseFertile450.68 (0.06)1.18 (0.09)34 (5.0)33.8 (3.4)12.1 (2.8)
ObeseInfertile410.77 (0.28)1.61 (1.34)33 (6.0)34.7 (4.0)9.8 (2.1)

Abbreviations: BMI, Body Mass Index; RI, Resistive Index; PI, Pulsatility Index; IQR, interquartile range; CI, confidence interval.

a Data are presented as median (IQR) unless otherwise specified.

Table 6 presents group comparisons of testicular hemodynamic and morphological parameters. Resistive Index demonstrated a non-significant trend across groups, whereas PI and testicular volume differed significantly, reflecting differences in testicular perfusion and volume across groups. Post-hoc Dunn’s analysis showed that both infertile groups had significantly higher PI values compared with fertile men. Non-obese infertile men differed significantly from non-obese fertile men, indicating that infertility alone was associated with elevated PI, while the Obese-Infertile group demonstrated the highest PI values and differed significantly from both fertile groups. Post-hoc Dunn’s analysis Table 1 demonstrated significant intergroup differences in PI. Corresponding testicular volume comparisons are presented in Table 2, and effect sizes are summarized in Table 3.
Table 6.Testicular Hemodynamics and Morphological Parameters Across Group
OutcomesTest Statistics (H)P-ValueEffect Size (ε²)95% CI for Effect aSignificance
RI7.650.0540.044[0.000, 0.100]NS
PI36.49< 0.0010.211[0.120, 0.302]Significant
Volume21.82< 0.0010.126[0.060, 0.192]Significant

Abbreviations: RI, Resistive Index; PI, Pulsatility Index; IQR, interquartile range; NS, not significant; CI, confidence interval.

a Group comparison was performed using the Kruskal–Wallis test.
Obesity or infertility alone had small or moderate effects on PI, but the interaction term (obese × infertile) was highly significant (β = 0.32, t = 6.73), indicating that the combined presence of obesity and infertility was associated with significantly higher PI values beyond their independent effects. An examination of residual plots, leverage values, and influence diagnostics revealed no significant observations that substantially modified the interaction coefficient. The estimate remained unchanged after robust regression and sensitivity analysis, indicating that the model was reliable.
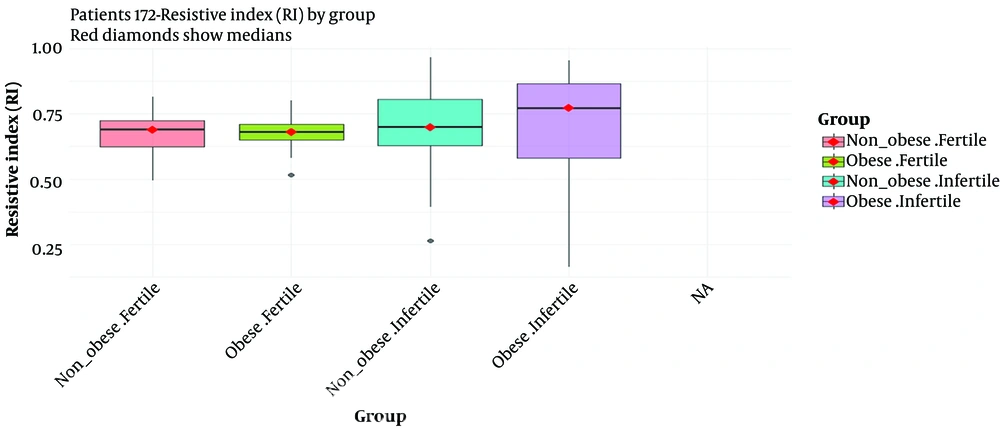
Resistive Index demonstrated a non-significant trend across groups (Figure 1). In contrast, PI was significantly elevated in the Obese-Infertile group (Figure 2), reflecting reduced arterial compliance and impaired microvascular perfusion within the testes. Significant differences mainly involve the Obese-Infertile group, reflecting differences in testicular morphology (Figure 3). Figure 4 illustrates color Doppler images of both testes in a 32-year-old obese male, showing reduced intra-testicular vascularity with spectral Doppler waveforms: right RI = 0.64, PI = 1.09; left RI = 0.44, PI = 0.63, consistent with obesity-related impaired perfusion.
Resistive Inderx (RI) by group-172 patients
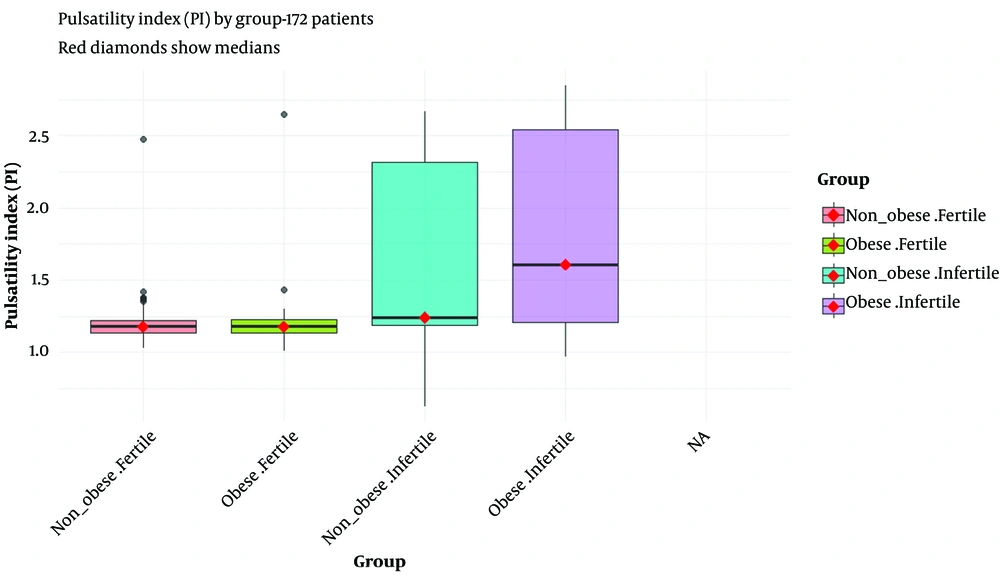
Figure 1.

Resistive Inderx (RI) by group-172 patients

Median Pulsatility Index (PI) across study groups
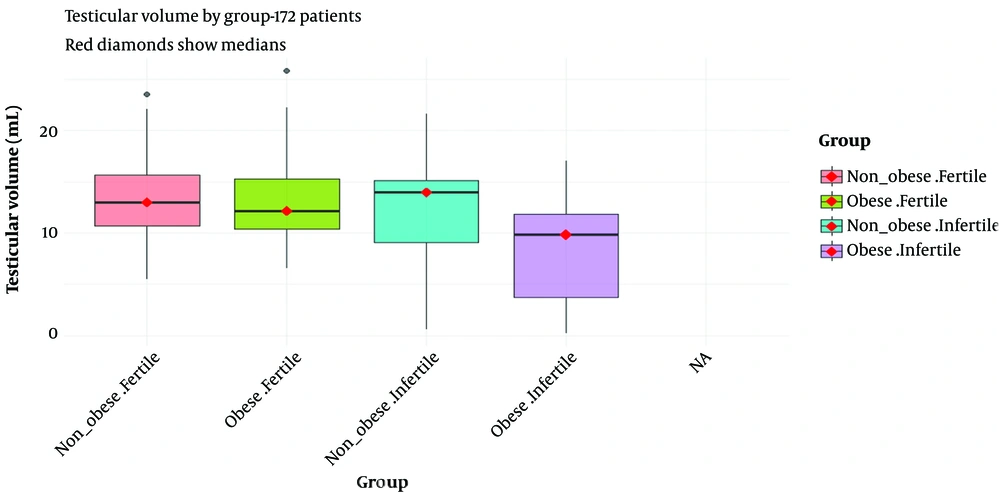
Figure 2.

Median Pulsatility Index (PI) across study groups

Median Testicular volume by group
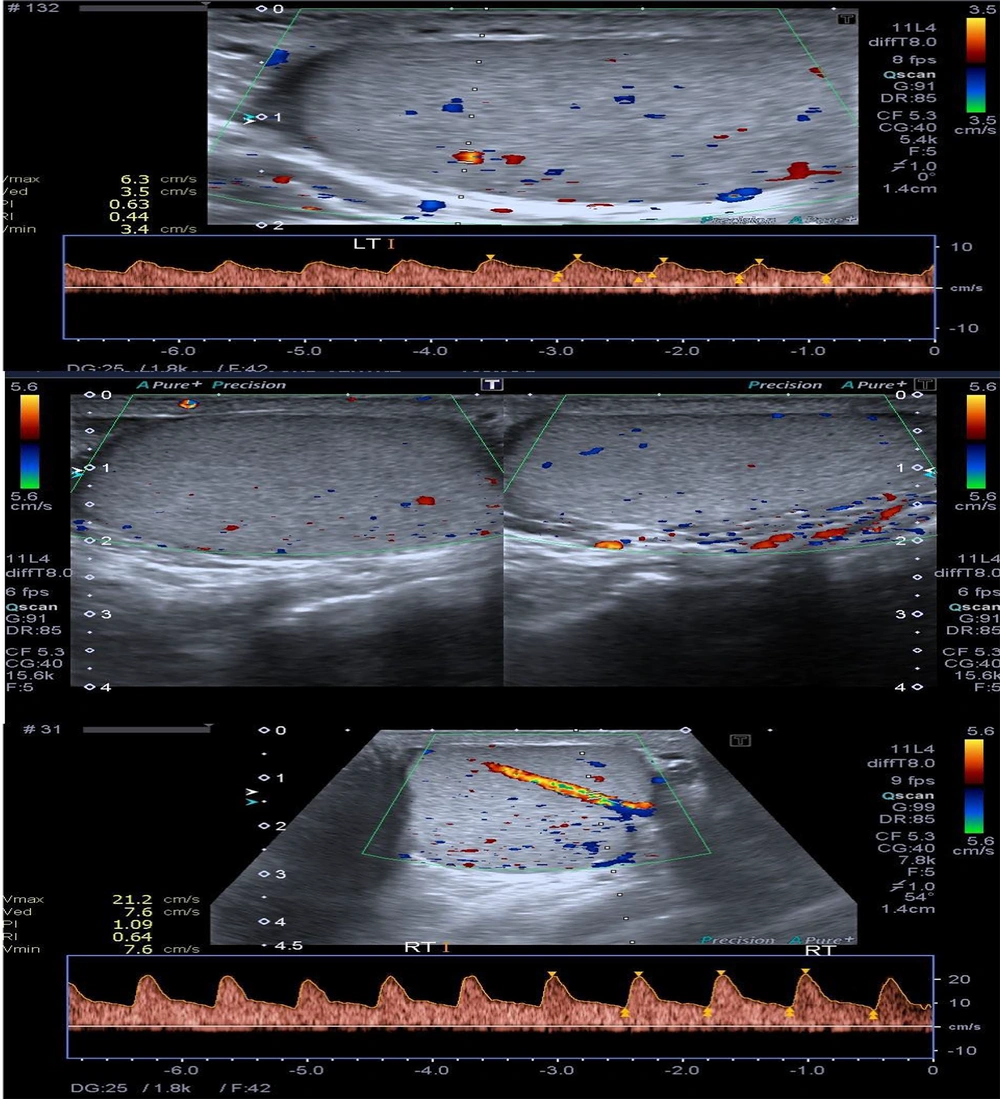
Figure 3.

Median Testicular volume by group

Color Doppler images of both the testes in a 32-year-old obese male demonstrating reduced intra-testicular vascularity. Spectral Doppler waveforms show diminished perfusion bilaterally, (right RI = 0.64 and PI = 1.09, left RI = 0.44 and PI = 0.63) consistent with obesity-related impaired perfusion.

Figure 4.

Color Doppler images of both the testes in a 32-year-old obese male demonstrating reduced intra-testicular vascularity. Spectral Doppler waveforms show diminished perfusion bilaterally, (right RI = 0.64 and PI = 1.09, left RI = 0.44 and PI = 0.63) consistent with obesity-related impaired perfusion.

4.1. Spearman Correlation Analysis

Spearman correlation analysis showed that BMI was positively correlated with the PI (ρ = 0.42, P < 0.001) and negatively correlated with testicular volume (ρ = −0.38, P < 0.001). Pulsatility Index was also negatively correlated with testicular volume (ρ = −0.45, P < 0.001).

5. Discussion

This study examined the combined impact of obesity and infertility on testicular microvascular function and morphology using Doppler ultrasonography. The findings demonstrate that obesity and infertility are both associated with differences in testicular vascular parameters, with infertile obese men showing the largest differences in hemodynamic and structural parameters (14, 15). These results reinforce the growing evidence that metabolic and reproductive disturbances share common pathophysiological pathways that adversely affect testicular function.
Importantly, the associations observed between infertility status and impaired testicular microvascular parameters should not be interpreted as evidence of a unidirectional causal relationship. Reduced testicular perfusion may precede, accompany, or result from impaired spermatogenesis, and multiple etiologies including hormonal dysregulation, inflammation, endothelial dysfunction, and other vascular factors may contribute to these changes.
Although the Obese-Infertile group exhibited the highest median RI values, overlap between groups suggests that RI alone has limited discriminatory sensitivity for detecting early microvascular differences. This observation is consistent with previous normative data reported by Aziz et al., who documented RI values of approximately 0.70 - 0.84 in fertile men, and with Pinggera et al., who demonstrated that RI values > 0.60 are strongly associated with disturbed spermatogenesis (16, 17). Our data were directionally similar, yet the modest intergroup variability indicates that RI may be influenced by factors beyond fertility and obesity status, limiting its usefulness as a stand-alone marker.
In contrast, PI emerged as a more robust and discriminatory parameter. PI values clearly differentiated fertile from infertile men regardless of BMI category, with the Obese-Infertile subgroup demonstrating the highest pulsatility. Elevated PI is consistent with increased vascular resistance, reduced arterial elasticity, and compromised microcirculatory compliance mechanisms previously implicated in testicular dysfunction. The strong performance of PI in our study aligns with the broader evidence synthesized by Lotti et al., who emphasized the clinical importance of scrotal Doppler indices for evaluating testicular perfusion and male reproductive health (18). Together, these findings underscore PI as a sensitive and clinically meaningful marker of early vascular compromise in men affected by metabolic and reproductive stressors.
Testicular volume showed a similarly important pattern. Notably, fertile obese men maintained relatively preserved testicular volume, indicating that fertility status may attenuate or delay obesity-related structural decline. The negative correlation between BMI and testicular volume supports prior evidence linking adiposity to impaired gonadal function, with excess fat contributing to hormonal imbalance, increased aromatization, oxidative stress, and vascular dysregulation.
Animal studies provide important support for the role of testicular microvascular function in reproductive health. In various domestic species, Doppler ultrasonography has been shown to reliably assess testicular perfusion, with alterations in vascular parameters linked to impaired testicular function (10-12). Experimental models in rats further demonstrate that disruptions in microvascular blood flow, such as after testicular torsion, result in impaired tissue perfusion and altered vascular dynamics (13). Although our study did not directly measure semen quality, these findings from animal studies provide mechanistic support for the observed elevated PI and reduced testicular volume in obese infertile men, suggesting that microvascular compromise may contribute to structural testicular alterations.
The robust linear regression model further demonstrated a significant statistical interaction between obesity and infertility across vascular parameters, suggesting that these factors are both associated with differences in microvascular function without implying a causal synergy. These associations may reflect overlapping metabolic and reproductive mechanisms, although causal relationships cannot be inferred from this cross-sectional design.
Collectively, these findings highlight the importance of incorporating both fertility status and metabolic risk profiling into routine evaluation of testicular health. Doppler ultrasonography offers a valuable, non-invasive method for assessing microvascular integrity, particularly through PI and testicular volume, which demonstrated clear diagnostic utility in this cohort and has been documented in previous studies (19, 20).
From a clinical perspective, these findings suggest that color Doppler–derived PI and testicular volume measurements may provide complementary information beyond conventional semen analysis in obese men presenting with infertility. Elevated PI and reduced testicular volume may help identify a subgroup of patients with underlying microvascular compromise who may be at higher risk for impaired spermatogenesis. Incorporating these parameters into routine scrotal ultrasonography could therefore assist in risk stratification, guide the intensity of metabolic and reproductive evaluation, and support earlier implementation of targeted interventions such as weight reduction, optimization of metabolic health, or hormonal assessment and management. Furthermore, Doppler parameters may have potential utility as non-invasive biomarkers to monitor response to lifestyle or medical interventions over time, although this requires confirmation in prospective longitudinal studies.
These findings support the integration of Doppler-derived PI and testicular volume into structured risk stratification models for obese men presenting with infertility.
This study has several important limitations that should be considered when interpreting the findings. First, the sample sizes across subgroups were unequal, with a smaller non-obese infertile group compared with the other categories. This imbalance may have reduced statistical power for certain comparisons and may partly explain borderline findings, such as the near-significant trend observed for RI. Second, detailed hormonal and metabolic profiling was not performed. The absence of measurements such as testosterone, gonadotropins, estradiol, insulin resistance indices, lipid profiles, and inflammatory markers limits our ability to directly link the observed Doppler abnormalities to specific endocrine or metabolic mechanisms. Consequently, mechanistic interpretations remain inferential. Finally, the cross-sectional design precludes causal inference, and longitudinal studies incorporating hormonal, metabolic, and reproductive outcomes are needed to clarify temporal relationships and prognostic implications.

5.1. Limitations

Hormonal and metabolic profiling (e.g., testosterone, gonadotropins, estradiol, insulin resistance markers, lipid profile, and inflammatory cytokines) was not performed, limiting the ability to directly link Doppler findings with underlying endocrine or metabolic mechanisms.
Potential residual confounding from factors such as varicocele, smoking, or other lifestyle influences was not controlled. This cross-sectional design prevents causal inference, and longitudinal studies are needed to determine whether altered microvascular parameters predict future spermatogenic outcomes or respond to interventions.
The subgroup sizes were unequal, with the Non-Obese Infertile group being notably smaller than the others, which may reduce statistical power and affect generalizability.
In conclusion, obesity combined with impaired fertility was associated with higher PI values and smaller testicular size, with obese infertile men demonstrating the largest differences among groups. Pulsatility Index and testicular volume appeared more discriminatory than RI in this cohort. Fertile men, even if obese, showed relatively preserved vascular and morphological parameters. These findings indicate that metabolic and reproductive status are associated with measurable differences in testicular microvascular characteristics, although causal relationships cannot be established in this cross-sectional study.

Footnotes

References


Crossmark
Crossmark
Checking
Share on
Cited by
Metrics

Ordering Reprints

Articles are published under the Creative Commons license stated on each article. No permission or royalty fee is required for uses permitted by that license. CCC handles optional bulk and customized reprint orders. Any quotation covers production and delivery services only, not copyright permission. > Request Reprints from CCC 

Search Relations

Author(s):

Related Articles