
1. Background
Osteoporosis is a common systemic skeletal disorder characterized by decreased bone mineral density (BMD) and compromised bone structure, resulting in increased susceptibility to fractures and subsequent morbidity and mortality (1). The condition predominantly affects postmenopausal women, in whom estrogen deficiency accelerates bone resorption and leads to rapid bone loss (2).
Sarcopenia refers to an age-related decline in skeletal muscle mass and function and commonly coexists with osteoporosis in older individuals. These conditions share multiple etiological factors, including aging, hormonal alterations, physical inactivity, and nutritional deficiencies (3, 4). Their coexistence, often described as osteosarcopenia, has been associated with a greater risk of falls, fragility fractures, and functional decline than either condition alone (5, 6).
Computed tomography (CT) quantifies skeletal muscle mass using the skeletal muscle index (SMI). Cross-sectional muscle area at the third lumbar vertebra (L3) correlates strongly with total body skeletal muscle mass (7), and CT-derived SMI is an established indicator of muscle quantity across diverse clinical settings (8). Dual-energy X-ray absorptiometry (DXA) remains the reference standard for BMD assessment; however, the added value of CT-based muscle metrics for identifying individuals at risk of low BMD is unclear.
2. Objectives
The objective of this study was to examine the correlation between abdominal CT-derived L3 SMI and DXA-measured BMD and to evaluate whether SMI adds predictive value for low BMD beyond age and sex after adjustment for body mass index (BMI). A prespecified subgroup analysis was conducted in postmenopausal women.
3. Methods
3.1. Study Design and Population
This single-center observational study used retrospectively collected clinical and imaging data to assess the cross-sectional association between L3 SMI and BMD. Consecutive adults aged 18 - 89 years who underwent both contrast-enhanced abdominal CT and DXA within one month of each other between January 2021 and December 2022 were screened. Longitudinal changes and subsequent clinical outcomes were not evaluated. Indications for CT included oncologic follow-up, evaluation of abdominal pain, and trauma assessment. Previous studies have shown that intravenous contrast minimally affects skeletal muscle area measurements (9).
Exclusion criteria were as follows: i) lumbar degenerative changes affecting DXA accuracy (vertebral osteophytes, endplate sclerosis, compression fractures, or facet hypertrophy); ii) prior vertebral surgery or instrumentation; iii) metabolic bone disease other than osteoporosis (including hyperparathyroidism, thyroid disorders, or renal insufficiency) or current bisphosphonate treatment; iv) a history of malignancy with bone metastasis; v) hip arthroplasty or other implants precluding accurate femoral BMD measurement; and vi) severe musculoskeletal deformities or CT artifacts preventing accurate SMI measurement.
Of 389 potentially eligible patients, 243 were excluded because of lumbar degenerative changes (n = 110); metabolic bone disease or bisphosphonate treatment, including hyperparathyroidism, thyroid disorders, or renal disorders (n = 35); prior vertebral surgery or stabilization (n = 30); malignancy with bone metastasis (n = 28); CT artifacts or poor image quality (n = 25); or hip arthroplasty or other imaging-based exclusions (n = 15). The final sample comprised 146 patients (Figure 1).
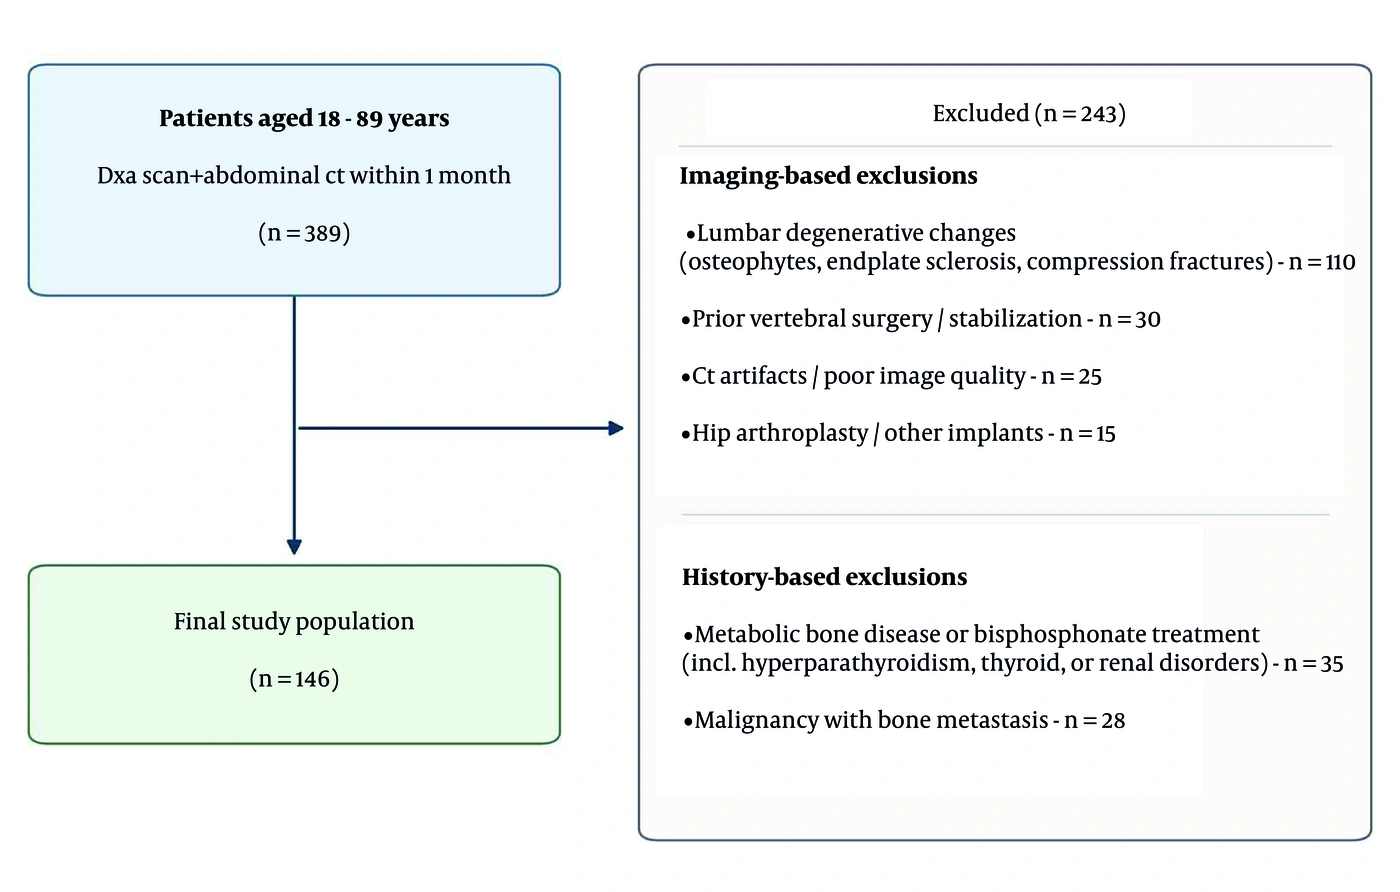
Figure 1.
Patient selection flow diagram. Of 389 potentially eligible patients, 243 were excluded for the reasons indicated, yielding a final analytic sample of 146 patients. CT (computed tomography); DXA (dual-energy X-ray absorptiometry).
Women aged ≥ 50 years were considered postmenopausal for subgroup analyses, consistent with epidemiological data on the mean age of natural menopause in the Turkish population (10). This classification was an age-based proxy; hormonal or clinical confirmation was unavailable in the retrospective dataset. The study was approved by the institutional ethics committee (E2 - 22 - 3006); informed consent was waived because of the retrospective design and the use of anonymized medical records.
3.2. Computed Tomography Imaging Analysis
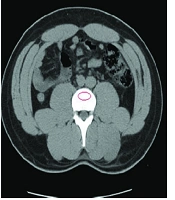
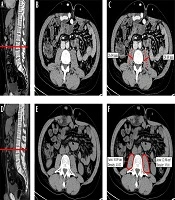
CT images were acquired using a 128-detector scanner (GE Revolution Evo). All scans were anonymized and reviewed without knowledge of the DXA results. Skeletal muscle area was measured on a single axial CT image at the mid-level of L3 by manual outlining on a GE Advantage Workstation and classification using predefined Hounsfield unit thresholds (−29 to +150 Hounsfield units). The measured area included the rectus abdominis, psoas, paraspinal, and lateral abdominal wall muscles (Figure 2). Measurements were performed by a single radiologist with 5 years of experience in body composition CT analysis who was blinded to the DXA results. Intraobserver reproducibility was assessed by repeating the full measurement in 30 randomly selected cases on a separate occasion. The L3 skeletal muscle area was manually outlined again on the workstation, and SMI was recalculated from the new measurement. This assessment demonstrated good agreement (intraclass correlation coefficient [ICC] = 0.81; 95% confidence interval [CI], 0.58 - 0.91; two-way mixed-effects, absolute agreement, single measures). SMI was calculated as skeletal muscle area divided by height squared (cm2/m2). Low SMI was defined as SMI < 52.4 cm2/m2 in men and < 38.5 cm2/m2 in women, following the thresholds of Prado et al., which were derived by optimal stratification against survival in obese patients with gastrointestinal or respiratory malignancy (11). These thresholds were prespecified for the present analysis and remain the most widely applied L3 cutoffs, permitting comparison with the existing literature. Because the derivation population differs from ours, a sensitivity analysis was performed using thresholds derived from healthy kidney donor candidates (Derstine et al.: < 45.4 cm2/m2 in men and < 34.4 cm2/m2 in women) (12). Because muscle strength and physical performance were not assessed, the term low SMI (or CT-defined low muscle mass) is used throughout in preference to sarcopenia.
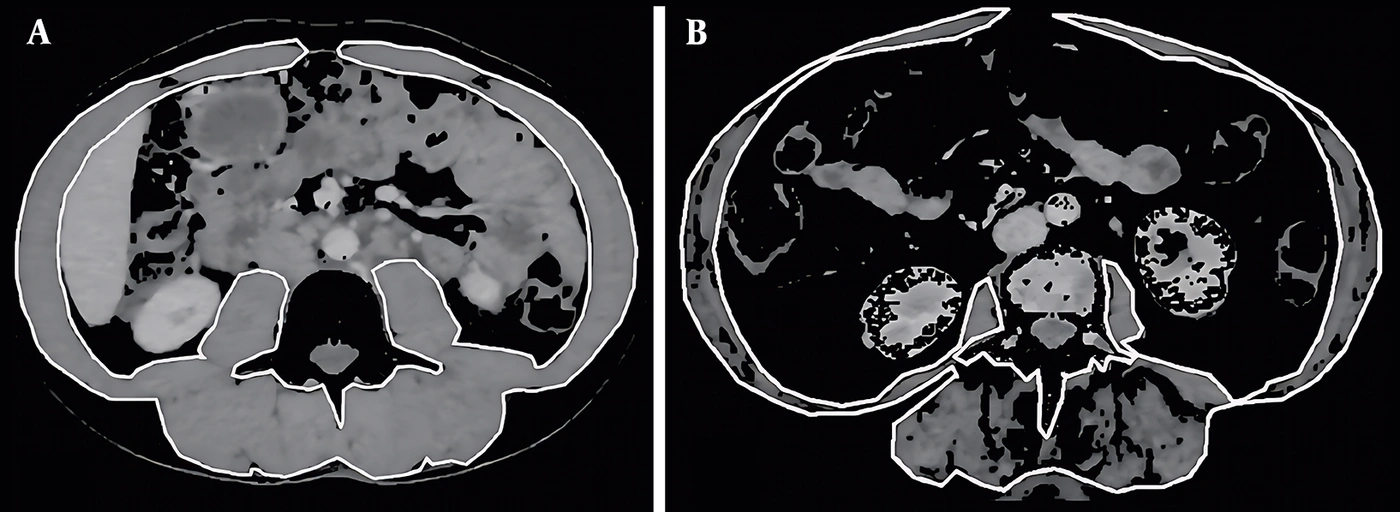
Figure 2.
Axial CT images at the mid-level of L3 showing segmentation of skeletal muscle area. (A) Case with normal skeletal muscle index (SMI) and (B) case with low SMI. Hounsfield unit thresholds: −29 to +150 Hounsfield units. CT = computed tomography; L3 = third lumbar vertebra; SMI = skeletal muscle index.
3.3. Bone Mineral Density Assessment
DXA scans (Lunar iDXA, GE Healthcare) provided lumbar (first through fourth lumbar vertebrae [L1–L4]) and total femur BMD values. T-scores were interpreted using World Health Organization (WHO) criteria: osteopenia (−2.5 < T ≤ −1.0) and osteoporosis (T ≤ −2.5). The primary outcome, low BMD, was defined as a total femur T-score ≤ −1.0 to maximize sensitivity in an opportunistic screening setting. This threshold was applied to the whole cohort as an operational research outcome rather than as a clinical diagnosis of osteopenia or osteoporosis in younger adults. According to the International Society for Clinical Densitometry Official Positions, the WHO densitometric classification applies to postmenopausal women and men aged ≥ 50 years. In premenopausal women and men younger than 50 years, BMD is more appropriately expressed as a Z-score, with values ≤ −2.0 designated as below the expected range for age (13). T-score bands are therefore reported descriptively rather than as diagnostic categories, and an age-restricted sensitivity analysis is presented in Table S1 in the Supplementary File. Body mass index (BMI) was calculated from height and weight recorded at the time of DXA.
3.4. Statistical Analysis
Continuous variables are expressed as mean ± standard deviation (SD), and categorical variables as counts and percentages. Pearson correlation coefficients were used to assess the relationships of L3 SMI with mean L1–L4 lumbar BMD and total femur BMD, consistent with standard DXA reporting. Correlations were stratified by sex and age group (< 50 vs ≥ 50 years). Patients with and without low SMI were compared using independent-samples t-tests in the whole cohort and separately in postmenopausal women. Four logistic regression models were constructed: Model 1 (age + sex), Model 2 (age + sex + SMI), Model 3 (age + sex + BMI), and Model 4 (age + sex + BMI + SMI). All models were developed and evaluated in the same cohort; the reported areas under the receiver operating characteristic curve (AUCs) therefore represent apparent (internal) discrimination and require external validation. Odds ratios (ORs) with 95% CIs are reported for all predictors. Complete data were available for all 146 patients; no imputation was required. Confidence intervals for individual model AUCs, as well as confidence intervals and P values for between-model differences in AUC (ΔAUC), were derived using a single paired bootstrap percentile procedure (patient-level resampling, n = 146 per resample, 3,000 iterations), ensuring internal consistency between each interval and its corresponding significance test. Calibration of the fully adjusted model was assessed using the Brier score, calibration intercept and slope, and Hosmer–Lemeshow test across several group counts, as the test is known to be sensitive to the number of groups (14). Optimism-corrected estimates of the AUC and calibration slope were obtained using Harrell's bootstrap procedure. Effect modification was assessed by adding multiplicative interaction terms (SMI × age stratum and SMI × sex) to the fully adjusted model. The sensitivity analysis using alternative SMI thresholds is presented in Table S2 in the Supplementary File. Full procedural details are provided in the Supplementary Methods. A two-sided P < 0.05 was considered statistically significant. Analyses were performed using IBM SPSS Statistics version 26.0 and Python (SciPy/NumPy) for bootstrap resampling and calibration analysis.
4. Results
4.1. Study Population and Baseline Characteristics
A total of 146 patients met the inclusion criteria (mean age, 58.9 ± 15.8 years; 24.7% male). Baseline characteristics are presented in Table 1. Mean BMI was 28.1 ± 6.1 kg/m2, and mean L3 SMI was 46.0 ± 8.2 cm2/m2. Low SMI was present in 39 patients (26.7%). Total femur T-scores were > −1.0 in 66 patients (45.2%), between −2.5 and −1.0 in 64 patients (43.8%), and ≤ −2.5 in 16 patients (11.0%), corresponding to 54.8% with low BMD. Among the 39 patients aged < 50 years, for whom these T-score bands do not constitute a densitometric diagnosis, 4 (10.3%) had a total femur Z-score ≤ −2.0. All four also had a T-score ≤ −2.5, and none of the 14 patients in the −2.5 to −1.0 band had a Z-score ≤ −2.0.
Table 1.
Baseline Characteristics of the Study Population a
| Variables | Overall (n = 146) | Normal BMD (n = 66) | Low BMD (n = 80) |
|---|---|---|---|
| Age (y) | 58.9 ± 15.8 | 55.1 ± 15.0 | 62.0 ± 15.9 |
| Sex | |||
| Male | 36 (24.7) | 22 (33.3) | 14 (17.5) |
| Female | 110 (75.3) | 44 (66.7) | 66 (82.5) |
| BMI (kg/m2) | 28.1 ± 6.1 | 30.0 ± 5.6 | 26.5 ± 6.1 |
| L3 SMI (cm2/m2) | 46.0 ± 8.2 | 48.7 ± 8.7 | 43.8 ± 7.1 |
| Low SMI | 39 (26.7) | 11 (16.7) | 28 (35.0) |
| Lumbar BMD (g/cm2) | 1.030 ± 0.172 | 1.136 ± 0.159 | 0.943 ± 0.129 |
| Femoral BMD (g/cm2) | 0.882 ± 0.186 | 1.025 ± 0.128 | 0.764 ± 0.116 |
| DXA T-score category (femur) | — | ||
| T > −1.0 | 66 (45.2) | 66 (100) | 0 |
| −2.5 < T ≤ −1.0 | 64 (43.8) | 0 | 64 (80.0) |
| T ≤ −2.5 | 16 (11.0) | 0 | 16 (20.0) |
| Postmenopausal women (age ≥ 50) | 86 (58.9) | 32 (48.5) | 54 (67.5) |
a Values are expressed as mean ± SD or No. (%). Low BMD was defined as total femur T-score ≤ −1.0 for the study analysis. Low SMI was defined as L3 SMI < 52.4 cm2/m2 in men and < 38.5 cm2/m2 in women. T-score categories are descriptive and do not represent clinical diagnoses in patients aged < 50 years. Abbreviations: BMD, bone mineral density; SD, standard deviation; BMI, Body Mass Index; L3, third lumbar vertebra; SMI, skeletal muscle index; DXA, dual-energy X-ray absorptiometry.
4.2. Correlation Analyses
Across the full cohort, L3 SMI correlated positively with mean L1–L4 lumbar BMD (r = 0.33, P < 0.001) and total femur BMD (r = 0.43, P < 0.001). Correlations were stronger in patients aged ≥ 50 years (lumbar r = 0.42 and femoral r = 0.44; both P < 0.001). The correlation with lumbar BMD was negligible in those aged < 50 years (r = 0.01, P = 0.933). Stratified results are presented in Table 2.
Table 2.
Pearson Correlation Coefficients Between L3 SMI and BMD, Stratified by Sex and Age Group a
| Subgroup | n | Lumbar BMD r | P value | Femoral BMD r | P value |
|---|---|---|---|---|---|
| All patients | 146 | 0.33 | < 0.001 | 0.43 | < 0.001 |
| Age ≥ 50 (y) | 107 | 0.42 | < 0.001 | 0.44 | < 0.001 |
| Age < 50 (y) | 39 | 0.01 | 0.933 | 0.45 | 0.004 |
| Males | 36 | 0.47 | 0.003 | 0.73 | < 0.001 |
| Females | 110 | 0.22 | 0.020 | 0.31 | 0.001 |
| Postmenopausal women (≥ 50) | 86 | 0.31 | 0.004 | 0.36 | 0.001 |
a All P values are two-sided. Abbreviations: L3, third lumbar vertebra; SMI, Skeletal Muscle Index; BMD, bone mineral density.
4.3. Low Skeletal Muscle Index and Bone Mineral Density
In the whole cohort, patients with low SMI (n = 39) had significantly lower lumbar BMD (0.96 ± 0.15 vs 1.06 ± 0.17 g/cm2, P = 0.004) and femoral BMD (0.81 ± 0.18 vs 0.91 ± 0.18 g/cm2, P = 0.005) than patients with normal SMI. Differences were also significant when the analysis was restricted to postmenopausal women aged ≥ 50 years (n = 86): women with low SMI (n = 15) had lower lumbar BMD (0.89 ± 0.12 vs 1.02 ± 0.17 g/cm2, P = 0.003) and femoral BMD (0.71 ± 0.21 vs 0.88 ± 0.19 g/cm2, P = 0.002) than their counterparts with normal SMI (n = 71). Formal interaction testing did not support effect modification by age stratum (SMI × age stratum: OR, 1.068; 95% CI, 0.901 - 1.266; P = 0.449) or sex (OR, 0.866; 95% CI, 0.732 - 1.024; P = 0.093); the subgroup findings are therefore descriptive. Results are summarized in Table 3, and threshold sensitivity analyses are presented in Supplementary Table S2.
Table 3.
Anthropometric and BMD Comparison Between Patients with and Without Low SMI a
| Variables | Whole Cohort (n = 146) | Postmenopausal Women ≥ 50 (n = 86) b | ||||
|---|---|---|---|---|---|---|
| Low SMI (n = 39) | Normal SMI (n = 107) | P value | Low SMI (n = 15) | Normal SMI (n = 71) | P value | |
| BMI (kg/m2) | 24.0 ± 4.9 | 29.6 ± 5.8 | < 0.001 | 25.7 ± 5.1 | 30.7 ± 5.7 | 0.003 |
| Lumbar BMD (g/cm2) | 0.96 ± 0.15 | 1.06 ± 0.17 | 0.004 | 0.89 ± 0.12 | 1.02 ± 0.17 | 0.003 |
| Femoral BMD (g/cm2) | 0.81 ± 0.18 | 0.91 ± 0.18 | 0.005 | 0.71 ± 0.21 | 0.88 ± 0.19 | 0.002 |
a Values are expressed as mean ± SD. All P values are two-sided. Low SMI was defined as L3 SMI < 52.4 cm2/m2 in men and < 38.5 cm2/m2 in women (11). Abbreviations: BMD, bone mineral density; BMI, Body Mass Index; L3, third lumbar vertebra; SD, standard deviation; SMI, skeletal muscle index.
b Women aged ≥ 50 years were classified as postmenopausal using an age-based proxy.
4.4. Predictive Models for Low Bone Mineral Density
Model 1 (age + sex) achieved an AUC of 0.672 (95% CI, 0.580 - 0.763). Adding L3 SMI (Model 2) significantly improved the AUC to 0.753 (95% CI, 0.683 - 0.837); ΔAUC was 0.081 (95% CI, 0.010 - 0.186; P = 0.021). After adjustment for age and sex, each 1 cm2/m2 increase in L3 SMI was associated with lower odds of low BMD (OR, 0.882; 95% CI, 0.831 - 0.936; P < 0.001).
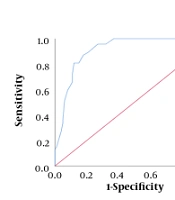
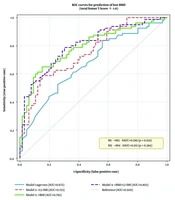
When BMI was included (Model 3: AUC = 0.792), adding SMI (Model 4) yielded a small, nonsignificant AUC gain (ΔAUC, 0.011; 95% CI, −0.007 - 0.049; P = 0.284). Nevertheless, SMI remained independently associated with low BMD in Model 4 (OR, 0.927; 95% CI, 0.868 - 0.990; P = 0.024). The SMI–BMI correlation was r = 0.45, indicating partial but incomplete overlap. Model performance is summarized in Table 4, and complete regression coefficients for all predictors are presented in Table 5. The corresponding ROC curves are shown in Figure 3. Model 4 showed acceptable calibration (Brier score, 0.181), with modest optimism on internal validation (optimism-corrected AUC, 0.783; calibration slope, 0.895). Hosmer–Lemeshow results across group counts are provided in Supplementary Table S3. When the analysis was restricted to patients aged ≥ 50 years (n = 107), the incremental discrimination of SMI beyond age and sex was preserved (ΔAUC, 0.072; 95% CI, 0.012 - 0.150; P = 0.011), whereas the SMI coefficient in the fully adjusted model was no longer nominally significant (OR, 0.933; 95% CI, 0.867 - 1.005; P = 0.067; Supplementary Table S1).
Table 4.
Logistic Regression Model Performance for Prediction of Low BMD a
| Model | AUC (95% CI) | ΔAUC vs Reference (95% CI) | P value | SMI OR (95% CI) |
|---|---|---|---|---|
| Model 1: Age + Sex | 0.672 (0.580 - 0.763) | Reference | — | — |
| Model 2: Age + Sex + L3 SMI | 0.753 (0.683 - 0.837) | +0.081 (0.010 - 0.186) vs M1 | 0.021 | 0.882 (0.831 - 0.936) |
| Model 3: Age + Sex + BMI | 0.792 (0.719 - 0.871) | Reference (for Model 4) | — | — |
| Model 4: Age + Sex + BMI + L3 SMI | 0.803 (0.734 - 0.884) | +0.011 (−0.007 - 0.049) vs M3 | 0.284 | 0.927 (0.868 - 0.990) |
a SMI ORs are reported per 1 cm2/m2 increase in L3 SMI. ΔAUC compares Model 2 with Model 1 and Model 4 with Model 3. Confidence intervals for AUC and ΔAUC and two-sided P values for ΔAUC were obtained using paired bootstrap percentile resampling (3,000 iterations). Abbreviations: BMD, bone mineral density; AUC, area under the receiver operating characteristic curve; CI, confidence interval; SMI, skeletal muscle index; BMI, Body Mass Index; L3, third lumbar vertebra; ΔAUC, difference in AUC; OR, odds ratio.
Table 5.
Complete Logistic Regression Results for All Predictors a
| Models and Predictors | OR | 95% CI | P value |
|---|---|---|---|
| Model 1: Age + Sex | |||
| Age | 1.024 | 1.001 - 1.047 | 0.044 |
| Male sex | 0.449 | 0.199 - 1.014 | 0.054 |
| AIC = 196.1 | |||
| Model 2: Age + Sex + SMI | |||
| Age | 1.033 | 1.007 - 1.060 | 0.014 |
| Male sex | 0.752 | 0.296 - 1.913 | 0.550 |
| L3 SMI | 0.882 | 0.831 - 0.936 | < 0.001 |
| AIC = 174.8 | |||
| Model 3: Age + Sex + BMI | |||
| Age | 1.043 | 1.015 - 1.072 | 0.002 |
| Male sex | 0.222 | 0.086 - 0.572 | 0.002 |
| BMI | 0.829 | 0.763 - 0.902 | < 0.001 |
| AIC = 171.3 | |||
| Model 4: Age + Sex + BMI + SMI | |||
| Age | 1.043 | 1.015 - 1.073 | 0.003 |
| Male sex | 0.370 | 0.128 - 1.071 | 0.067 |
| BMI | 0.874 | 0.796 - 0.960 | 0.005 |
| L3 SMI | 0.927 | 0.868 - 0.990 | 0.024 |
| AIC = 167.6 |
a The outcome was low BMD (total femur T-score ≤ −1.0), with 80 events among 146 patients (20.0 events per predictor in Model 4). Continuous-predictor ORs are reported per 1-year increase in age, 1 kg/m2 increase in BMI, or 1 cm2/m2 increase in SMI. Sex ORs compare men with women. All P values are two-sided. Abbreviations: BMD, bone mineral density; L3, third lumbar vertebra; OR, odds ratio; CI, confidence interval; SMI, skeletal muscle index; BMI, Body Mass Index; AIC, Akaike information criterion.
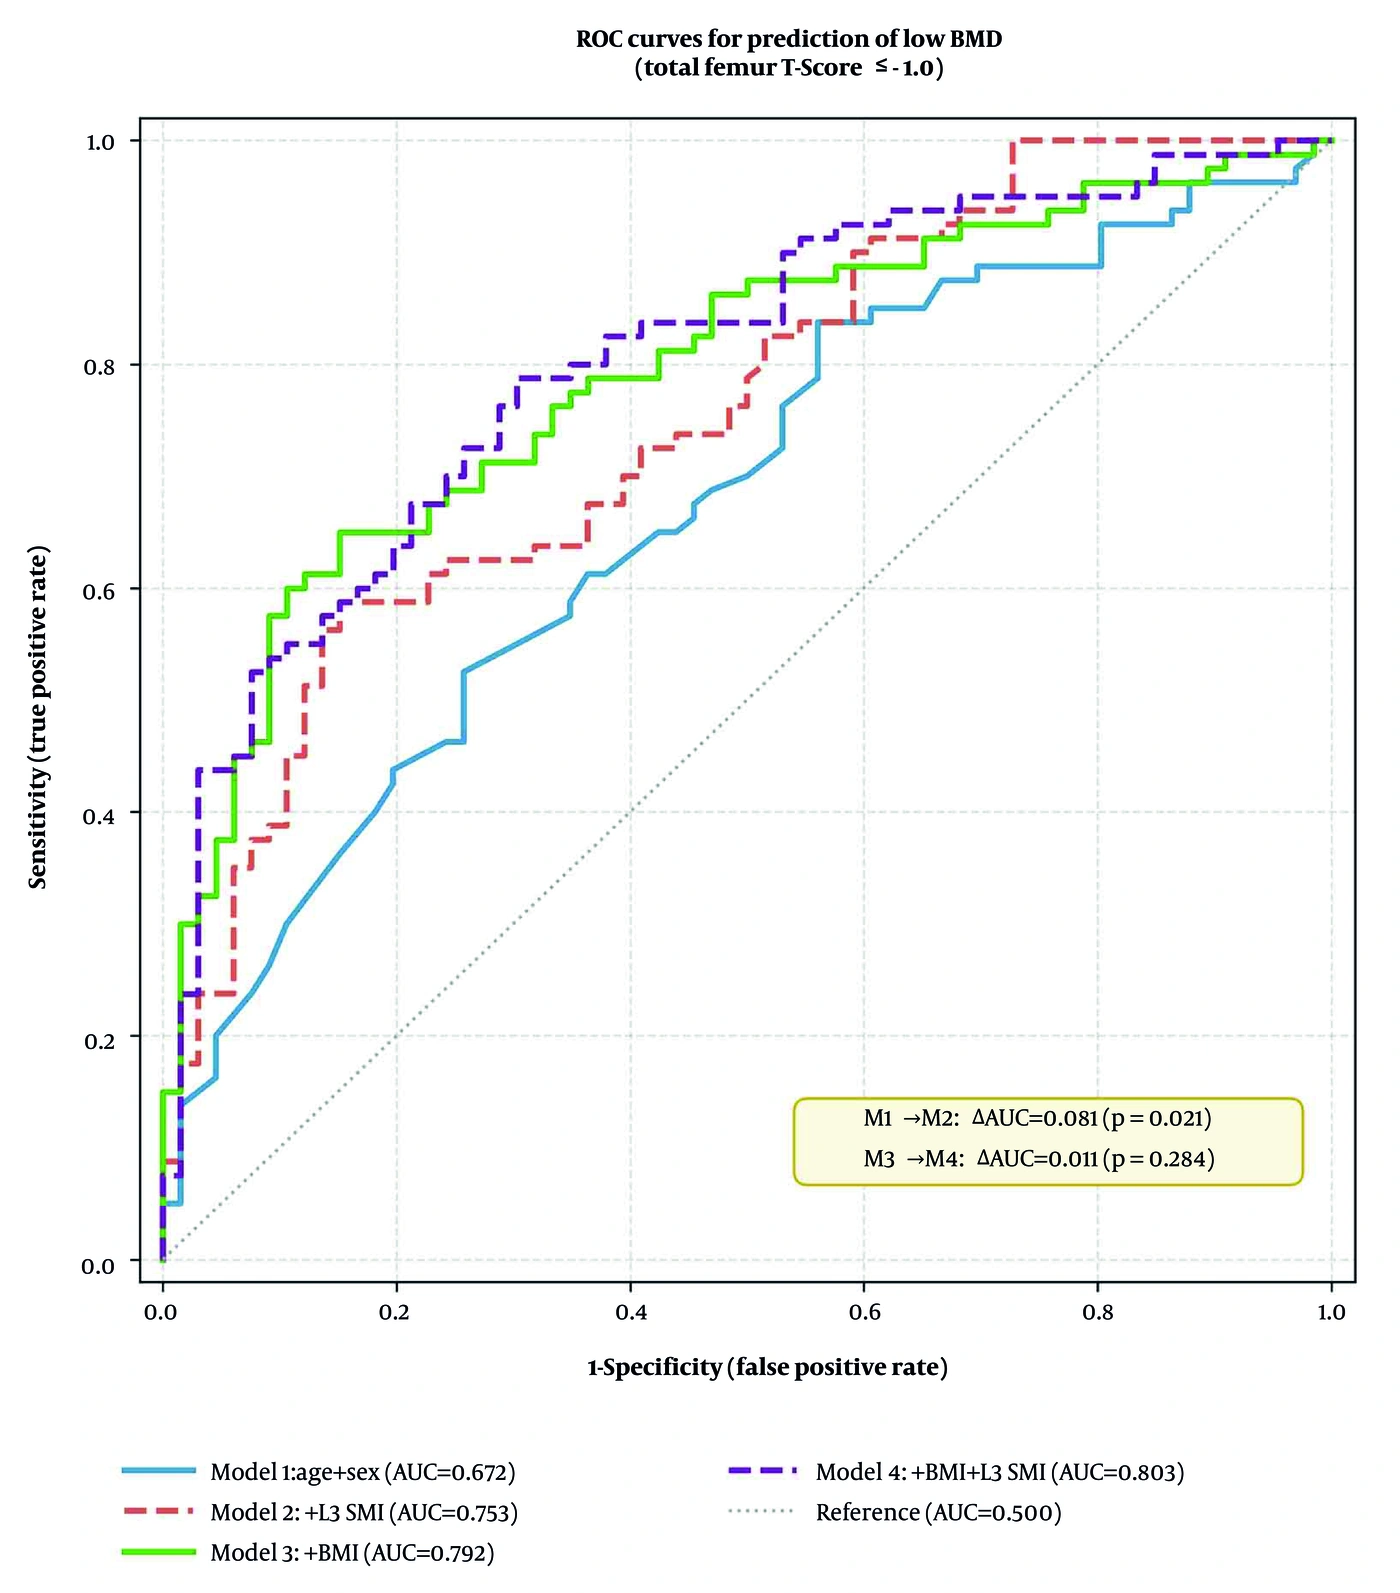
Figure 3.
Receiver operating characteristic curves for prediction of low BMD (total femur T-score ≤ −1.0) across four logistic regression models. Model 1: age + sex (AUC = 0.672); Model 2: age + sex + L3 SMI (AUC = 0.753); Model 3: age + sex + BMI (AUC = 0.792); Model 4: age + sex + BMI + L3 SMI (AUC = 0.803). Solid lines indicate models without SMI; dashed lines indicate models with SMI. ROC (receiver operating characteristic); BMD (bone mineral density); AUC (area under the receiver operating characteristic curve); SMI (skeletal muscle index); BMI (body mass index); L3 (third lumbar vertebra).
5. Discussion
In this single-center retrospective observational study of 146 adults without lumbar degeneration, CT-derived L3 SMI showed a modest but statistically significant positive association with both lumbar and femoral BMD. This observation is consistent with earlier reports highlighting the role of muscle mass in bone health through mechanical loading and shared metabolic and endocrine pathways (15-17).
Adding L3 SMI to age and sex significantly improved model discrimination, raising the AUC from 0.672 to 0.753 (ΔAUC, 0.081; 95% CI, 0.010 - 0.186; P = 0.021). However, when BMI was incorporated into the base model, the additional contribution of SMI was attenuated and was no longer significant (ΔAUC, 0.011; P = 0.284). This attenuation likely reflects collinearity between SMI and BMI. L3 SMI correlated moderately with BMI (r = 0.45), and patients with low SMI had substantially lower BMI than those with normal SMI (24.0 ± 4.9 vs 29.6 ± 5.8 kg/m2, P < 0.001; Table 3), indicating that low muscle mass and low body weight frequently coexisted in this cohort. Thus, once BMI was included in the model, the additional information provided by SMI was largely redundant. In populations with a higher prevalence of low muscle mass coexisting with obesity, in which low muscle mass occurs despite normal or elevated BMI, SMI may provide greater incremental value beyond BMI. SMI remained independently associated with low BMD after full adjustment (OR, 0.927; P = 0.024). The persistence of this independent association despite BMI adjustment suggests that muscle quantity may capture aspects of musculoskeletal health not fully reflected by body weight alone. This finding is consistent with DXA-based work in adults with metabolic syndrome, in which distinct body composition compartments showed differing associations with BMD, indicating that total body mass alone does not fully account for the relationship between soft tissue and bone (18). Nevertheless, the clinical threshold for this incremental gain has not yet been established, and larger prospective studies are needed before routine integration into clinical practice can be recommended.
Degenerative alterations of the lumbar spine may artificially increase DXA-measured lumbar BMD, potentially obscuring osteoporosis (19, 20). By excluding patients with radiologic evidence of lumbar degeneration, the present study aimed to minimize this confounding and provide a clearer estimate of the true SMI–BMD relationship.
The coexistence of low bone mass and sarcopenia, commonly termed osteosarcopenia, highlights the clinical importance of assessing muscle and bone health together. In older adults, this phenotype has been associated with falls, fractures, functional impairment, and mortality (16, 17). Hip and other osteoporotic fractures are also associated with excess mortality (21-23). Abdominal CT obtained for other indications allows concurrent assessment of muscle mass without additional radiation exposure, with L3 serving as a validated landmark (24, 25). CT has also been compared directly with densitometry as a means of identifying reduced bone mass in selected clinical populations, supporting the premise that routinely acquired CT contains useful information on skeletal status (26). Whether this approach can be translated into a cost-effective screening strategy requires prospective validation in larger and more diverse populations (27).
5.1. Study Limitations
This study has several limitations. First, the single-center Turkish population limits generalizability. Second, postmenopausal status was approximated by age ≥ 50 years; hormonal confirmation was unavailable, introducing potential misclassification. Third, only CT-derived muscle quantity was assessed; muscle strength and physical performance were not measured. Therefore, our findings concern CT-defined low muscle mass rather than sarcopenia as currently defined by consensus criteria (28). Fourth, the retrospective design precludes causal inference, and the reported AUCs reflect apparent discrimination in a single cohort without external validation. Fifth, SMI was measured by a single reader; although intraobserver reproducibility was good (ICC = 0.81), interobserver reproducibility was not assessed. Sixth, the prevalence of low SMI in this cohort (26.7%) was lower than the sarcopenia prevalence commonly reported in older populations (30 - 50%), likely reflecting the relatively younger mean age (58.9 years) and the hospital-based case mix rather than a community-dwelling elderly sample. This may limit generalizability to older or frailer populations. Seventh, the SMI thresholds applied were derived in obese patients with malignancy, and no validated L3 thresholds exist for the Turkish population. Estimated prevalence varied from 26.7% to 14.4% depending on the threshold set (Supplementary Table S2), underscoring the need for population-specific reference values. Eighth, the primary outcome used a total femur T-score ≤ −1.0 across all ages, including 39 patients aged < 50 years, for whom Z-scores are the preferred reporting metric. Among these younger patients, complete concordance was observed specifically between total femur T-score ≤ −2.5 and Z-score ≤ −2.0; this concordance did not extend to the primary T-score ≤ −1.0 threshold. In the age-restricted analysis, SMI retained incremental discrimination beyond age and sex, but its association in the fully adjusted model did not reach statistical significance (P = 0.067; Supplementary Table S1). The fully adjusted association was also not statistically significant under the hybrid outcome definition (P = 0.088; Supplementary Note). These sensitivity analyses warrant cautious interpretation of the fully adjusted association and do not establish effect modification by age. Finally, the study was not powered to detect interaction effects of plausible magnitude, and the incremental predictive value of SMI beyond BMI was limited.
Prospective multicenter studies in diverse populations are warranted to confirm these findings and assess the clinical utility of integrating SMI measurement into routine CT workflows.
5.2. Conclusions
In adults without lumbar degeneration, CT-derived L3 SMI showed a modest positive association with lumbar and femoral BMD. Low SMI was associated with significantly lower BMD in the whole cohort and in the postmenopausal subgroup, although interaction testing did not support a stronger association in either group. Adding SMI to age and sex significantly improved discrimination, but this gain was attenuated after adjustment for BMI, likely reflecting collinearity between low muscle mass and low body weight. CT-derived SMI may therefore have a role in osteoporosis risk stratification, but prospective multicenter studies in larger and more diverse populations are warranted before clinical recommendations can be made.