


1. Background
2. Objectives
3. Patients and Methods
3.1. Study Design and Setting
3.2. Participants
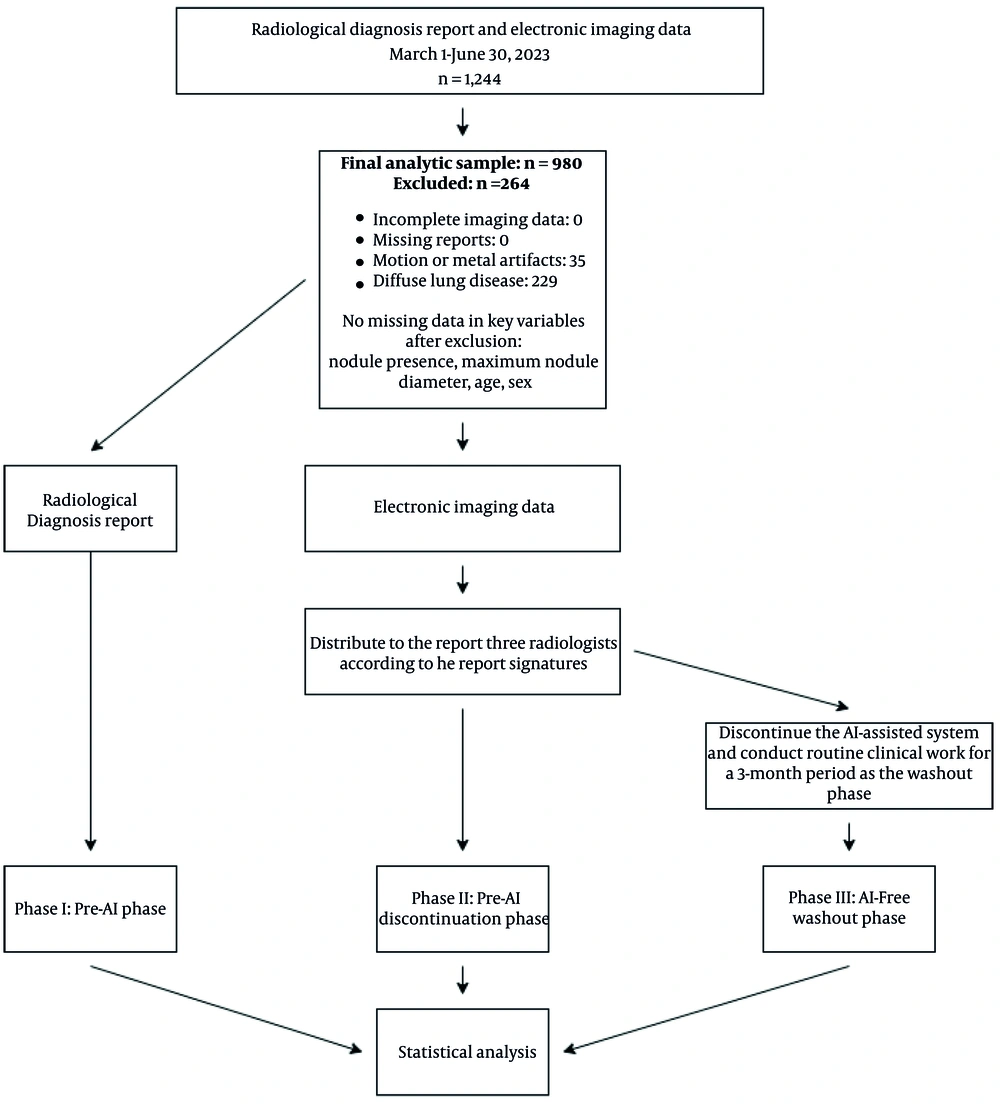
Study flowchart showing case screening, inclusion and exclusion across the three study phases
3.3. CT Acquisition Parameters
3.4. AI System and Routine Workflow
3.5. Study Procedure and Blinding
3.6. Outcome Definitions
3.7. Bias and Sample Size
3.8. Statistical Analysis
4. Results
4.1. Study Population
| Variables | Values |
|---|---|
| Chest CT examinations included | 980 |
| Unique patients | 975 |
| Patients with two examinations | 5 |
| Male/female patients | 494/486 |
| Age, y | 57.94 ± 19.34 |
| Median age (Q1–Q3), y | 60 (46 - 73) |
| Age range, y | 3 - 97 |
| Patients aged < 60/≥ 60 y | 485/495 |
| Pediatric examinations (< 18 y) | 48/980 (4.9%) |
Abbreviation: CT, computed tomography.
a Values are presented as median (Q1–Q3) or mean ± standard deviation (SD) or number as appropriate (Q1–Q3, first to third quartiles).
4.2. Phase-Associated Changes in Scan-Level Pulmonary Nodule Detection
| Characteristic | Phase I: Pre-AI baseline | Phase II: Post-AI discontinuation | Phase III: AI-free washout | Cochran's Q (chi-square) | P-value |
|---|---|---|---|---|---|
| Pulmonary nodule detection | 370/980 (37.8%) A; [95% CI 34.8 - 40.8] | 260/980 (26.5%) B; [95% CI 23.9 - 29.4] | 423/980 (43.2%) C; [95% CI 40.1 - 46.3] | 157.114 | < 0.001 |
| Male | 201/494 (40.7%) A; [95% CI 36.4 - 45.1] | 146/494 (29.6%) B; [95% CI 25.7 - 33.7] | 223/494 (45.1%) A; [95% CI 40.8 - 49.6] | 74.905 | < 0.001 |
| Female | 169/486 (34.8%) A; [95% CI 30.7 - 39.1] | 114/486 (23.5%) B; [95% CI 19.9 - 27.4] | 200/486 (41.2%) C; [95% CI 36.9 - 45.6] | 82.478 | < 0.001 |
| Age < 60 (y) | 167/485 (34.4%) A; [95% CI 30.3 - 38.8] | 109/485 (22.5%) B; [95% CI 19.0 - 26.4] | 192/485 (39.6%) C; [95% CI 35.3 - 44.0] | 83.038 | < 0.001 |
| Age ≥ 60 (y) | 203/495 (41.0%) A; [95% CI 36.8 - 45.4] | 151/495 (30.5%) B; [95% CI 26.6 - 34.7] | 231/495 (46.7%) C; [95% CI 42.3 - 51.1] | 74.346 | < 0.001 |
| Maximum reported nodule diameter ≤ 5 mm | 260/980 (26.5%) A; [95% CI 23.9 - 29.4] | 155/980 (15.8%) B; [95% CI 13.7 - 18.2] | 306/980 (31.2%) C; [95% CI 28.4 - 34.2] | 142.063 | < 0.001 |
| Maximum reported nodule diameter > 5 to ≤ 8 mm | 73/980 (7.4%); [95% CI 6.0 - 9.3] | 69/980 (7.0%); [95% CI 5.6 - 8.8] | 77/980 (7.9%); [95% CI 6.3 - 9.7] | 2.526 | 0.283 |
| Maximum reported nodule diameter > 8 mm | 37/980 (3.8%); [95% CI 2.8 - 5.2] | 36/980 (3.7%); [95% CI 2.7 - 5.0] | 40/980 (4.1%); [95% CI 3.0 - 5.5] | 1.625 | 0.444 |
Abbreviation: AI, artificial intelligence; CI, confidence interval.
a Values are expressed as n/N (%).
b Different superscript letters within a row indicate significant pairwise differences based on post-hoc McNemar tests using a Bonferroni-corrected significance threshold of P<0.017; phases sharing the same letter are not significantly different.
| Comparison | Absolute difference (percentage points) | 95% CI |
|---|---|---|
| Phase II vs phase I | -11.2 | -13.7 to -8.8 |
| Phase III vs phase I | +5.4 | +2.8 to +8.0 |
| Phase III vs phase II | +16.6 | +14.1 to +19.2 |
Abbreviation: CI, confidence interval.
a Absolute differences in scan-level pulmonary nodule detection are presented as percentage-point differences with 95% confidence intervals (CIs), derived from paired scan-level comparisons of the same 980 examinations.
4.3. Primary GEE Analysis
| Comparison | aOR | 95% CI | P-value |
|---|---|---|---|
| Phase II vs phase I | 0.595 | 0.530 - 0.667 | < 0.001 |
| Phase III vs phase I | 1.253 | 1.123 - 1.398 | < 0.001 |
| Phase III vs phase II | 2.106 | 1.874 - 2.366 | < 0.001 |
Abbreviations: aOR, adjusted odds ratio; CI, confidence interval; GEE, generalized estimating equation.
a Population-averaged logistic GEE model adjusted for radiologist, with scan_id as the clustering variable, an exchangeable working correlation structure, and robust standard errors. Values are presented as aORs with 95% CIs. An aOR >1 indicates higher odds of pulmonary nodule detection relative to the reference phase.
4.4. Scan-Level Agreement and Discordance Across Phase Pairs
4.5. Stratified Analyses by Sex, Age, and Nodule Size
| Subgroup | Phase I: Pre-AI baseline | Phase II: Post-AI discontinuation | Phase III: AI-free washout | Cochran's Q (chi-square) | P-value |
|---|---|---|---|---|---|
| Male | 134/494 (27.1%) A | 81/494 (16.4%) B | 152/494 (30.8%) A | 67.554 | < 0.001 |
| Female | 126/486 (25.9%) A | 74/486 (15.2%) B | 154/486 (31.7%) C | 74.909 | < 0.001 |
| Age < 60 (y) | 136/485 (28.0%) A | 78/485 (16.1%) B | 159/485 (32.8%) C | 80.415 | < 0.001 |
| Age ≥ 60 (y) | 124/495 (25.1%) A | 77/495 (15.6%) B | 147/495 (29.7%) A | 62.098 | < 0.001 |
Abbreviation: AI, artificial intelligence.
a Values are expressed as n/N (%).
b Different superscript letters within a row indicate significant pairwise differences based on post-hoc McNemar tests using a Bonferroni-corrected significance threshold of P < 0.017; phases sharing the same letter are not significantly different.
4.6. Changes in Maximum Reported Nodule Diameter
| Characteristic | Phase I: Pre-AI baseline | Phase II: Post-AI discontinuation | Phase III: AI-free washout | Friedman χ² | P-value |
|---|---|---|---|---|---|
| Maximum reported nodule diameter, mm | 4 (3 - 6) A | 5 (4 - 7) B | 4 (3 - 6) A | 28.660 | < 0.001 |
| Male | 5 (4 - 6) A | 5 (4 - 7) B | 5 (4 - 6) A | 14.217 | 0.001 |
| Female | 4 (3 - 6) A | 5 (4 - 7) B | 4 (3 - 5) A | 14.208 | 0.001 |
| Age < 60 (y) | 4 (3 - 5) A | 5 (4 - 6) B | 4 (3 - 5) A | 13.604 | 0.001 |
| Age ≥ 60 (y) | 5 (4 - 7) A | 5 (4 - 8) B | 5 (4 - 7) A | 13.784 | 0.001 |
Abbreviation: AI, artificial intelligence.
a Data are presented as median (Q1-Q3), in millimeters. Q1-Q3, first to third quartiles.
b Different superscript letters within a row indicate significant pairwise differences based on post-hoc Wilcoxon signed-rank tests using a Bonferroni-corrected significance threshold of P < 0.017; phases sharing the same letter are not significantly different.
