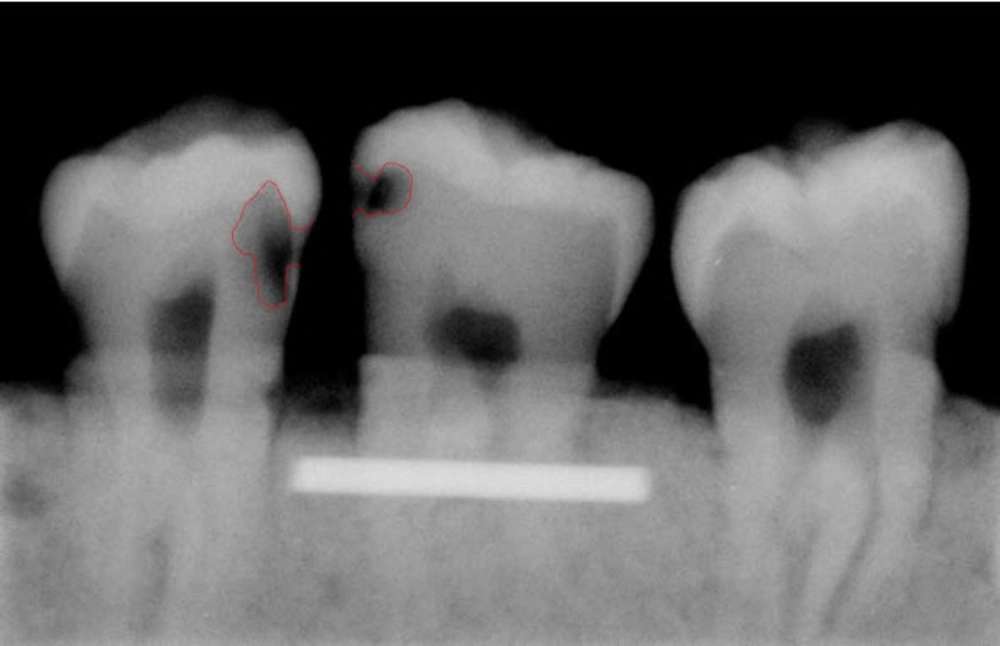
A total of 93 extracted posterior teeth were used in the design phase and 128 in the assessment phase of the software with no restorative materials. None of the teeth had any fracture, or anomalies in shape or size and no gross caries. The teeth had to have intact enamel in the gingival wall of the proximal cavity. The teeth with occlusal, buccal or lingual caries were excluded from the study. Before designing the software, digital radiographs were obtained from proximal surfaces of 183 teeth using Dixi
® digital radiographic system (ZV3, Planmeca, Helsinki, Finland). These images were used to train the software designer and to extract basic information. The teeth were stored in 10% formalin solution for more than 24 hours for disinfection and mounted in blocks made of plaster and sawdust in a way that three teeth were placed next to each other with no overlap in their interproximal surfaces. Soft tissue wax up was performed using one layer of 18mm diameter plexiglass sheet and CCD sensor (Dixi, Planmeca, Helsinki, Finland) was placed parallel to the teeth. In order to ensure the reproducibility of the radiographic positioning, the sensor and dental block were placed parallel in a custom-made device for guiding X ray beams, so that the distance of sensor from the source remained constant (25 cm) in all radiographies. Periapical radiographs were taken with Gendex intraoral X ray system (Dentsply, IL, USA, 65kVp, 7 mA), using parallel technique with an exposure time of 0.08. These images were stored in JPEG format. In this phase, the software designer needed some basic information about the shape and form of proximal caries. Routinely, in clinic, when dentists or oral radiologists evaluate dental radiographs in terms of existence and extension of caries, they determine the margin of caries regarding to all radiographic criteria and based on caries extension into the teeth, that appears as a radiolucent area with a density less than tooth structure, and then they decide about the treatment. In this study, for definition and instruction of caries margins to the software designer who was not familiar to definition of dental caries in digitized radiographs, caries margins and the extent of caries were determined manually by drawing a line using Photoshop software by an expert radiologist. We also shared a number of intact caries free teeth with the designer to let him know how the intact surfaces appear in a radiograph, thus reducing the false positive records as much as possible (
Figure 1).
3.1. Design Phase
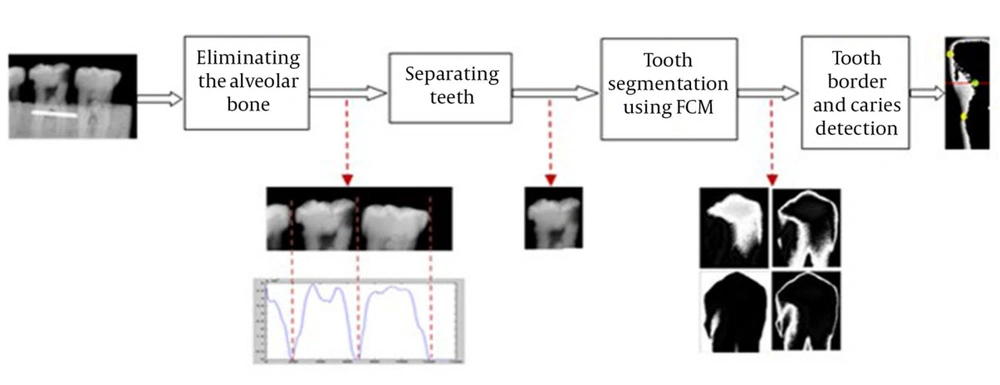
In literature, there are number of researches with focus on automatic caries detection. Several learning algorithms have been used to learn the features and specifications of the caries area. However, as the caries region might have a very small area in various shapes and appearances, no learning algorithm would guarantee a good performance and detection accuracy. Recent researches have examined a new approach called image segmentation to cope with the difficulties of this problem. In computer vision, image segmentation is the process of partitioning a digital image into multiple segments (sets of pixels). The goal of segmentation is to simplify and/or change the representation of an image into something that is more meaningful and easier to analyze. Image segmentation is typically used to locate objects and boundaries (lines, curves, etc.) in images. More precisely, it is the process of assigning a label to every pixel in an image such that pixels with the same label share certain characteristics. As we aim to label the caries area in the image, the designed software basically uses the segmentation technique. The schematic diagram in
Figure 2 shows the software’s functionality for automatic caries detection. All the steps demonstrated in the
figure are done automatically. In the designed software, we assume that the primary images include one, two or three teeth that are positioned parallel to their longitudinal axis. They should not overlap each other so that the software would be able to distinguish and separate each tooth. By doing so, images entering the caries detection phase would only contain one tooth and therefore, detecting the caries area in them would be more accurate. Separating teeth in the radiography image also makes the caries detection phase independent from the type of the input image, so the image could contain one, two or three teeth. Even if the radiography image has been taken from the upper jaw, a simple pre-processing is required to rotate the image so that teeth in the image are upward. It is worth emphasizing that the designed software can handle cases where teeth in the radiographic image have small overlap in their interproximal surfaces. However, for more accurate results and better software analysis, these cases where excluded from this study. Based on the diagram in
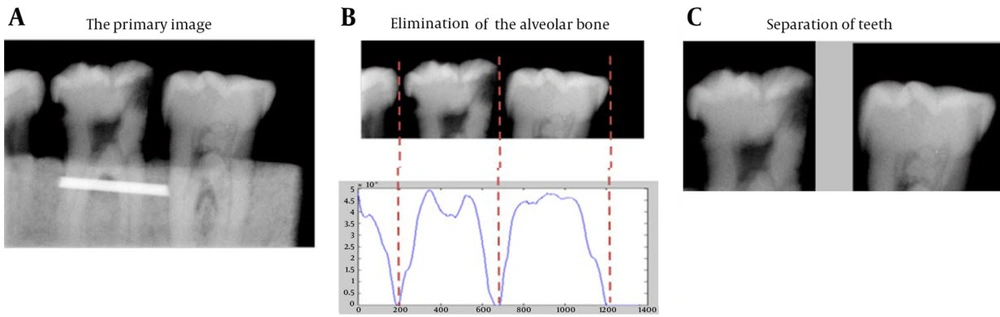
Figure 3 the tooth separation phase consists of two steps:
Elimination of the part of tooth located in the alveolar bone (here, the dental block material). The perfect place for cutting the image is chosen based on the summed density of image pixels in each row of the input image (
Figure 3 A). As the sum of the density of the pixels (in each row) in the alveolar bone area is much higher than the sum of density of the pixels out of the alveolar bone area, these two sections can be separated automatically with high accuracy using the gradient method. The aim of this part is to remove the alveolar bone section (and the other details that are not helpful for tooth separation) to make the tooth separation phase easier and more accurate.
Distinguishing and separating each tooth from the adjacent teeth by using the summed density of image pixels in each column (
Figure 3 B). Approximately, a zero-sum density is expected in the column that separates the two teeth, because of the dark pixels in this column of the image. As mentioned before, if the teeth in the image have small overlap with each other, the sum of densities in separating column will not be zero (as it can be seen in
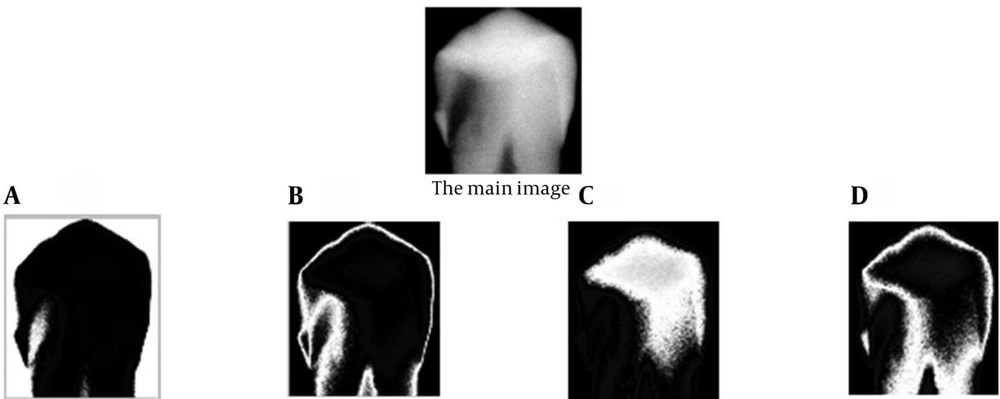
Figure 3 B), but it will remain small enough to depict the limit for separation of two adjacent teeth. Therefore, a small and near zero threshold is set for the software to distinguish the separating columns. This threshold can be set automatically using the image size. However, as it is expected, caries detection in images with superimposed teeth would not be that accurate because of the vague border of each tooth. After separation of teeth and elimination of the alveolar bone area from the image, the software tries to segment the tooth into four segments (
Figure 4). For this purpose, the FCM (Fuzzy C-Means clustering) algorithm is applied to the image, which has only one tooth. FCM algorithm is a very important tool in image processing for segmenting or clustering objects in an image. It is referred to as a soft clustering method where data elements can belong to more than one cluster, and associated with each element is a set of membership levels.
The greater the belonging of a data element to a cluster, the higher the likelihood of that particular data element to be in the respective cluster. In other words, we believe that image pixels in each cluster have more similar gray levels compared to the pixels that are in other clusters. The nearer the gray level of a pixel to a center of a cluster, the more probable the belonging of that pixel to that cluster. It should be noted that FCM has been selected from a wide range of available algorithms for segmentation and clustering, because of its soft clustering nature. As the densities in different segments of the tooth (specially the caries area) might be very similar to each other, soft clustering brings the opportunity for better caries detection. Also, FCM considers the adjacency of the pixels in each image. As tooth segments (such as dentine and enamel) are supposed to be continuous areas, this algorithm works well for tooth segmenting purpose. In fact, the FCM minimizes the following criteria (
Equation 1):
where C and N are the number of clusters (or segments) and pixels respectively, C
j is the center for the j-th cluster, x
i is the gray level of the i-th pixel and u
ijm shows the degree of membership of x
i in the cluster j. For each pixel in the image, the cluster with the highest membership degree is considered as the cluster that the pixel belongs to (
Figure 4).
In this software, parameter j in FCM algorithm has been set to four experimentally; therefore, each tooth image is segmented to four clusters. After applying FCM, each tooth is divided into four segments. The first segment (
Figure 4 A) generally represents the background area of the image and the following segments generally demonstrate the tooth enamel (
Figure 4 B), dentin (
Figure 4 C) and dental pulp (
Figure 4 D), respectively. However, as it can be observed in
Figure 4, this categorization is approximately clinical and shows the tooth structure only to some extent, but it can be used for detection of carious lesions. After clustering, a combination of clusters is prepared and entered into the caries detector algorithm.
A curve compatible with the external surface of the tooth border is detected by the software using an edge detection algorithm and presence of caries is examined based on the trend of alterations in the outer border of the tooth (
Figure 5). In fact, we assumed that the border of a normal tooth has no extreme (distinct minima or maxima) and the deformation in the border of a healthy tooth is smooth (at least locally). Since cavities in the tooth border curve violate this assumption and can produce big variations in the border curve, this assumption has been used as a natural and logical measure to detect cavity (
Figure 5 B). The software detects the local maxima or minima points in the border curve using a gradient method and introduces them as candidates for deepest points of the caries lesion. In order to determine the depth of carious lesions, a line is drawn by the software connecting the two apical and coronal points of a carious lesion (extracted from the curve in
Figure 5 B) in the external border of a tooth (
Figure 5 D). This line shows the approximate border of the intact tooth in the carious region that is based on our assumption of smooth border for the tooth. By marking the midpoint of this line and connecting it to the deepest point of the carious lesion, a line is obtained whose length is indicative of the depth of the carious lesion (
Figure 5 D). In order to convert its unit to mm, a one cm metal index was placed in dental blocks before taking the images, to identify the magnification rate of radiographs (
Figure 5 D).
One important point that has been seen in the designed software is that there are various indications for teeth extraction. Even intact teeth may be extracted because of orthodontic requirements to provide enough space for misaligned adjacent teeth. Therefore, the designed software makes no pre-assumption on the teeth health or shape in the input image and every tooth in that image may or may not contain caries. Actually, the software separates teeth in the image and does all the processing phases to investigate each tooth for existing caries. So, this study also contained intact teeth and did not involve carious teeth necessarily.
Since the borders in an intact tooth are expected to be smooth curves with no distinct extreme, the chance of labeling an intact tooth as a tooth with cavity is very small in this software. Therefore, it seems that there is no need for negative state investigation in this classification. As automatic caries detection is a challenging problem in its nature, the designed software has made some assumptions (such as non-overlapped teeth) in its first design. However, the software can be improved to detect caries in harder cases. However, no automatic caries detection software can guarantee high performance in such cases. Actually, the software can be improved for these cases to measure the caries probability with an accuracy percent (e.g. to say that the tooth border has caries with a 1mm depth and 80% accuracy). Also, it is rational to change the software from an automatic one to a semi-automatic software for hard cases, when the software asks for manual expert help in some processing phases to improve the accuracy. After the design phase, 128 teeth were used to assess the software’s function.
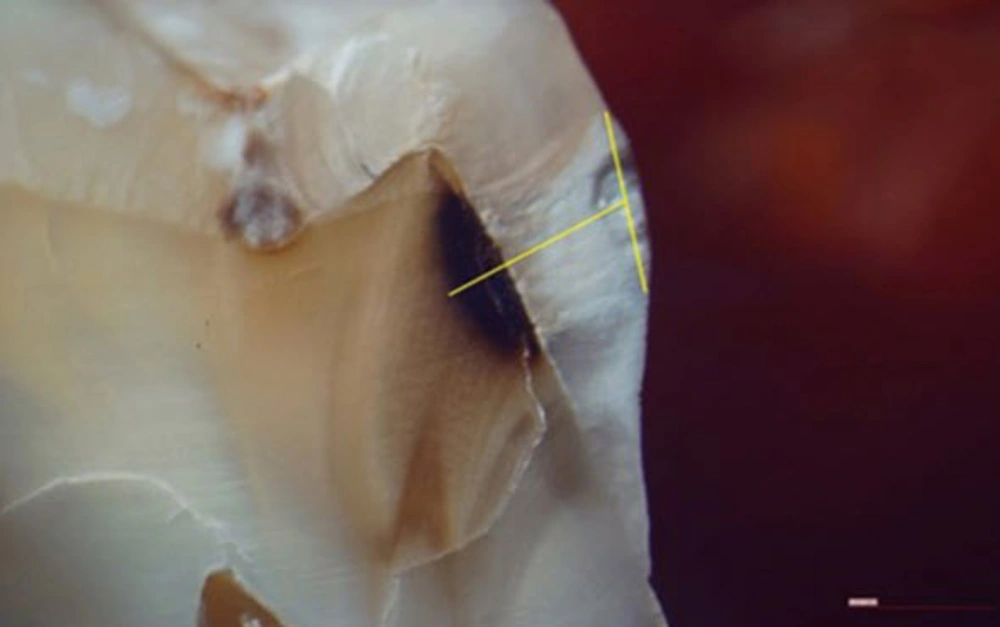
It has to be mentioned that this tooth group was completely different from the first group used for the design phase. The teeth had to be cut in order to determine the exact depth of carious lesions through histological analysis. Thus, the teeth were sectioned mesiodistally along with the central groove of their occlusal surface using a diamond disc (0.15 mm diameter). Intra-rater variability of the above-mentioned data was measured using a single-measure ICC. The results showed an excellent reliability (ICC [95% confidence interval (CI)]: 0.941 [0.913-0.961]). The sections were evaluated by a pathologist using a stereomicroscope (Olympus, SZX9, Japan) with 10× magnification. The criterion for caries diagnosis was the opaque-white to dark-brown discoloration in the caries’ susceptible area. Images were taken in JPEG format from the microscopic views and transferred to the Cygnus media 3-0 software for determining the exact depth of lesions. In this phase, the most coronal point of the external border of the lesion was connected to the most apical point of the external border. Then, the distance of the deepest point of the lesion from the midpoint of the drawn line was measured and defined as the depth of carious lesion in this study (13) (
Figure 6). IBM SPSS Statistics 19 for Windows (IBM Corp., Armonk, NY) was used for statistical analysis.
Schematic diagram of the software
Separation of teeth in the primary image. A, The primary image. B, Elimination of the alveolar bone. C, Separation of teeth.
The image of a tooth and its four segments after applying FCM algorithm. A, Background area of the image. B, Tooth enamel. C, Dentin. D, Dental pulp.
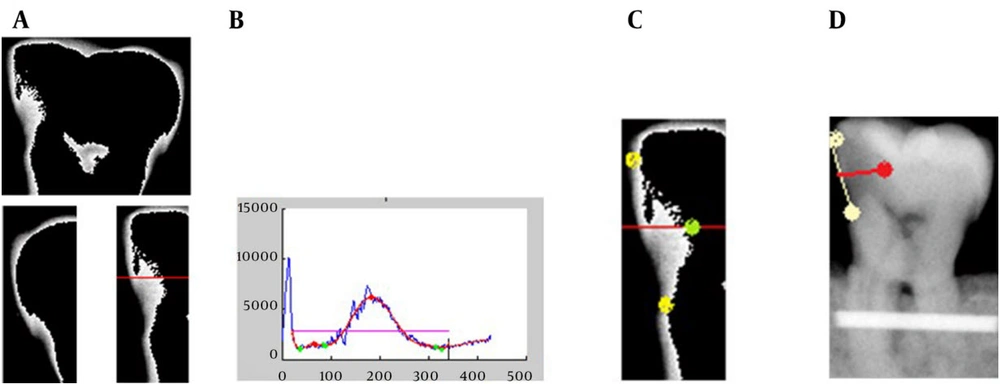
Detection of carious lesions and their depth. A, Upper image is a combination of the segments from the segmenting phase and lower images are mesial and distal borders of the tooth which have been extracted from the upper image by the software. As it can be seen in the image, the distal border has a wide notch, which indicates caries. The increased thickness observed in the mesial border is due to entering the cervical zone, but it does not violate the caries detection aim. B, The curve of tooth border extracted using an edge detection algorithm. The curve has been drawn horizontally for easier interpretation. The deepest point of carious lesion is shown on the curve as the local maximum point which is detected by the software using the gradient method. C, Initial and final points and the deepest point of the carious lesion detected from the curve in part B and shown on the real border of the tooth. D, Measuring the depth of carious lesion assuming a smooth border line for the normal tooth.
Measuring the depth of carious lesion in the histological specimen.
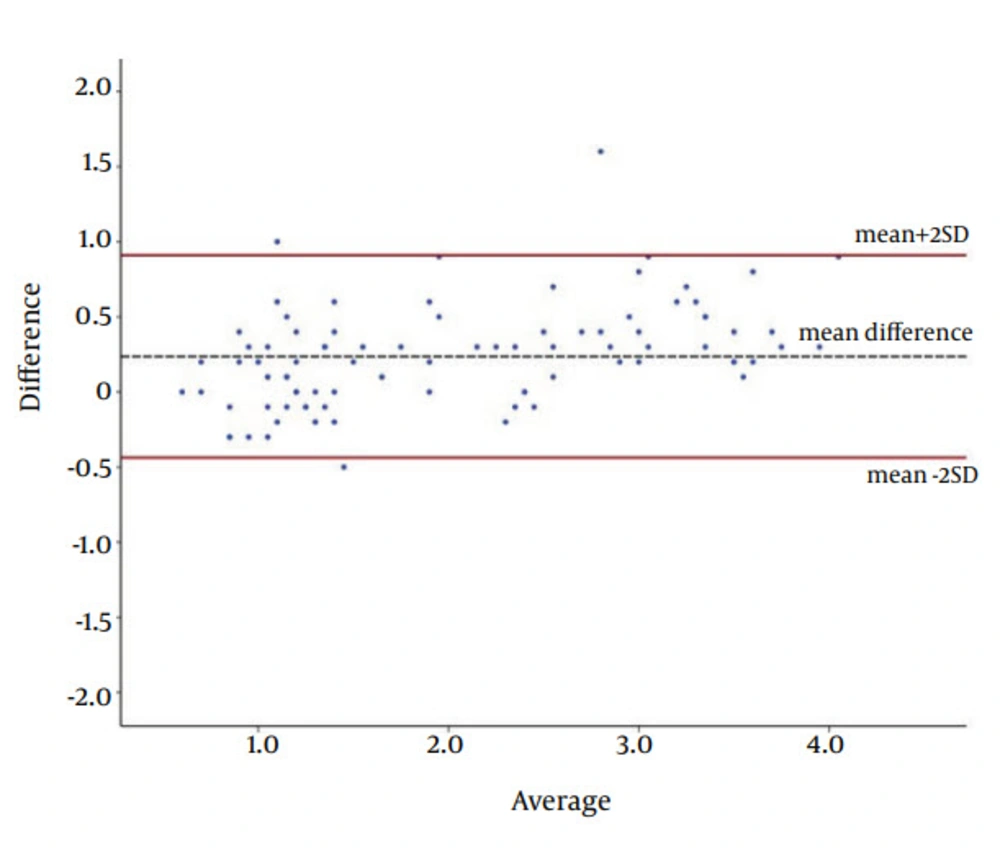
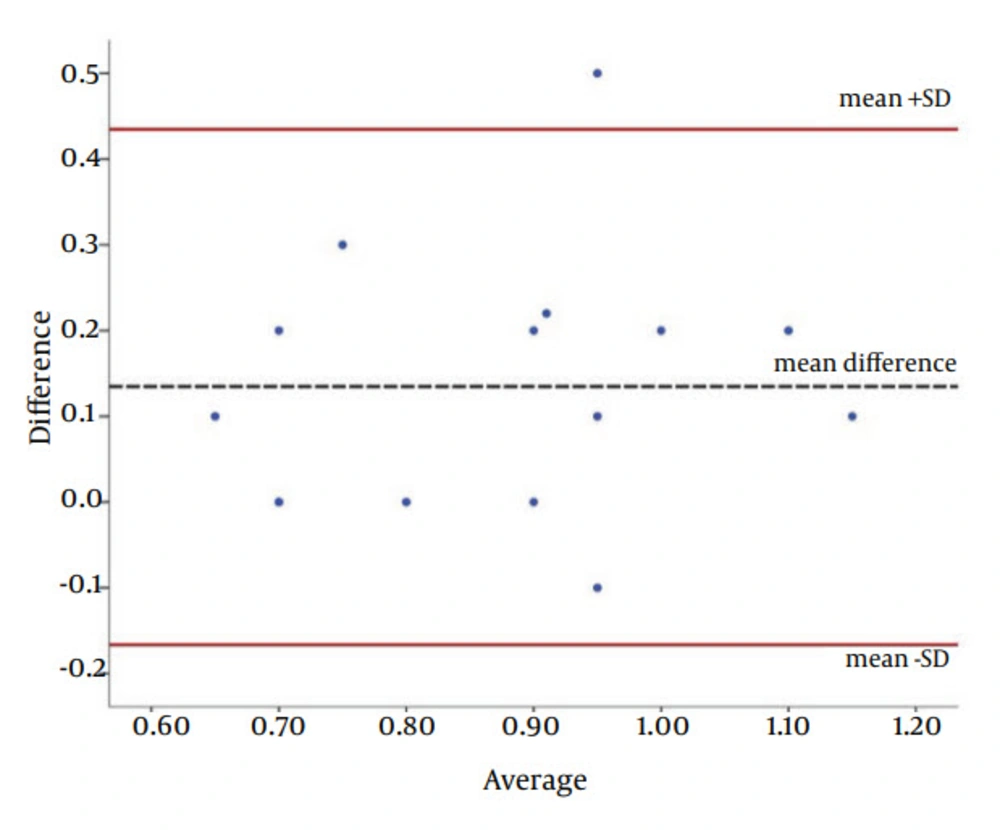
Eventually, intraclass correlation coefficient (ICC) and Bland-Altman plot were used to show the agreement between the software and histopathological analysis (as the gold standard).