


1. Background
2. Objectives
3. Materials and Methods
3.1. Cadaver Experiment
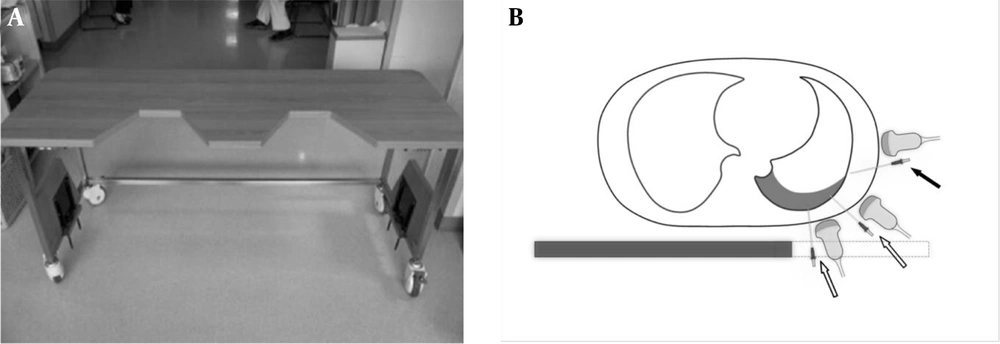
A, A table with gaps at one side of the tabletop was constructed for the cadaver experiment. With the lateral margin of the table carved out, the posterior thorax was exposed for the ultrasound probe and tapping needle to approach it from below. B, Drawing of axial cross section in a typical supine patient with a small-to-moderate effusion. Compared to the conventional method of lateral approach (solid arrow), the effusion can be much more easily visualized and tapped from the posterior and posterolateral aspects of the hemithorax (open arrows) via the carved out (dashed line) portion of the novel supine thoracentesis tabulation.
3.2. CT Review
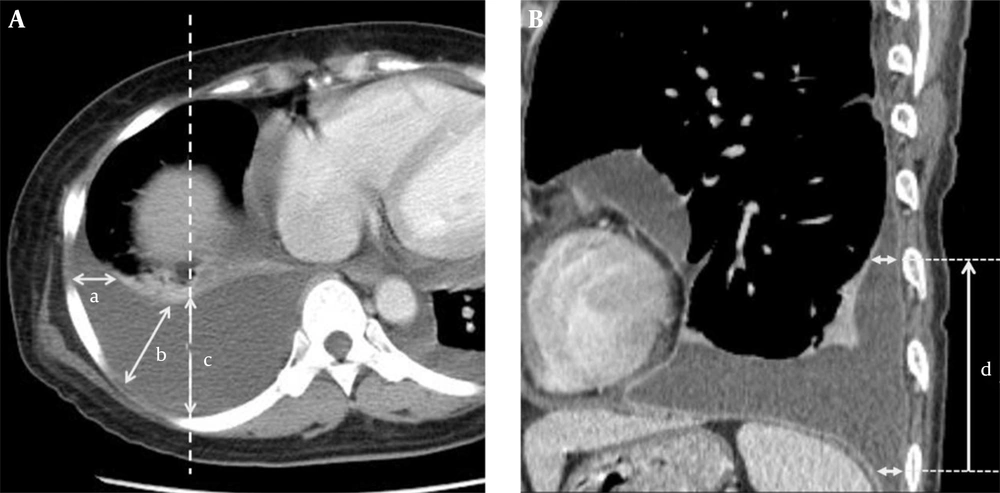
A, The depths of pleural effusion (DPEs) in the lateral (mid-axillary, a), posterolateral (posterior axillary, b) and posterior (posteroanterior direction to the mid-clavicular line (dashed line, c) tapping routes. The maximal DPEs along the routes a, b, and c may or may not be seen on the same axial plane. B, Nearby the costophrenic sulcus, craniocaudal distance of pleural effusion (d) has been measured (DPE > 1 cm).
![For the estimation of pleural fluid volume, we summed up the slab volumes [pleural fluid area (manually measured at each axial section scan) × 5 mm (scan interval of axial CT)].](https://brieflands.com/journals/ijradiology/articles/18038/figures/iranjradiol-inpress-20919-g003-preview.webp "For the estimation of pleural fluid volume, we summed up the slab volumes [pleural fluid area (manually measured at each axial section scan) × 5 mm (scan interval of axial CT)].")
For the estimation of pleural fluid volume, we summed up the slab volumes [pleural fluid area (manually measured at each axial section scan) × 5 mm (scan interval of axial CT)].
4. Results
4.1. Cadaver Experiment
| Amount of Administered Water, mL | Cadaver 1, cm | Cadaver 2, cm | ||
|---|---|---|---|---|
| Posterolateral Approach | Lateral Approach | Posterolateral Approach | Lateral Approach | |
| 100 | 0.38 | 0 | 0 | 0 |
| 200 | 0.17 | 0 | 0 | 0 |
| 300 | 0.55 | 0 | 0.54 | 0 |
| 400 | 0.93 | 0 | 0.64 | 0 |
| 500 | 1.14 | 0 | 0.61 | 0 |
| 600 | 1.35 | 0 | 0.71 | 0 |
| 700 | 1.55 | 0 | 0.99 | 0 |
| 800 | 2.87 | 0.2 | 1.12 | 0 |
| 900 | 3.04 | 0.2 | 1.31 | 0 |
| 1000 | 3.44 | 0.22 | 1.34 | 0.1 |
| 1100 | 5.58 | 1.31 | 1.63 | 0.22 |
| 1200 | NA | NA | 1.91 | 0.38 |
| 1300 | NA | NA | 2.29 | 0.57 |
| 1400 | NA | NA | 2.2 | 0.7 |
| 1500 | NA | NA | 2.3 | 0.83 |
| 1600 | NA | NA | 2.3 | 0.96 |
| 1700 | NA | NA | 2.51 | 1.18 |
| P value | 0.002 | 0.002 | < 0.001 | < 0.001 |
Abbreviation: NA, not available
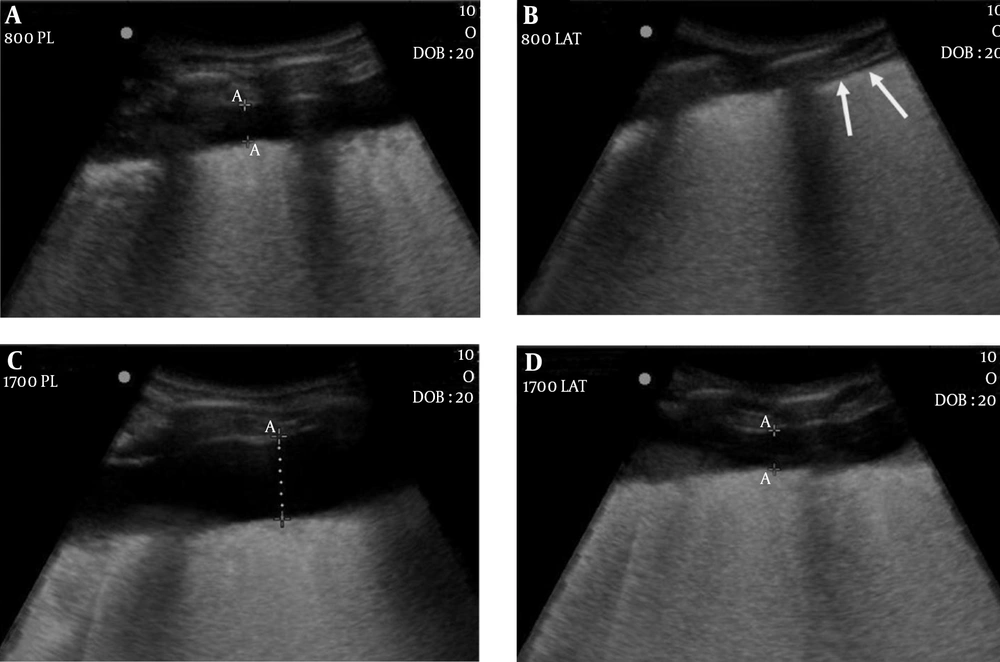
Cadaver 2. A, Ultrasonography after administration of 800 mL of water shows the depth of pleural effusion (DPE) exceeding 1 cm (1.12 cm) in the posterolateral approach; B, However, there is no fluid gap in the lateral approach (arrows); D, After administration of 1700 mL of water, DPE is slightly greater than 1 cm (1.18 cm); C, While that in the posterolateral approach is much greater than 1 cm (2.51 cm).
4.2. CT Evaluation
| Characteristic | Value |
|---|---|
| No. of patients | 25 |
| Age, y | |
| Mean (SD) | 65.6 (11.8) |
| Range | 18 - 73 |
| Male-to-female ratio | 15:10 |
| Amount of pleural effusion, mL | 667.9 (145.7 - 2019.8) |
| Cause of pleural effusion (no. of patients) | |
| Pulmonary edema | 9 |
| Parapneumonic effusion | 2 |
| Empyema (nontuberculous) | 3 |
| Tuberculous pleurisy | 4 |
| Malignant effusion | 5 |
| Hemothorax | 1 |
| Uremic pleuritis | 1 |
| Distribution of pleural effusion (no. of patients) | |
| Right pleural effusion | 16 |
| Left pleural effusion | 2 |
| Bilateral pleural effusion | 7 |
| Lateral Approach, L | Posterolateral Approach, PL | Posterior Approach, P | P Valueb | P Valuec | |||
|---|---|---|---|---|---|---|---|
| L vs. PL | L vs. P | PL vs. P | |||||
| Depth of pleural effusion (DPE)d,e | 1.44 (1.69) (0.974) | 3.69 (1.77) (0.972) | 4.45 (1.84) (0.986) | < 0.001 | < 0.001 | < 0.001 | < 0.001 |
| Craniocaudal distance (CCD) of pleural effusiond,e | 4.11 (5.51) (0.990) | 11.50 (5.40) (0.984) | 18.31 (6.12) (0.990) | < 0.001 | < 0.001 | < 0.001 | < 0.001 |
| Presence of passive atelectasisf | 28.1 | 81.3 | 90.6 | NA | < 0.001 | < 0.001 | 0.250 |
Abbreviation: NA, not available
aNumbers in second parentheses are intraclass correlation coefficient values.
bP values were obtained with repeated measures ANOVA test.
cPairwise comparison followed by the repeated measures ANOVA test for DPE and CCD. For comparison of the frequency of atelectasis, McNemar test was used.
dValues are expressed as mean (SD).
eValues’ unit is cm.
fValues’ unit is %.
| Estimated Pleural Fluid, mL | No. of Effusions | Lateral, La | Posterolateral, PLa | Posterior, Pa | |||
|---|---|---|---|---|---|---|---|
| CCD | DPE | CCD | DPE | CCD | DPE | ||
| ≤ 200 | 3 | 0 | 0 | 0 | 0.96 (0.04) | 5.7 (2.8) | 1.81 (0.16) |
| > 200, ≤ 300 | 3 | 0 | 0 | 7.5 (4.6) | 1.82 (0.49) | 11.8 (2.8) | 2.63 (0.58) |
| > 300, ≤ 400 | 4 | 0.8 (1.5) | 0.33 (0.65) | 11.6 (3.2) | 2.38 (0.37) | 17.6 (1.1) | 3.21 (0.51) |
| > 400, ≤ 500 | 4 | 2.3 (3.3) | 0.96 (1.29) | 9.6 (4.3 | 3.18 (0.45) | 16.9 (1.9) | 3.55 (0.65) |
| > 500, ≤ 600 | 4 | 1.3 (2.5) | 0.79 (1.05) | 12.8 (2.5) | 3.28 (0.44) | 20.1 (5.2) | 3.76 (0.35) |
| > 600, ≤ 700 | 3 | 2.7 (3.1) | 1.68 (1.15) | 13.7 (1.0) | 4.88 (0.32) | 18.0 (0.9) | 5.63 (0.46) |
| > 700, ≤ 900 | 3 | 4.5 (3.9) | 1.26 (1.24) | 14.5 (6.1) | 4.73 (0.54) | 22.0 (2.5) | 5.47 (0.33) |
| > 900, ≤ 1100 | 3 | 8.5 (5.3) | 3.04 (2.17) | 16.0 (2.6) | 6.07 (1.94) | 24.2 (4.0) | 6.90 (1.25) |
| > 1100 | 5 | 13.5 (4.4) | 3.96 (0.97) | 15.5 (2.0) | 5.47 (1.12) | 24.5 (2.5) | 6.61 (1.32) |
aValues’ unit is cm.
Abbreviations: CCD, craniocaudal distance of pleural effusion; DPE, depth of pleural effusion.
| Estimated Pleural Fluid, mL | No. of Effusions | Lateral | Posterolateral | Posterior | ||||||
|---|---|---|---|---|---|---|---|---|---|---|
| CCD | DPE | Both | CCD | DPE | Both | CCD | DPE | Both | ||
| ≤ 200 | 3 | 0 | 0 | 0 | 0 | 0 | 0 | 2 | 3 | 2 |
| > 200, ≤ 300 | 3 | 0 | 0 | 0 | 2 | 2 | 2 | 3 | 3 | 3 |
| > 300, ≤ 400 | 4 | 0 | 1 | 0 | 4 | 4 | 4 | 4 | 4 | 4 |
| > 400, ≤ 500 | 4 | 1 | 2 | 1 | 4 | 4 | 4 | 4 | 4 | 4 |
| > 500, ≤ 600 | 4 | 1 | 1 | 1 | 4 | 4 | 4 | 4 | 4 | 4 |
| > 600, ≤ 700 | 3 | 1 | 2 | 1 | 3 | 3 | 3 | 3 | 3 | 3 |
| > 700, ≤ 900 | 3 | 2 | 2 | 2 | 3 | 3 | 3 | 3 | 3 | 3 |
| > 900, ≤ 1100 | 3 | 2 | 3 | 2 | 3 | 3 | 3 | 3 | 3 | 3 |
| > 1100 | 5 | 5 | 5 | 5 | 5 | 5 | 5 | 5 | 5 | 5 |
aBoth, No. of effusions with craniocaudal distance > 5 cm and maximal depth > 1 cm at the same time; CCD, No. of effusions with craniocaudal distance > 5 cm; DPE, No. of effusions with maximal depth > 1 cm.
