


1. Introduction
2. Case Presentation
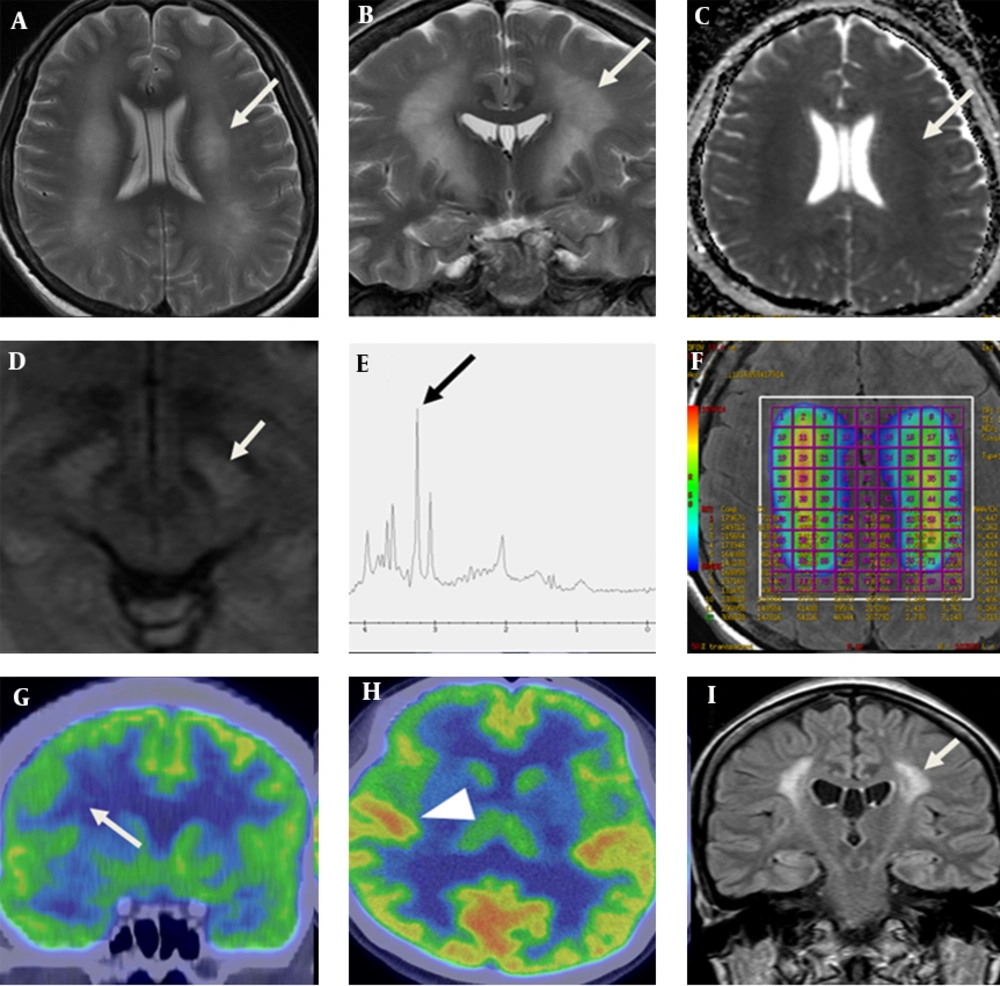
A 36-year-old woman with neuropsychiatric SLE. Axial (A) and coronal (B) T2 weighted magnetic resonance imaging show diffuse and symmetric hyperintense areas of the bilateral cerebral white matter including the corticobulbar tract (white arrow), which shows slight diffusion restriction on ADC map (C). At the level of midbrain, high signal intensities (arrow) are detected in the medial side of crus cerebri on diffusion-weighted image (D). MR spectroscopy (E) shows increased choline (arrow) and myo-inositol peaks and decreased NAA peak. Color coding map of multi-voxel MRS (F) shows increased ratio of choline/creatinine. Coronal (G) and axial view (H) of PET CT shows decreased FDG uptake on the middle and inferior frontal gyri (arrow) sparing other cortex (arrow head). Post treatment follow up FLAIR image of MRI (I) shows decreased area of high signal intensity (arrow) of the white matter compared with initial presentation after nine months.
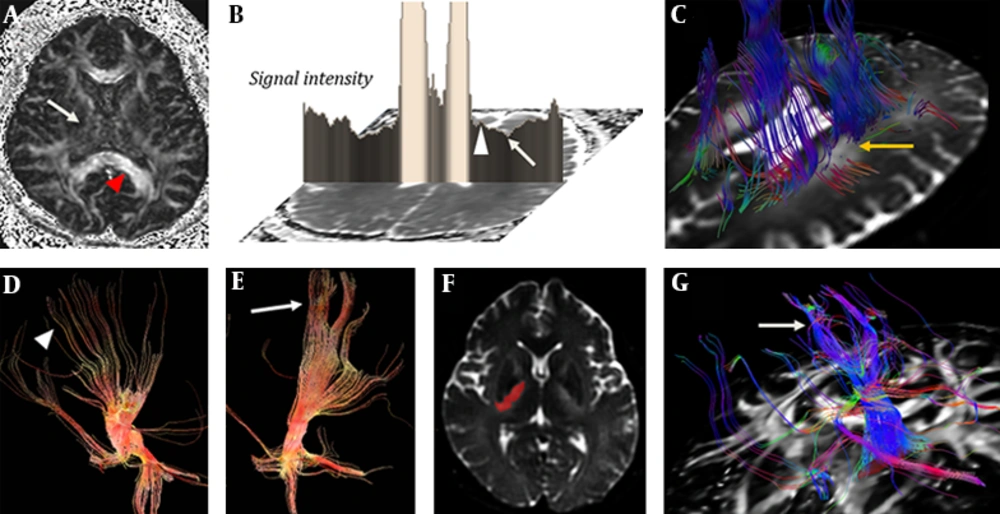
FA map in a patient with neuropsychiatric SLE (A) shows decreased value of internal capsule (arrow) compared with the corpus callosum (arrowhead). ADC map (B) shows diffusion restriction in the lateral portion of the periventricular white matter (arrow) with relatively spared medial portion (arrowhead) at the level of corona radiata. DTI tractography (C) shows fibers defect (arrow) on T2 high signal intensity. The fibers passing the medial three-fourth portion of crus cerebri (D, arrowhead) are more sparse than fibers passing through the lateral portion of crus cerebri (E, arrow). Diffusion tensor tractography shows the corticobulbar tract (G, arrow) which passes through a high signal intensity lesion (signal intensity<1450) on b=0 image of DWI (F, mask imaging).
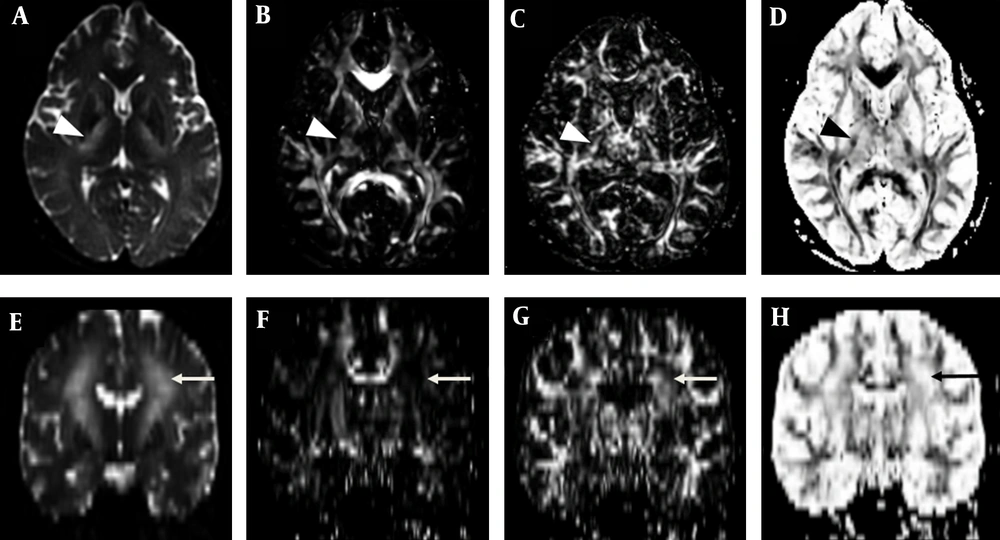
Parametric anisotropy maps in a patient with neuropsychiatric systemic lupus erythematosus (SLE). A-D, Axial images of B0 diffusion tensor image, parametric intensity maps of combination linear (Cl), combination planar (Cp), and combination spherical (Cs) measures at the level of basal ganglia. E-H, Coronal images of B0 diffusion tensor image, Cl, Cp, and Cs. Affected lesion including corticobulbar tract (arrow) shows low, high and high signal intensity on Cl, Cp and Cs map, respectively; whereas, the corticospinal tracts (arrow head) show high, high, and low signal intensity, respectively, which was similar to unaffected white matter tracts.
