


1. Background
2. Objectives
3. Materials and Methods
3.1. Animals and Cell Preparation
3.2. Labeling MSCs with SPIO
3.3. Cavernosal Nerve Injury and MSC Injection
3.4. In vivo MR imaging
3.5. Fibrosis Analysis with Reverse Transcriptase Polymerase Chain Reaction (RT-PCR)
3.6. Histological Analysis
4. Results
4.1. Intracellular Labeling of MSCs with SPIO
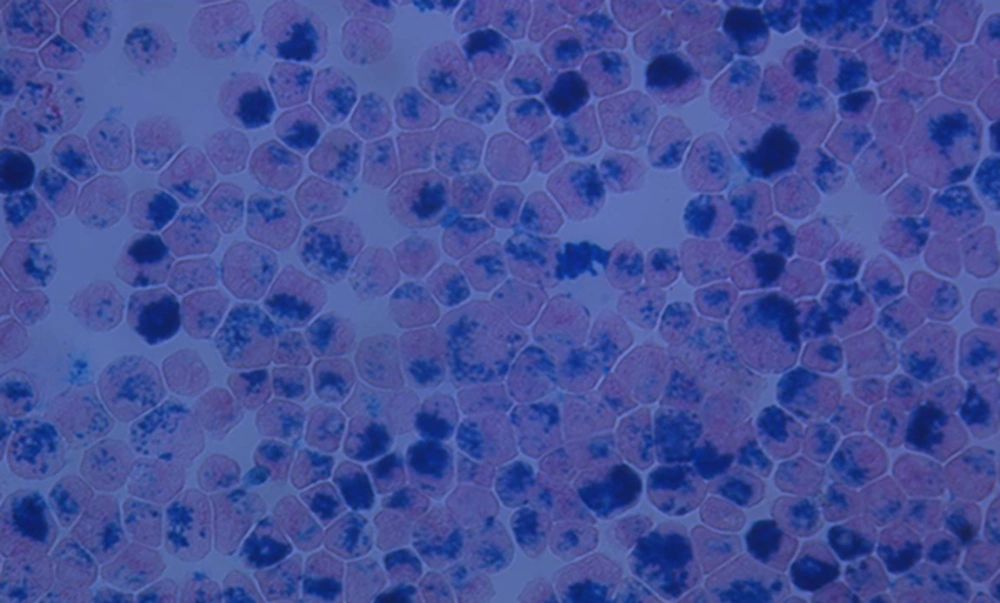
Prussian blue-stained Feridex-labeled mesenchymal stem cells. Mesenchymal stem cells were labeled with superparamagnetic iron oxide (SPIO) nanoparticles for intracellular magnetic labeling and the efficacy of the labeling was examined under a microscope after Prussian blue staining (× 1000).
4.2. In vivo MR Tracking of MSCs
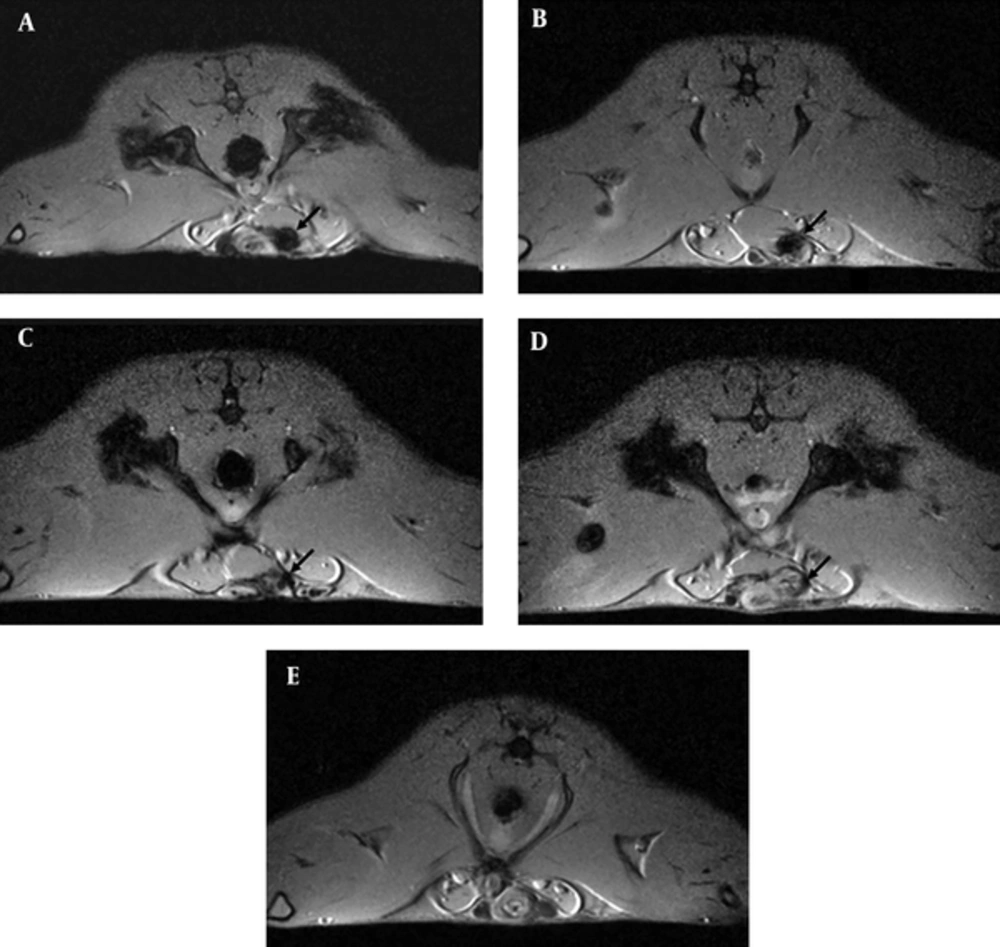
In vivo magnetic resonance (MR) imaging with superparamagnetic iron oxide (SPIO)-labeled mesenchymal stem cells after transection of bilateral cavernosal nerves. A - E, Short axis T1-weighted gradient-echo MR imaging of rats showed the distinct hypointensity (indicated by arrows) at the penis 4 weeks (A) after injection. The size of hypointensity became smaller gradually in rats after 8 (B), 12 (C), and 16 (D) weeks of injection. Conversely, no signal change was detected in a media-injected control rat (E).
4.3. Histological Analysis
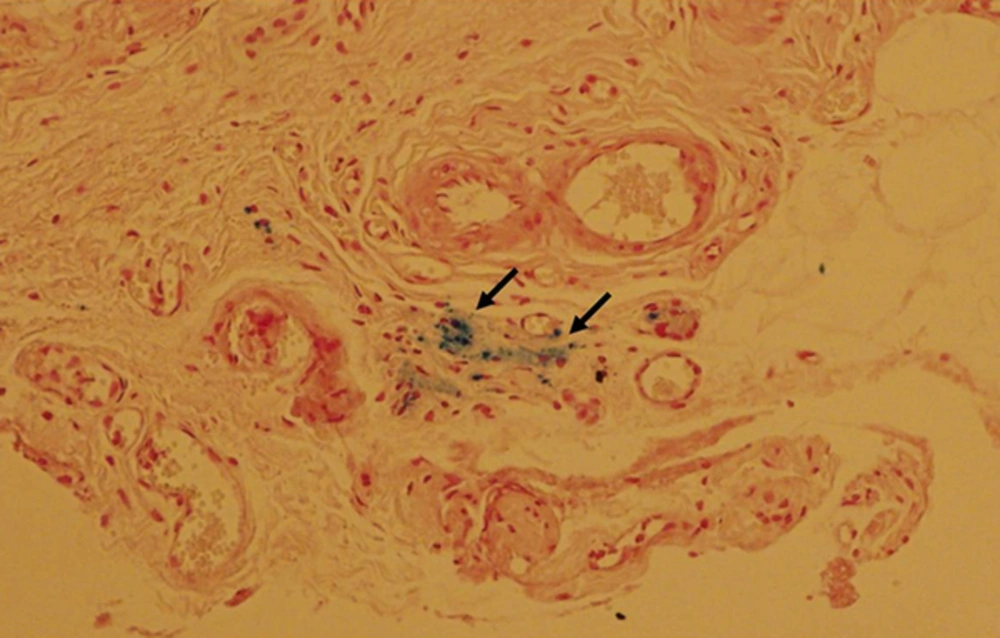
Histological analysis of superparamagnetic iron oxide (SPIO)-labeled mesenchymal stem cells with Prussian blue staining. Rats at 8 weeks after injection of SPIO-labeled mesenchymal stem cells into the corpus cavernosum were sacrificed and the tissue was stained with Prussia blue staining. Hypointensities detected by MR imaging were visible as blue stained area (indicated by arrows) by histological examination with Prussian blue staining, indicating the presence of the intra-cytoplasmic SPIO particles in the hypointensity.
4.4. RT-PCR Analysis for the mRNA Expression of TGF-β1
| 4 w | 8 w | 16 w | |
|---|---|---|---|
| Control groups | 0.617 | 0.432 | 0.512 |
| 0.614 | 0.456 | 0.39 | |
| 0.566 | 0.352 | 0.408 | |
| 0.591 | 0.347 | 0.359 | |
| 0.535 | 0.309 | 0.316 | |
| 0.55 | 0.366 | 0.266 | |
| Ave. ± Std. Dev. | 0.579 ± 0.0339 | 0.377 ± 0.0557 | 0.375 ± 0.0845 |
| MSC injected groups | 0.556 | 0.487 | 0.636 |
| 0.521 | 0.539 | 0.522 | |
| 0.471 | 0.487 | 0.575 | |
| 0.542 | 0.373 | 0.504 | |
| 0.397 | 0.334 | 0.329 | |
| 0.484 | 0.35 | 0.275 | |
| Ave. ± Std. Dev. | 0.495 ± 0.0582 | 0.428 ± 0.0863 | 0.474 ± 0.0142 |
Abbreviations: MSC, mesenchymal stem cell; RT-PCR, reverse transcription-polymerase chain reaction; TGF-β1, transforming growth factor-β1; W, week.
aAll data indicated the ratio of TGF- β1 and β-actin (TGF- β1 / β-actin) and Ave. and Std. Dev. indicated the average value and standard deviation, respectively.
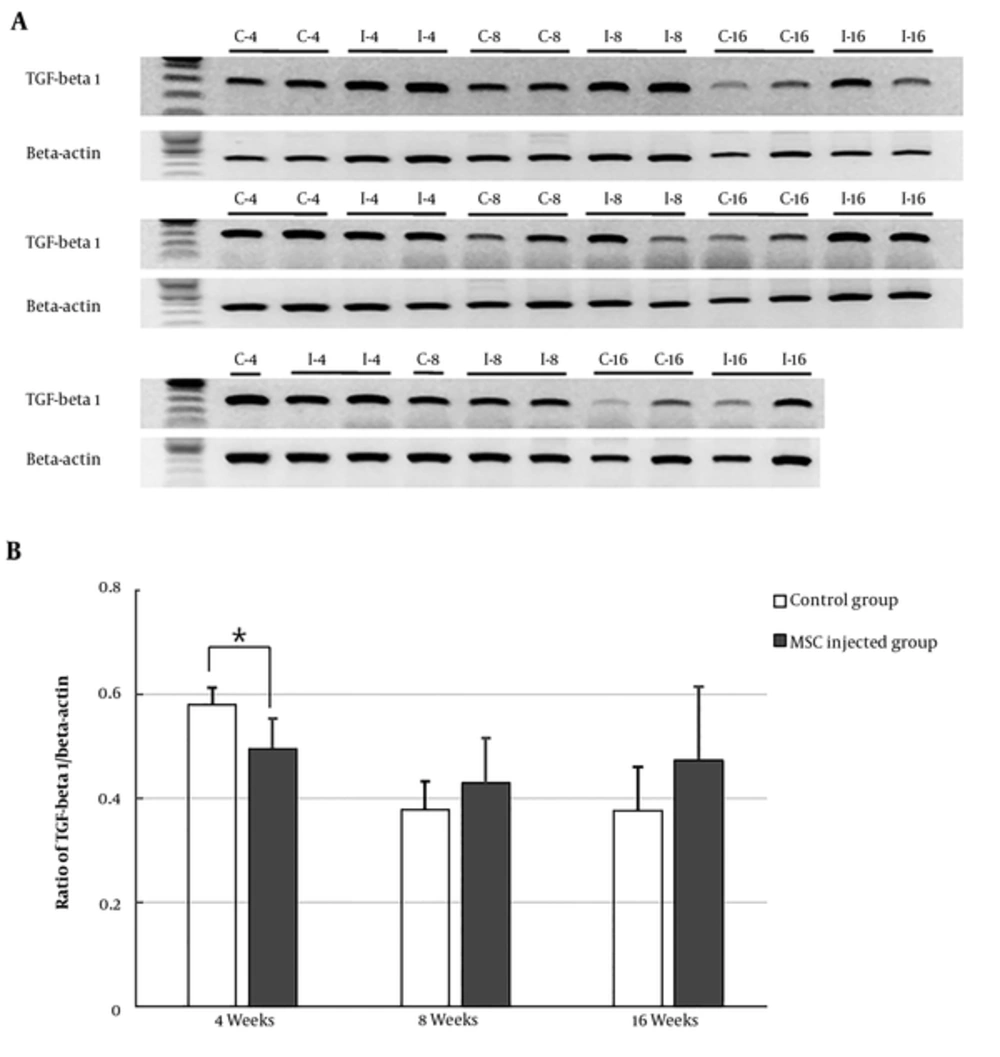
Reverse transcription-polymerase chain reaction (RT-PCR) analysis of transforming growth factor- β1 (TGF-β1) mRNA expression. A, Penile tissues from rats treated with the stem cells for 4, 8, or 16 weeks were collected and the expression of TGF-β1 was analyzed by RT-PCR. (I; stem cell injected groups and C; control groups). B, Graphs showing changes in the ratio of TGF-β1/ β-actin in the tissues. All data represent means ± standard error from six rats from each group as a function of time. *, P < 0.01, different from the control group in one-way ANOVA analysis. A two-way ANOVA between time and treatment indicated P < 0.05.


