Of a total 3762 F-18 FDG PET/CT scans conducted for oncologic indications at Masih Daneshvari Hospital between May 2013 and January 2016, 62 (1.6%) scans were retrospectively identified to depict metabolically active brown adipose tissue (1.6%, mean age 29.21 (± 14.18; age range: 6 - 66 years). BAT detection rate was significantly more prevalent in female (42/62, 68% per BAT-bearing patients, 42/1847, 2.27% per total female population) than male (20/62, 32% per BAT-bearing patients, 20/1915, 1.04% per total male population, (P value = 0.007).
Table 2 outlines the cohorts’ demographic and anthropometric parameters. Except for pediatrics (< 18 years old), female predominance in BAT visualization was noted in all age groups. There was a trend toward a gender preference in male to depict active BAT in patients < 18 years old; however, it was not statistically meaningful (boys: 7/62 (11.29%), girls: 4/62, (6.45%), P = 0.08).
| Variables | Value | P value |
|---|
| Gender | | |
| Male | 20 (32.3) | |
| Female | 42 (67.7) | |
| Age, y | 29.21 ± 14.18, 6 - 66 | 0.002 |
| Male | 21.8 ± 7.95, 6 - 65 | |
| Female | 32.82 ± 14.52, 14 - 66 | |
| Weight, kg | 64.17 ± 17.36, 18 - 94 | 0.7 |
| Male | 65 ± 18.8, 18 - 94 | |
| Female | 63.76 ± 14.16, 35 - 94 | |
| Height, cm | 164.6 ± 12.44, 85 - 190 | 0.4 |
| Male | 166.78 ± 17.66, 85 - 190 | |
| Female | 163.53 ± 7.15, 142 - 188 | |
| Body mass index | 23.6 ± 5.27, 15.54 - 33.98 | 0.2 |
| Male | 22.65 ± 5.18, 15.54 - 31.62 | |
| Female | 24.05 ± 5.3, 16.67 - 33.98 | |
| Lean body mass | 46.32 ± 10.81, 4.93 - 68.82 | 0.019 |
| Male | 51.25 ± 11.56, 14.04 - 68.82 | |
| Female | 43.92 ± 6.61, 4.93 - 60.21 | |
| Body fat, % | 17.15 ± 9.48, 2.89 - 39.59 | 0.025 |
| Male | 13.89 ± 7.45, 2.89 - 35.4 | |
| Female | 18.74 ± 7.23, 4.63 - 39.59 | |
Abbreviation: y; year
aValues are expressed as No. (%) or mean ± SD, min - max.
Eighty-three point six percent of the patients were < 40 years old. Mean age in patients with activated BAT showed a statistically significant difference between male and female (21.8 (± 7.95) vs. 32.82 (± 14.52), P value = 0.002). None of the BAT-bearing patients >40 years old were male. Ten women > 40 years old (23.8%) expressed active BAT.
Seventy-one point four percent and 88.7% of the patients with active BAT had BMI less than 25 (low BMI: 30.4%, normal BMI: 41.1%) and BF below the obesity cutoff, respectively. The frequency of BAT-bearing patients with normal/low BMI (BMI ≤ 25) (n = 46, 74.19%) was significantly more than those with overweight/obese BMI (BMI > 25) (n = 16, 25.8%) (P value = 0.002). The same results were obtained for BF-based categorical weight (non-overweight patients: n = 59, 95.16%, overweight/obese patients: n = 3, 4.83%, P < 0.001). In addition, there was a significant difference in body fat and lean body mass between male and female groups (P value = 0.027 and P value = 0.002, respectively). However, it was not demonstrated for weight, height and BMI. Notably, gender preference in female was demonstrated in all BMI groups as well as in patients with good/acceptable BF categories. However, in BF-based overweight/obese patients, BAT visualization occurred equally between male and female with the mean age of 25 and 27.75, respectively.
The seasonal and monthly patterns of BAT expression in F-18 FDG PET/CT scan were demonstrated as the following: autumn (47.5%, October: 17.7%, November: 16.1%), winter (21.3%, February: 12.9%, January: 8.1%), summer (17.7%, September: 8.1%, August: 4.8%) and spring (12.9%, April: 8.1%, June: 3.2%) with a statistically significant higher rate of BAT detection in autumn.
In the context of cancer-related characteristics (
Table 3), the most frequent brown fat-associated cancers in the current study were lymphoma (Hodgkin’s disease and Non Hodgkin’s lymphoma: 27/62, 43.5%), genitourinary (11/62, 17.7%), and breast cancers (7/62, 11.3%). Most of the patients with active brown adipose tissue were referred for evaluation of response to treatment (30/55; 54.54%), 27 of which demonstrated complete or partial response to treatment (43.54%) followed by metastatic assessment (12/55; 21.81%). In other words, 54.54% of the patients underwent PET/CT investigation in a 1-4-month period after the end of therapy (status post treatment). Thirty five out of 62 patients had at least one metabolically active cancer-related lesion (56.45%).
| Type of cancer | Per BAT patients | Per total patients | Reason for referral | | Disease status | | Recent history of treatment | | Evidence of disease | |
|---|
| Lymphoma | 27 (43.6) | 896(3) | Treatment response evaluation | 30 (54.54) | Complete metabolic response | 14 (22.58) | Positive | 27 (43.54) | Positive | 35 (56.45) |
| Genitourinary | 11 (17.7) | 427 (2.5) | Metastatic assessment | 12 (21.81) | Partial metabolic response | 13 (20.9) | Negative | 25 (40.32) | Negative | 27 (43.54) |
| Breast | 7 (11.3) | 468 (1.49) | Restaging | 6 (10.9) | Advanced disease | 4 (6.45) | NOS | 10 (16.12) | | |
| Bone | 3 (4.8) | | Staging | 5 (9.09) | Progressive disease | 4 (6.45) | | | | |
| Head and neck | 3 (4.8) | | Recurrence | 2 (3.63) | Positive for recurrence/ metastasis | 12 (19.35) | | | | |
| Adrenal | 2 (3.2) | | NOS | 7 | Negative for recurrence metastasis | 7 (11.3) | | | | |
| Lung | 2 (3.2) | | | | No active lesion | 8 (12.9) | | | | |
| Colon/Esophagus | 2 (3.2) | | | | | | | | | |
| Melanoma | 1 (1.60) | | | | | | | | | |
Abbreviation: BAT, brown adipose tissue; NOS, not otherwise specified.
aValues are expressed as No. (%)
In the current study, the most dominant distribution pattern of hypermetabolic BAT was a diffuse activation pattern in multiple anatomical sites in the neck, the mediastinal and paravertebral regions (21/62, 33.87%s). The highest level of metabolic activity in BAT depots represented by average SUVmax were recorded in the region of axilla (6.9, range: 1.2 - 25.5) followed by the neck (6.5, range; 1.7 - 17.3), and abdomen (5.52, range: 3.9 - 9.8). The anatomic and metabolic data of F-18 FDG detectable BAT depots are summarized in
Table 4.
| Anatomical region | No. (%) | Average SUVmax (range) |
|---|
| Neck | 58 (93.54) | 6.5 (1.7 - 17.3) |
| Paravertebrae | 54 (87.09) | 4.74 (1.3 - 18.1) |
| Mediastinum | 38 (61.29) | 3.6 (1.4 - 10.7) |
| Axilla | 32 (51.61) | 6.91 (1.2 - 25.5) |
| Abdomen | 7 (11.29) | 5.52 (3.9 - 9.8) |
| Distribution pattern | | |
| Neck-mediastinum- paravertebrae | 21 (33.87) | |
| Neck-axillary-paravertebrae | 16 (25.8) | |
| Neck- paravertebrae- mediastinum- axilla | 11 (17.74) | |
| Neck- paravertebrae | 5 (8.06) | |
| Neck- paravertebrae- mediastinum- axilla-abdomen | 5 (8.06) | |
| Neck- mediastinum- axilla | 2 (3.22) | |
| Neck- axilla | 2 (3.22) | |
Abbreviation: SUVmax, maximum standardized uptake values.
There was no statistically significant difference in the distribution pattern of active BAT regarding type (P = 0.135) as well as primary site of primary cancer (P value = 0.3).
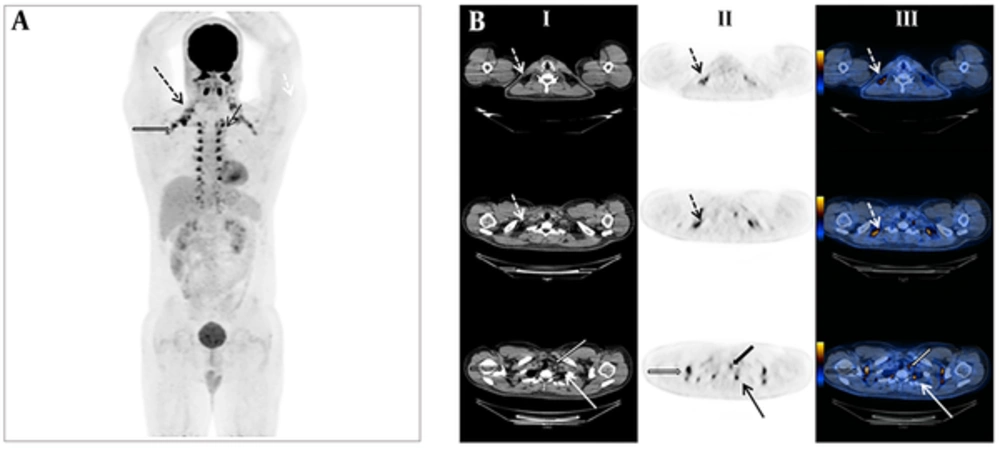
Figure 1 illustrates the most common cancer characteristics in the present report which demonstrated diffuse foci of BAT related F-18 FDG uptake in the neck, axillary, paravertebral and mediastinal region in a 46-year-old man with Hodgkin’s lymphoma who was referred for treatment response evaluation and proved to be in completed remission. The hottest spots are noted in axillary brown adipose tissue.
A, Anterior maximum intensity projection (MIP) demonstrated generalized 18-F fluorodeoxyglucose (FDG) uptake in brown adipose tissue located in the neck (dotted arrows), axillary (thick non-filled arrows), paravertebral (thin arrows) and mediastinal (thick filled arrows) regions in a 46-year-old man with Hodgkin’s lymphoma referred for treatment response evaluation. B, Axial non enhanced computed tomography (NECT) (column I), PET (column II) and fused positron emission tomography (PET)/CT (column III) images confirmed brown adipose tissue (BAT) related F-18 FDG uptake in the same patient with no evidence of metabolically active lymphadenopathy consistent with complete metabolic response to chemotherapy.
SUVmax demonstrated a weak inverse correlation with age (0.015, r = -0.32). The average SUVmax in patients < 40 years old was significantly higher than those who were older (8.24 vs. 4.33, U = 105, P value = 0.005). In addition, the average SUVmax was higher in patients with no evidence of active malignant lesion based on PET/CT images (8.98 vs. 5.81, P = 0.03) as well as those within the post-treatment period (9.5 vs. 5.1, P = 0.03). There was a significant correlation between the average SUVmax and the absence of active malignant lesion (0.03) as well as the recent history of treatment (0.011). In the patient group with a recent history of treatment, there was no significant difference in average SUV max between active (10/25, average SUVmax = 7.3) and non-active (15/25, average SUV max = 10.86) underlying malignancy (P value =0.14). However, in the absence of metabolically active cancer disease, the average SUVmax in patients with a recent history of treatment demonstrated to be significantly higher than in the patients who were referred for the indications other than evaluation of response to treatment (10.86 and 3.80, respectively, U = 14, P value = 0.040). A multiple regression test demonstrated age and recent history of treatment as independent predictors of the level of BAT metabolic activity, represented by SUVmax F (2.52) = 3.32, P = 0.044, R2 = 0.11, p value for age = 0.021, p value for recent treatment = 0.033. This test failed to reveal any significant correlation between average SUV max and gender, anthropometric characteristics, cancer type, reason for referrals, disease status and season based on univariate analysis. Comparison within each variable group including type of cancer, disease status and reason for referral revealed that though not statistically significant, the average SUVmax was higher in patients with primary diagnosis of Hodgkin’s disease (11.11 vs. 6.4), partial metabolic response (10.3 vs. 5.9) and treatment response evaluation (9.55 vs. 5.58), respectively.