


1. Introduction
2. Case Presentation
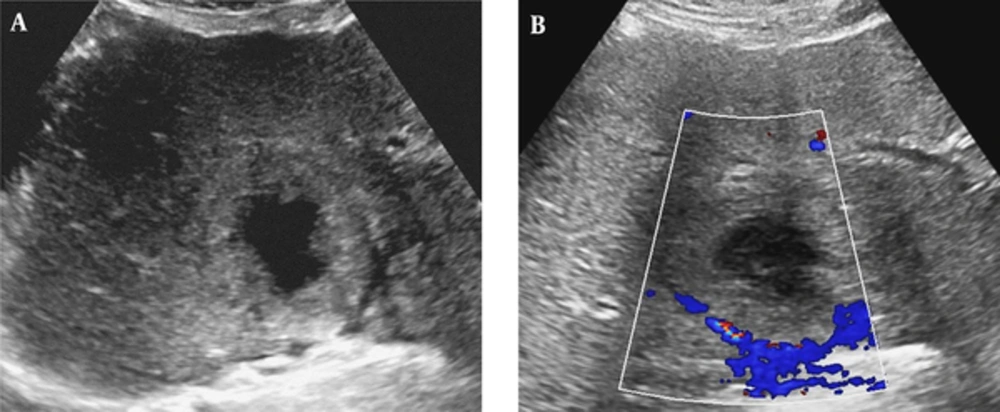
Ultrasonography (US) of a 57-year-old man with a 6.5 cm solitary peliosis hepatis undergoing a large central cystic change. A, Grayscale transabdominal US shows an ill-defined hyperechoic lesion in S4 of the liver. An irregular large anechoic cystic content is noted in the central portion of the lesion; B, Color Doppler US shows no increased vascularity of the lesion.
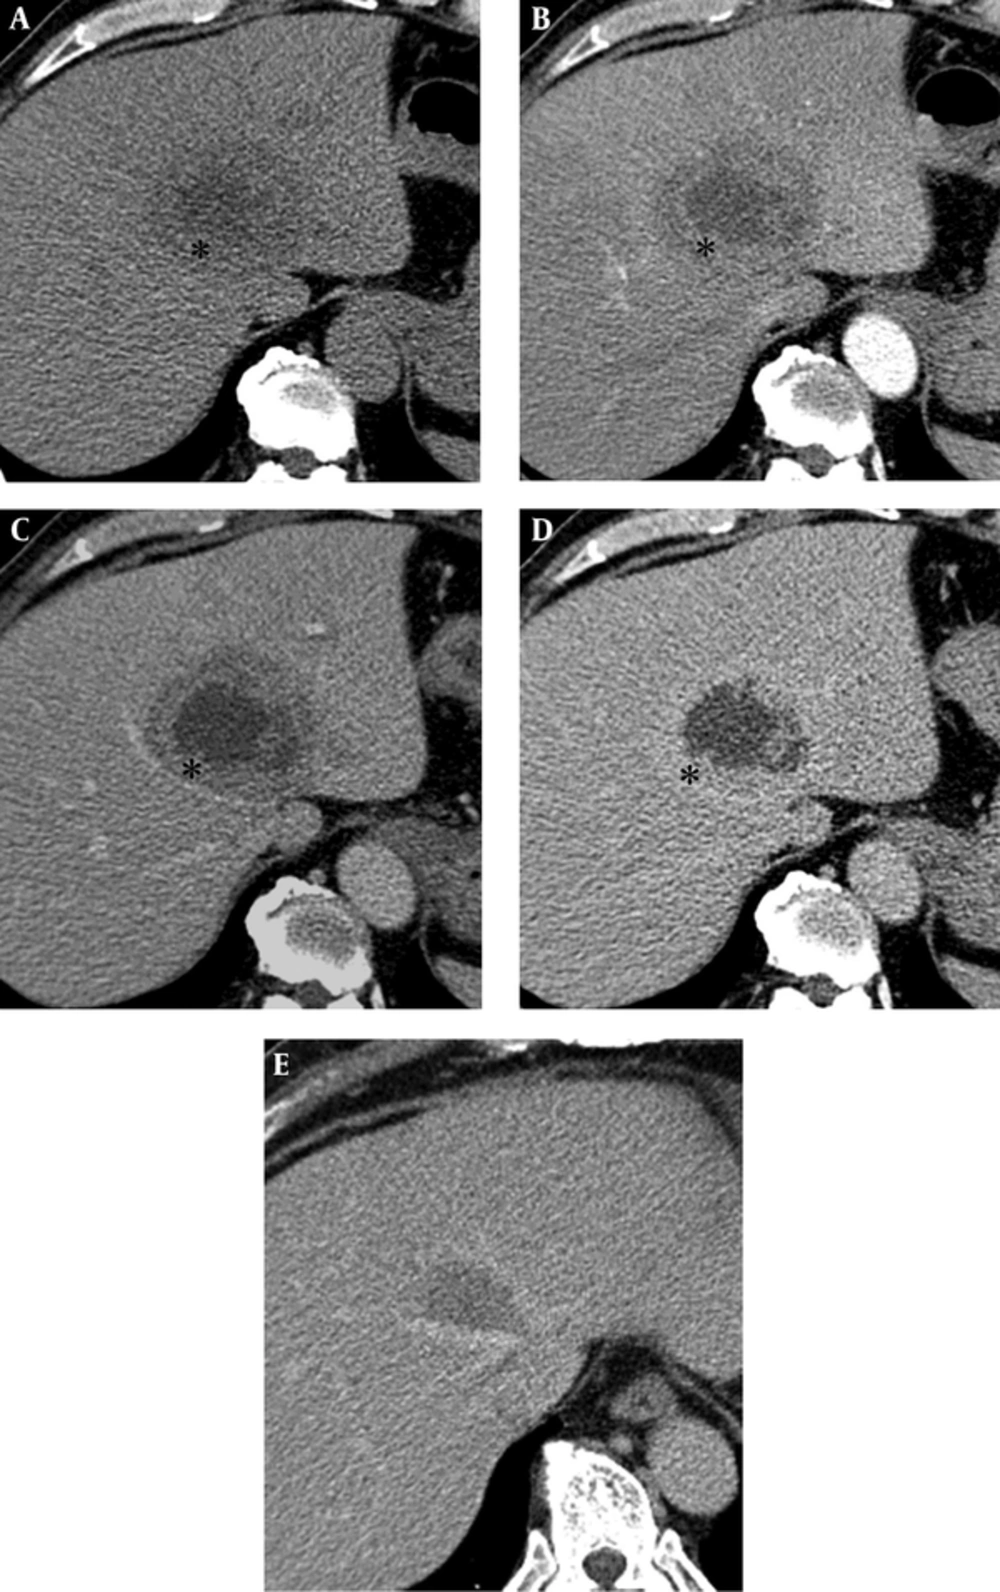
Multidetector computed tomography (CT) of a 57-year-old man with a 6.5 cm solitary peliosis hepatis undergoing a large central cystic change. A, A pre-contrast axial CT scan shows an ill-defined lesion with a triple layered appearance. The central portion is of low density, and the middle irregular thick layer (*) shows as isodense compared with the adjacent liver parenchyma, while the outer layer shows a hypodense rim similar to perilesional edema; B, C, After contrast medium enhancement, the middle irregular thick layer (*) shows strong enhancement from the arterial to delayed phase; D, A perilesional low density halo disappeared at the delayed phase. The central low density area does not show any enhancement; E, PH has been decreased in size from 6.5 cm to 3.5 cm 2 months after conservative treatment with antibiotics.
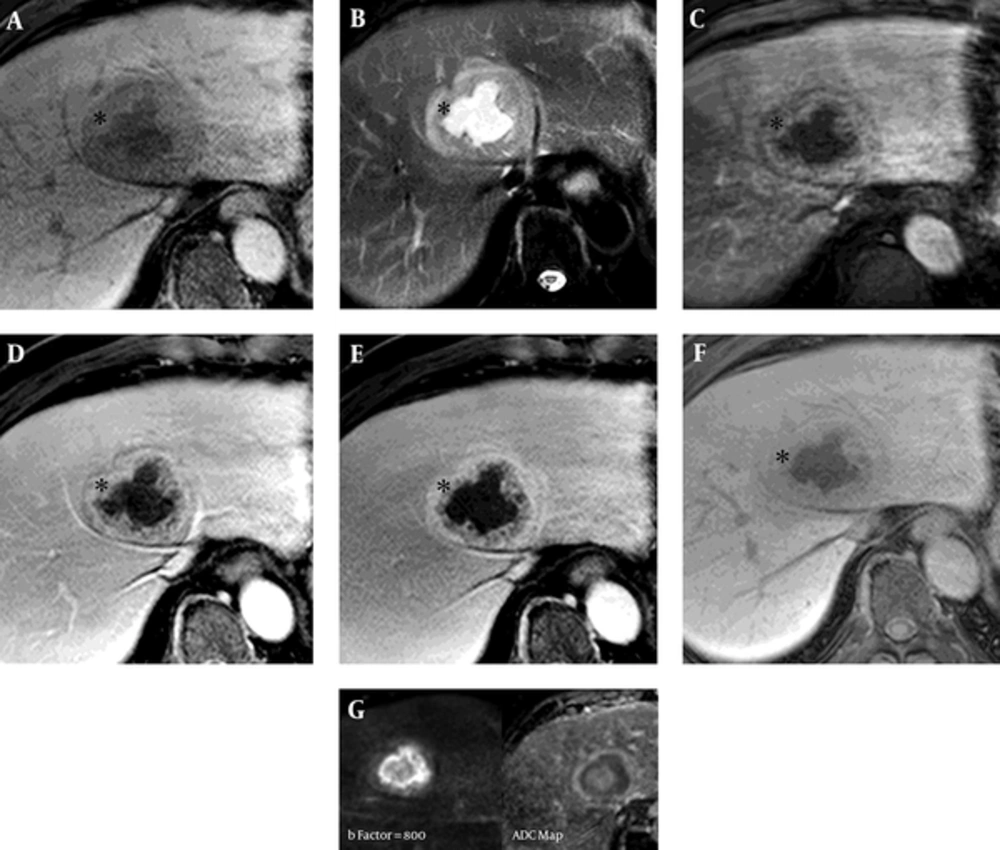
Liver magnetic resonance imaging (MRI) of a 57-year-old man with a 6.5 cm solitary peliosis hepatis undergoing a large central cystic change. A, Liver MRI was performed using dynamic imaging, including imaging in the arterial phase (C, 30 seconds), portal venous phase (D, 60 seconds), and transitional phase (E, 3 minutes), as well as the hepatobiliary phase (F, 20 minutes), after administration of 0.1 mmol/kg Gd-EOB-DTPA. The lesion is hypointense on pre-contrast T1-weighted imaging; B, On T2-weighted half-Fourier acquisition turbo spin-echo images, it shows a triple signal intensity. The central area shows as hyperintense, similar to cerebrospinal fluid, and the thick middle layer (*) shows iso- to slight hyperintensity compared with the adjacent liver parenchyma; C - E, The peripheral area shows as a hyperintense halo. In comparison with the CT scans, the thick middle layer (*) surrounding the central cystic lesion shows more intense enhancement compared with the adjacent liver parenchyma from the arterial to the transitional phase (3 minutes); F, On hepatobiliary phase, the thick middle layer (*) has been enhanced, but less strongly than the adjacent liver parenchyma; G, The enhancing peripheral lesion shows decreased diffusivity on diffusion weighted image (b factor, 800) and ADC map (ADC, 1.04 × 10⁻³mm2/s).
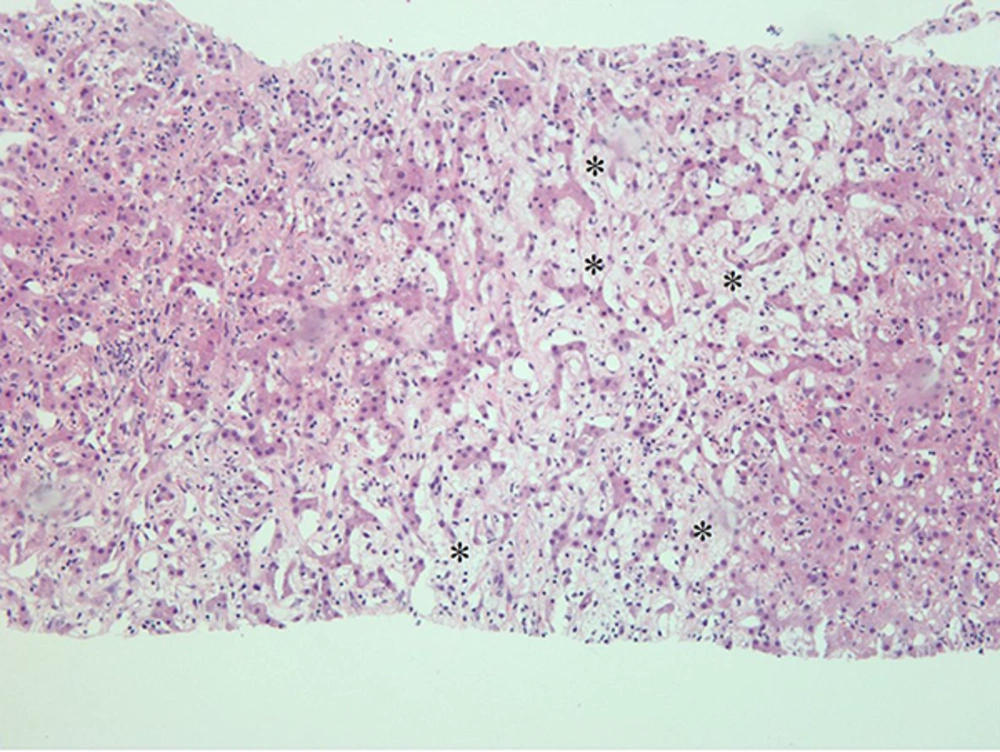
Photomicroscopic image shows dilatation of the sinusoid (*) (hematoxylin and eosin, × 100).
