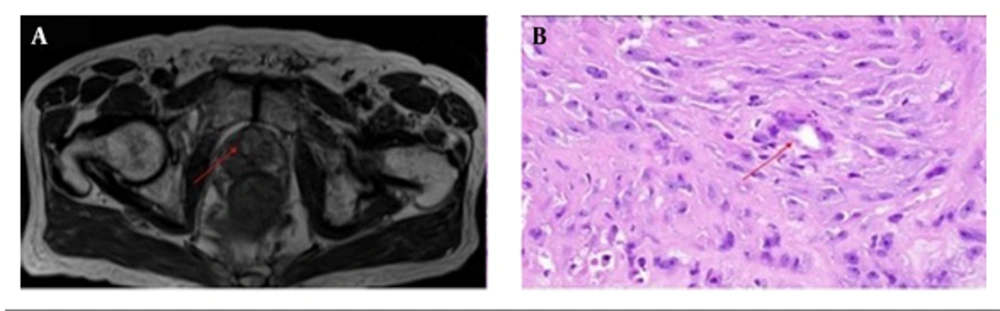
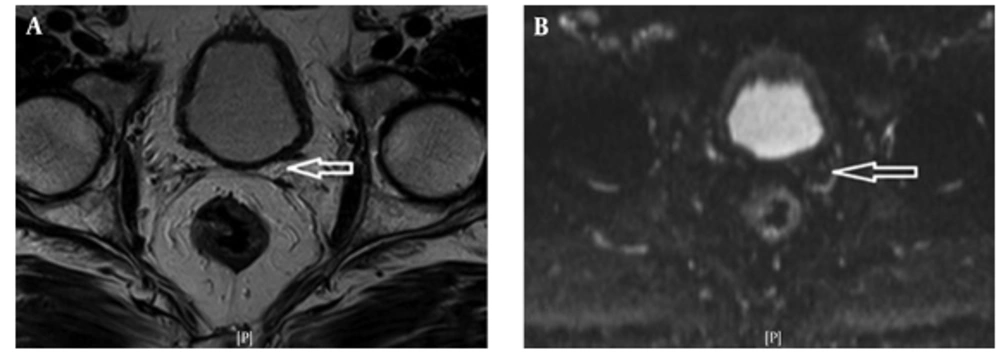
In this study, we evaluated the effectiveness of three image features in the differentiation of prostate cancer from normal tissue, and their correlation with lesion specific Gleason scores of images acquired from MP-MRI. Prostate cancer is often multifocal. It is generally accepted that the GS determines the prognosis, the lesion with the highest score has the poorest prognosis (
23). Correlation of imaging with histopathology is critical for validation and for establishing the utility of novel imaging biomarkers (
24). In particular, accurate correlation enables analyses of the relationships between various MRI-based quantitative parameters and histopathology, and allows for evaluation of the accuracy of imaging in the assessment of the tumor.
Anatomical and functional imaging of the prostate gland, and diagnosis of prostate cancer using MP-MRI is now becoming available in Iran. According to 2013 European association of urology guidelines (
25), the main tools to diagnose prostate cancer include DRE, PSA, and TRUS-guided biopsy.
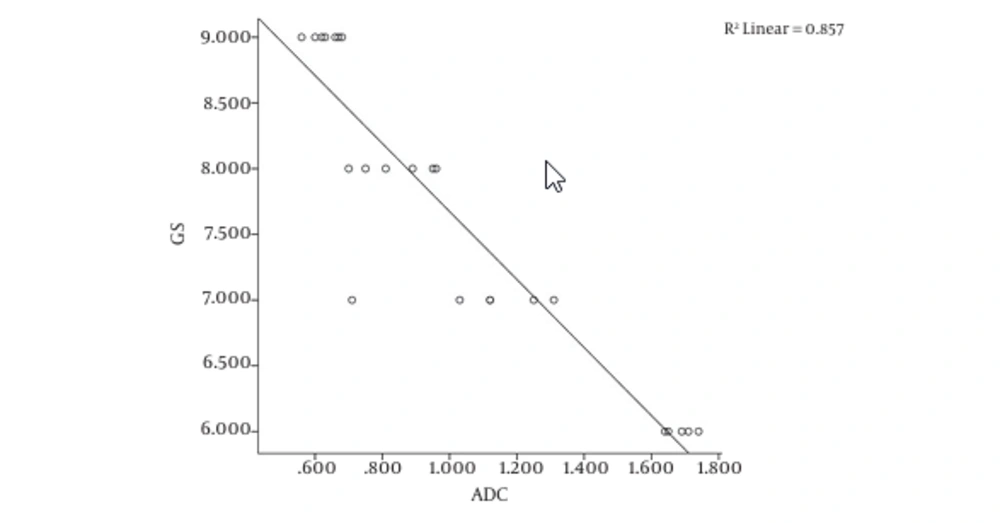
Several studies revealed a correlation between ADC value and Gleason score. Tamada et al. reported a correlation coefficient, r, between ADC and GS of -0.497 in peripheral zone (PZ) cancer and of -0.343 in transition zone (TZ) cancer (
26).
More recently, Tamada et al. found statistically significant differences between the ADC values of PZ tumors with Gleason scores of 6 and 7 and those with Gleason scores of 6 and 8 (
26). In another study that was performed on 44 patients with prostate cancer, significant differences in tumor ADC values were reported among patients with low-risk disease and those with higher-risk disease (
27).
The major limitations of previous studies were the unreliable GS obtained from needle biopsies and difficulties in accurate localization of the biopsied tumor on MRI. Needle biopsy leads to underestimation of GS in approximately 25% of the cases compared with GS established from prostatectomy specimen because of biopsy sampling error and tumor heterogeneity (
28,
29). To overcome this limitation, we used prostatectomy specimens for image and GS correlation. Our results showed that there is a significant negative correlation between ADC values calculated from DW images and GS of prostate cancer obtained from prostatectomy specimen. Oto et al. reported a moderate negative correlation (r = -0.376, P = 0.001) using this trend between ADC values and GS (
30).
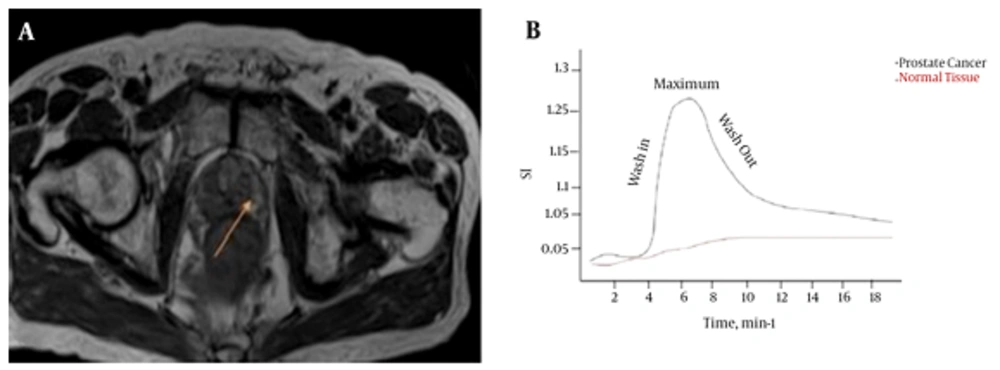
DCE-MRI is an imaging modality that is designed to evaluate the status of tumor angiogenesis. It has been suggested that in prostate cancer, a poorer prognosis is associated with a greater number of abnormal vessels (
31) and microvessel density has been shown to correlate with higher GS and predict disease progression (
32-
34).
This has prompted interest in quantitative DCE-MRI as a non-invasive tool in assessing the aggressiveness of prostate cancer. Accurate pharmacokinetic modeling of DCE-MRI requires knowledge of pre-contrast tissue T1 values (
35), and knowledge of the concentration time course of the contrast agent in the feeding vasculature. The pharmacokinetic model is applied to the time-dependent concentration changes of the contrast agent in the artery supplying the tissue of interest (
36).
Increased vascularity, capillary permeability, and interstitial hypertension in tumors are considered to underlie better tumor visualization (
37).
However, a recent report suggests that prostate cancer is not associated with increased vascularity (
38). K
trans was not highly effective in the differentiation of tumor from normal tissue in our study. This observation agrees with the literature (
39,
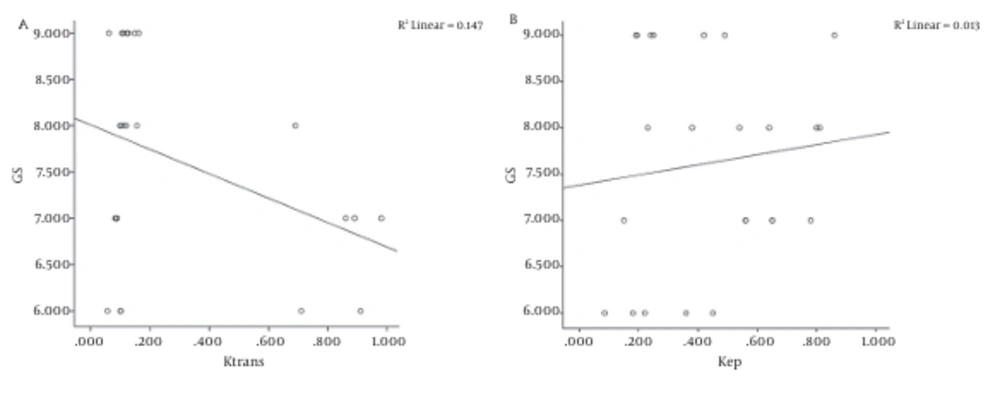
40). However, we found a moderate correlation between K
trans and GS, and K
trans was moderately effective in the differentiation of low and high-grade tumors. These findings are inconsistent with previous findings that showed no correlation between quantitative DCE MR parameters and GS (
30,
41).
However, DCEI may be confused with tissue inflammation because both are associated with increased vascularity. Peristalsis of the rectum during imaging may cause misregistration in imaging series, thereby disturbing analysis of the time-intensity curve.
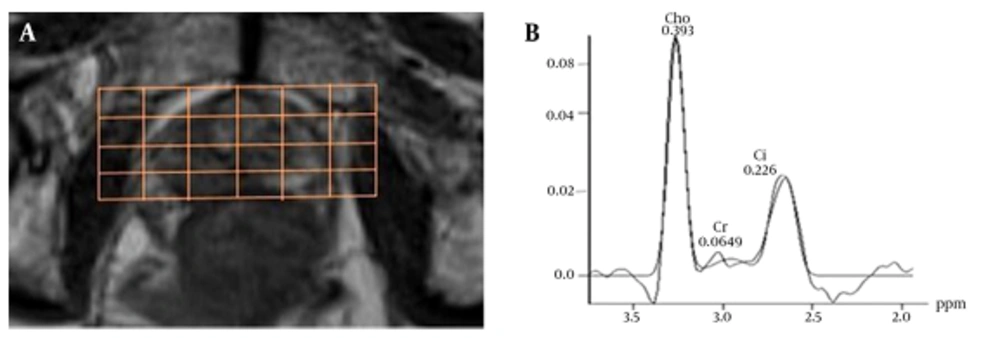
One of the most interesting characteristics of prostate cancer is its variable biologic aggressiveness. MRS uses metabolic information and makes biochemical quantitation at specific regions of the prostate possible in a non-invasive manner (
42). The ratio of the sum of the citrate and choline peaks to the citrate peak can differentiate prostate cancer from normal parenchyma (
43). MRI is the most accurate imaging investigation for evaluating soft tissue tumors (
44). Preliminary studies have shown that 1H-MRS using 1.5 or 3 T MR equipment is capable of discriminating between malignant and benign soft tissue tumors (
45,
46). According to a study conducted by Zakian et al. (
45), which measured the MR spectroscopic imaging, and the ratio of prostate tumor for (Cho + Cr)/Cit ratio, a positive correlation was found with the pathologic Gleason score. This data indicated that in the diagnosis, cancer with a GS of 6, the MR spectroscopic imaging tumor detection sensitivity was 44.4%, and the sensitivity increased to 89.5% in cancers with a GS of more than 8. Thus, a large proportion of tumors with a GS of 6 and under 6 did not generate abnormal voxel metabolite ratios (
47).
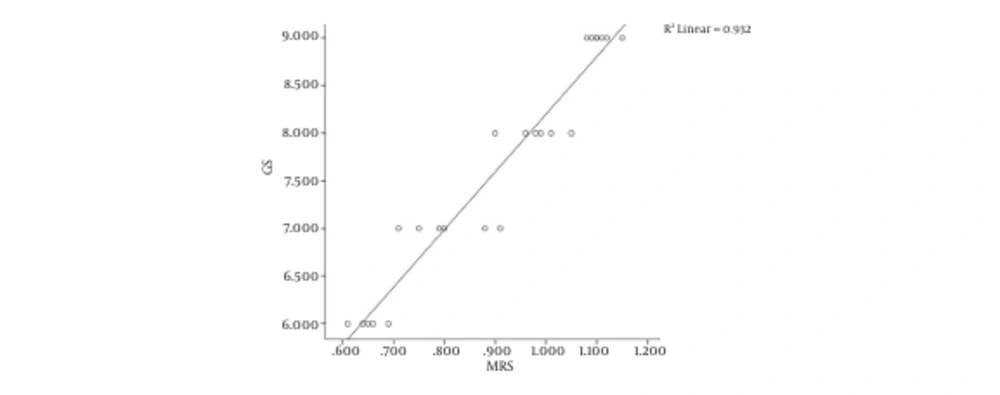
In our study, Spearman’s coefficient of rank correlation was 0.724 with P < 0.001, indicating a strong positive correlation between MRS results and histology (i.e. malignant or benign lesions).
Although DCE MRI and MRS alone had lower sensitivity than T2W MRI, they both had higher specificity than T2W MRI, and their addition to the MRI protocol increased the accuracy and predictive value of conventional T2W MRI for accurately localizing peripheral zone cancers. The incorporation of functional techniques, such as DCE MRI, MRS, and DWI, is a relatively new approach for tumor detection and local staging (
40).
MP-MRI, which is composed of T2W and several functional sequences, is regarded as the single most accurate imaging modality for characterizing prostate cancer. Recently, the role of an MP-MRI has been expanded to a prostate biopsy, active surveillance, advanced disease detection, and local recurrence detection after radical prostatectomy. For instance, MP-MRI was demonstrated to be an accurate method for localizing prostate compared to carefully perform WM step section histopathology, especially for lesions larger than 0.5 cm
3 (
1).
In this article we examined whether a detailed whole mount pathology correlation of the prostatectomy specimen is necessary for direct correlation with MP-MRI, or correlation with a standard pathology report is sufficient.
Our study has several limitations. The radiologists reviewing the MRI knew that all patients included in this study had biopsy proven cancer and this could lead to bias during interpretation of the MR images. In addition, the customized MRI based specimen is relatively expensive, so, we do not advocate it for routine clinical use. However, such a systematic method can be useful in multicenter clinical trials. Finally, we sliced the prostate in 5 mm sections, whereas the MRI was obtained in 3 mm slice thicknesses.
In conclusion, combining anatomical and functional MRI significantly improves prostate cancer localization. It is useful for diagnosis and management of prostate cancer as well as a valid tool for assessing men on active surveillance. However, it should not be seen as a replacement for tissue biopsy.