A 62-year-old man was admitted to our hospital in October 2016 for further evaluation of a hepatic mass that was incidentally detected at a local clinic. He had a history of alcohol consumption greater than 80 g/day for longer than 30 years. The patient was negative for hepatitis B surface antigen (HBsAg) and anti-hepatitis C virus (HCV) antibody. Abnormal laboratory results were as follows: aspartate aminotransferase (AST), 45 IU/mL (normal, ≤ 40); γ-glutamyltransferase (γ-GTP), 129 IU/mL (normal, 6 - 60 IU/mL); α-fetoprotein, 14.43 ng/mL (normal, < 8); and protein induced by vitamin K absence-II, 6,923 mAU/mL (normal, ≤ 40). Other laboratory studies were in the normal range: white blood cell count, 7,280/mm3; hemoglobin, 13.2 g/dL; hematocrit, 39.5%; platelet count, 211,000/mm3; alanine aminotransferase (ALT), 33 IU/mL; total protein, 7.7 g/dL; albumin, 4.6 g/dL; calcium, 9.5 mg/dL; phosphorus, 3.2 mg/dL; prothrombin time (PT), 10.3 seconds; international normalized ratio (INR), 0.95; and activated partial thromboplastin time (aPTT), 27.4 seconds.
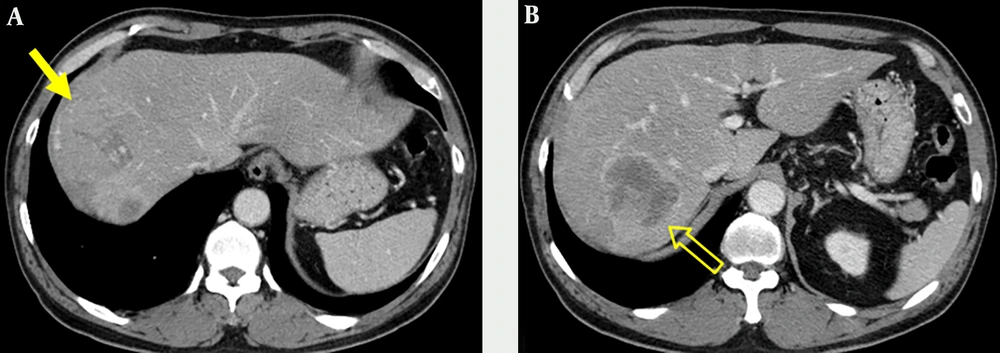
Portal venous phase images on abdominal CT obtained at an outside hospital showed two abutting hepatic masses in segments 8 and 7 (
Figure 1). The mass in segment 8 had a thin capsule and a size of 6.6 × 6.2 cm, while a 6.2 × 5.5 cm sized mass in segment 7 showed a thick enhancing rim.
A 62-year-old man with an incidentally detected hepatic mass. Contrast-enhanced portal venous phase CT images obtained at an outside hospital. Axial contrast-enhanced CT image shows a 6.6-cm isoattenuating mass (arrow) with capsular enhancement in segment 8 of the liver (A) and another 6.2-cm sized mass (open arrow) with irregular and thick enhancing rim in segment 7(B).
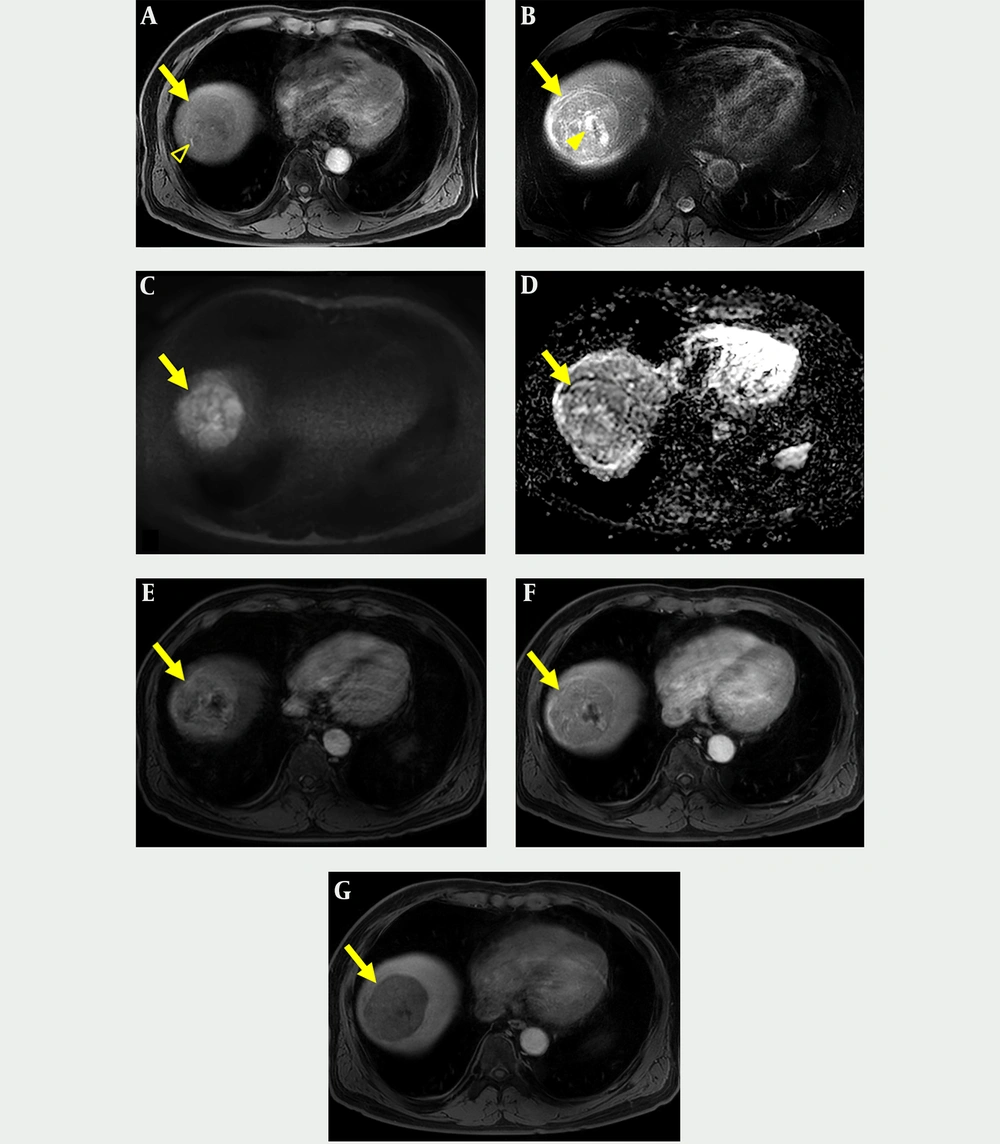
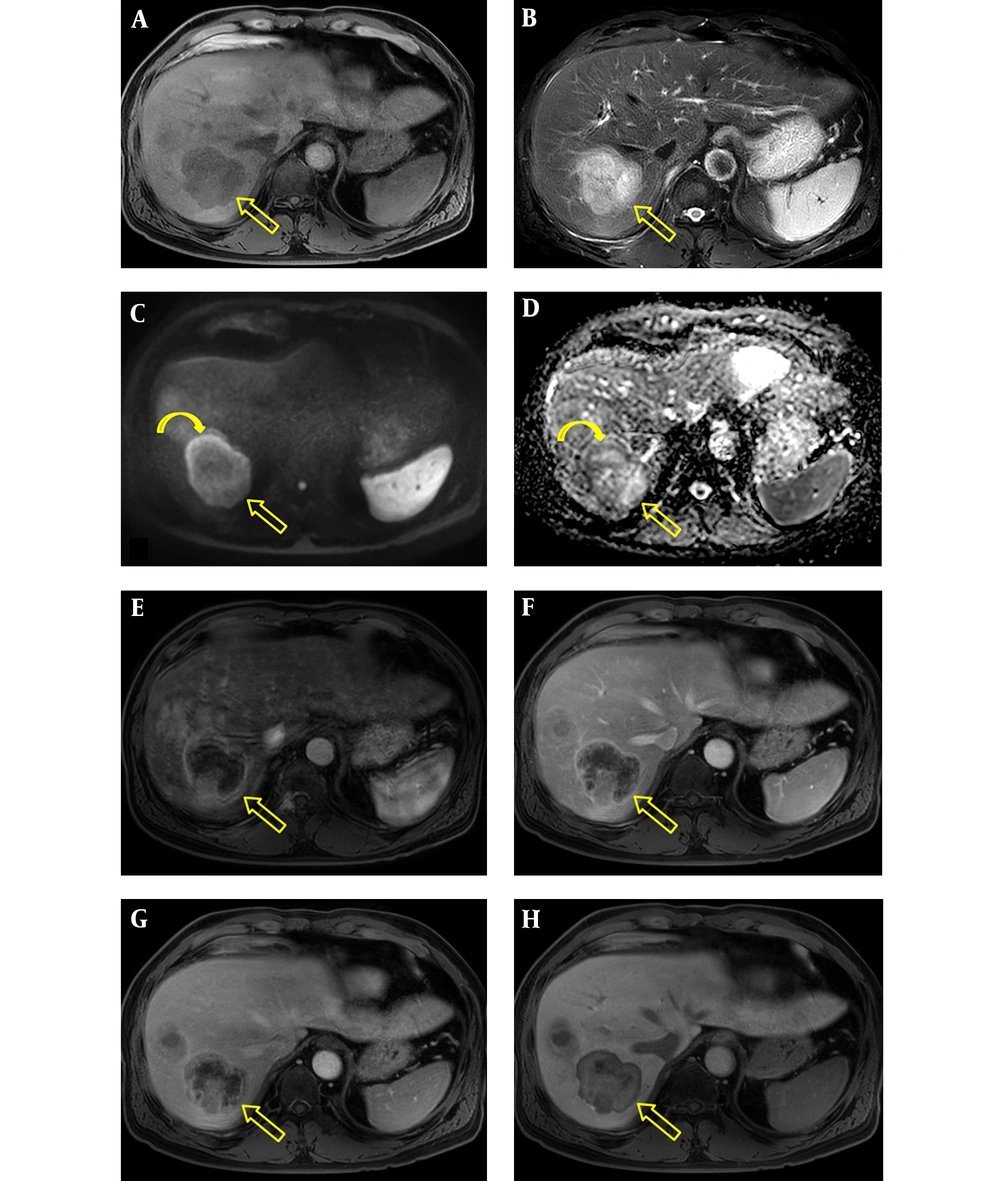
The patient underwent gadoxetic acid-enhanced and DW MR imaging for detailed evaluation of the hepatic masses. The masses were hypointense and hyperintense on fat suppressed T1- and T2-weighted images, respectively (
Figures 2A,
2B,
3A, and
3B). On DW image, the mass in segment 8 showed diffusion restriction as a whole, while the mass in segment 7 revealed diffusion restriction in the periphery (
Figures 2C,
2D,
3C, and
3D). In the dynamic contrast-enhanced images, the mass in segment 8 had proper radiologic findings for diagnosis of HCC, including arterial hyperenhancement with delayed washout and capsule, and showed hypointensity on hepatobiliary phase (HBP) image (
Figure 2E -
2G). In contrast, the mass in segment 7 showed hypervascularity of the periphery on arterial phase followed by centripetal enhancement, and a target appearance on HBP image (
Figure 3E -
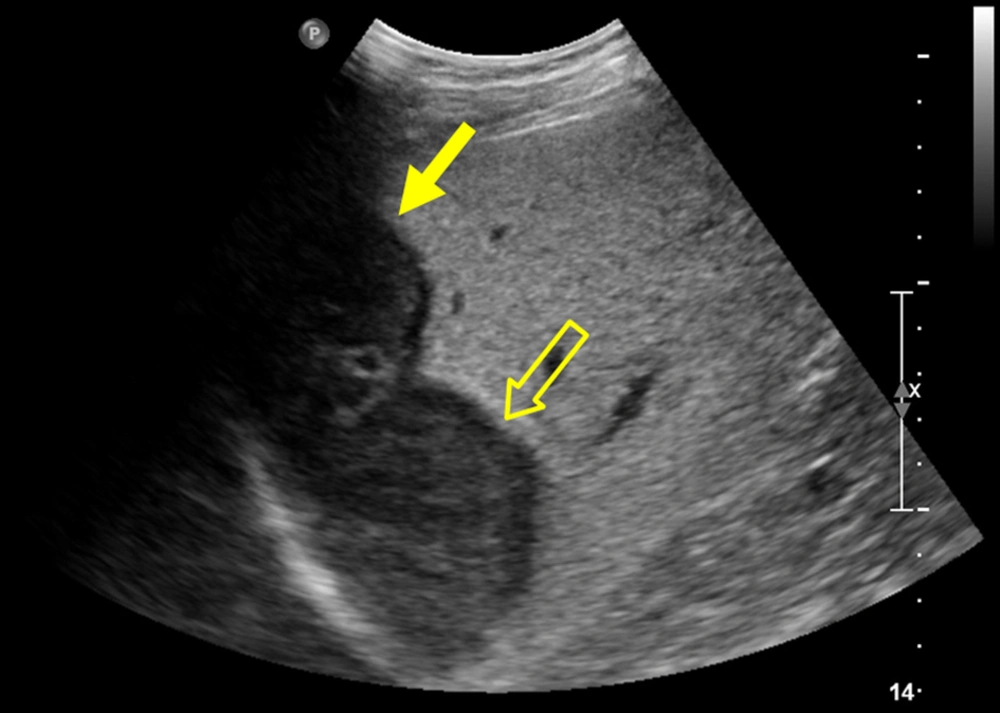
3H). We suspected that the tumor in segment 7 was an intrahepatic cholangiocarcinoma (IHCC) and ordered percutaneous liver biopsy. Ultrasonography (USG)-guided percutaneous liver biopsies were performed with two different devices to avoid pathologic contamination. The hepatic masses showed hypo-echogenicity on USG (
Figure 4). Histologic examination of the biopsy specimen documented that the mass in segment 8 was HCC (Edmonson-Steiner grade II) and the second mass in segment 7 was a poorly differentiated carcinoma. After 1 month, the patient underwent right hemihepatectomy under a diagnosis of synchronous HCC and IHCC.
Gadoxetic acid-enhanced and diffusion-weighted MR imaging of classic hepatocellular carcinoma (HCC). A, Axial T1-weighted image shows a hypointense mass (arrow) with well-demarcated margin in segment 8 that contains hyperintense foci indicating hemorrhage (open arrowhead); B, Axial T2-weighted image shows a hyperintense mass (arrow) with cystic or necrotic portion (arrowhead); C and D, Axial diffusion weighted image (b = 800 s/mm2) and apparent diffusion coefficient map show the mass (arrow) with diffusion restriction. E and F, Axial contrast-enhanced arterial and portal venous phase images show arterial hyperenhancement with delayed washout and capsular enhancement of the mass (arrow); G, Axial hepatobiliary phase image shows a mass (arrow) with hypointensity.
Gadoxetic acid-enhanced and diffusion-weighted MR imaging of scirrhous HCC. A, Axial T1-weighted image shows a hypointense mass with lobulated contours in segment 7 (open arrow); B, Axial T2-weighted image shows a hyperintense mass (open arrow); C and D, Axial diffusion weighted image (b = 800 s/mm2) and apparent diffusion coefficient map show diffusion restriction (curved arrows) in the periphery of the mass (open arrows); E - G, Axial contrast-enhanced arterial, portal venous, and 2-minute delayed phase images show arterial rim-like enhancement and subsequent centripetal enhancement of the mass (open arrows); H, The mass (open arrow) has a target appearance consisting of central enhancement and a thin peripheral hypointense rim on hepatobiliary phase image.
Ultrasonography image shows two hypoechoic hepatic masses (arrow and open arrow) with abutment in the right hepatic lobe.
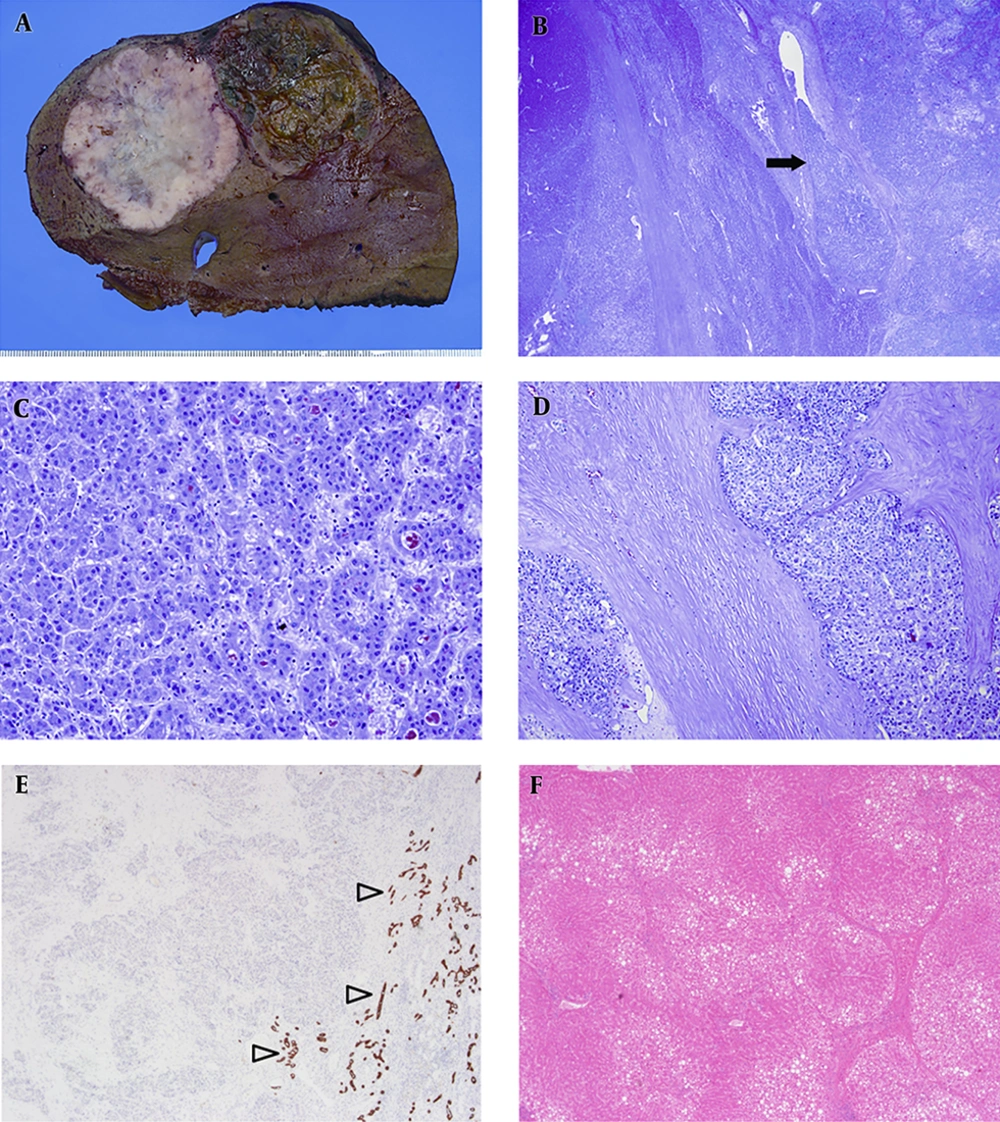
The resected liver demonstrated two hepatic masses, one measured 6.7 × 6 cm in segment 8 and another of 6 × 5.5 cm in segment 7. The tumor in segment 8 was characterized by a well-defined nodule with light brown coloration and hemorrhagic foci, whereas the tumor in segment 7 had a lobulated contour with whitish cut surface and showed dense fibrosis (
Figure 5A). There was no evidence of satellite nodules and lymph node metastasis. On histologic examination, the two hepatic masses were closely abutted but were separated by non-neoplastic liver (
Figure 5B). In the tumor in segment 8, polygonal tumor cells with eosinophilic cytoplasm were arranged in a trabecular and pseudoglandular pattern (
Figure 5C). The tumor in segment 7 was composed of polygonal cells and characterized by abundant and diffusely distributed fibrous stroma (
Figure 5D). Tumor cells in both segment 8 and 7 were negative for cytokeratin 19 (
Figure 5E). Mucin production was not identified by mucicarmine staining. Thus, the masses in segment 8 and 7 were diagnosed as classic HCC and scirrhous HCC, respectively. In non-neoplastic liver, complete and bridging fibrosis were demonstrated. Moderate fatty change with no significant portal and lobular inflammation was found (
Figure 5F). The histologic findings were consistent with early cirrhosis associated with alcohol consumption. He has been followed up on CT every 3 to 6 months, and there was no recurrence until 16 months after surgery.
A, Resected liver demonstrates two masses: the mass in segment 8 is a large nodule with brownish cut surface and foci of hemorrhage, while the mass in segment 7 is characterized by lobulated contour and whitish cut surface; B, In low-power view, the two tumors were distinctly separated by non-neoplastic liver and vascular invasion (arrow) was also noted; C, The tumor in segment 8 shows polygonal tumor cells with eosinophilic cytoplasm that are distributed in a trabecular and pseuoglandular pattern; D, The tumor in segment 7 shows nests of polygonal round cells embedded within abundant fibrous stroma; E, Cytokeratin (CK) 19 immunostaining highlights normal bile ducts (open arrowheads). However, the tumors in segment 7 and 8 are negative for CK19 immunostaining; F, Complete and vague nodular change of the liver with moderate fatty change was found that is consistent with early cirrhosis.
Ethical approval: all procedures in studies involving human participants were performed in accordance with the ethical standards of the institutional and/or national research committee and with the 1964 Helsinki declaration and its later amendments or comparable ethical standards. This article does not contain any studies with animals performed by any of the authors. Formal consent is not required for this type of study.