
1. Background
Significant technological advances have transformed three-dimensional echocardiography (3DE) into a fundamental tool for evaluating left ventricular (LV) volume and function (1). LV volume and ejection fraction (EF) are crucial prognostic indicators of complications and mortality across a broad spectrum of patients and clinical scenarios (2). Among the various applications of 3DE, assessment of ventricular and atrial volumes and function is particularly promising because it enables comprehensive evaluation of entire cardiac chambers simultaneously. Cardiac volume and function are key markers of disease severity and prognosis in both acquired and congenital structural heart diseases. Cardiac chamber dimensions are known to be influenced by racial and anthropometric factors (3, 4).
Although cardiac magnetic resonance (CMR) remains the gold standard for evaluating LV dimensions and function, 3DE has emerged as a viable alternative for routine clinical use because of its cost-effectiveness, avoidance of contrast agent exposure, and superior ability to capture true chamber geometry. This advantage makes 3DE more accurate than traditional two-dimensional echocardiography (2DE) for assessing volume and function (5). Evaluation of LV volume and EF is a cornerstone of cardiology, playing a pivotal role in guiding prognosis, informing therapeutic decision-making, and determining patient eligibility for various treatments and clinical trials (6-8). As a widely used modality, 2DE remains the most common imaging tool for assessing LV size and systolic function, with EF measurement being a primary reason for referral to echocardiography (9).
Despite its widespread use, 2DE has several limitations. Although it is noninvasive, portable, cost-effective, radiation-free, and rapid, it does not provide highly reliable, reproducible, and precise EF or volume measurements (10). Traditionally, 2DE uses the biplane Simpson method (method of discs) to estimate LV volume from cross-sectional imaging in only two orthogonal planes (9). However, this technique is susceptible to errors arising from foreshortening, inadequate endocardial border definition, narrow echocardiographic windows, and assumptions regarding LV geometry. These factors contribute to inaccuracies in LV volume quantification (10).
Three-dimensional echocardiography uses advanced matrix-array transducers capable of acquiring volumetric images of the entire heart within ≤ 8 cardiac cycles. Unlike earlier 3D imaging techniques, contemporary "live" 3D datasets enable volumetric analysis with minimal post-processing, thereby enhancing efficiency and accuracy (11). While CMR remains the gold standard for quantifying cardiac chamber volumes and function, 3DE offers a more accessible, cost-effective, and efficient alternative. It provides rapid and precise assessment of key prognostic indicators and therapeutic outcomes during follow-up of cardiovascular disease. The limitations of 2DE in quantifying cardiac chamber volumes, and consequently in evaluating cardiac function, are primarily attributable to 1) its reliance on assumptions about geometric shape and 2) the acquisition of imaging planes that are often misaligned rather than truly perpendicular. These limitations are particularly important in patients with ischemic or nonischemic LV dysfunction, in whom remodeling alters chamber geometry, leading to measurement inaccuracies and poor reproducibility (5).
2. Objectives
Given its ability to provide comprehensive chamber volume assessment with greater accuracy and reliability, 3DE has the potential to revolutionize clinical echocardiography, enhance the precision of cardiac function evaluation, and improve patient management strategies (12).
3. Methods
3.1. Study Design
This cross-sectional descriptive study aimed to determine normal reference values for left ventricular volumes and ejection fraction using three-dimensional echocardiography in a healthy Iranian population. These values may help establish population-specific standards for more accurate cardiac assessment.
3.2. Sampling Method and Sample Size Determination
Between March 21, 2024, and August 22, 2024, a prospective study was conducted involving 72 patients aged 20 years or older who were referred to the echocardiography laboratory for the assessment of left ventricular parameters.
3.3. Study Procedure
3.3.1. Inclusion Criteria
Participants meeting the following criteria were included in the study:
1) Age ≥ 20 years with no known cardiovascular disease, hypertension, or diabetes.
2) Hypertension was defined as systolic blood pressure (SBP) > 140 mm Hg and/or diastolic blood pressure (DBP) > 90 mm Hg, or a history of antihypertensive medication use.
3) No evidence of structural heart disease, as assessed by medical history, clinical examination, and two-dimensional echocardiography (2DE).
4) No evidence of left ventricular (LV) diastolic dysfunction on 2DE.
5) Ability to hold the breath during echocardiographic imaging to ensure optimal image quality.
3.3.2. Exclusion Criteria
Patients were excluded if they met any of the following criteria:
1) Presence of diastolic dysfunction, reduced left ventricular ejection fraction (LVEF), or LV dilation on 2DE.
2) Inadequate echocardiographic image quality that prevented accurate analysis.
3) Inability to hold the breath during image acquisition.
3.4. Echocardiography Protocol
All echocardiographic examinations were performed using the Philips EPIQ CVX system, equipped with HeartModel and 3D QLab® Advanced (version 6) software. After written informed consent was obtained, eligible patients underwent echocardiographic screening. Imaging was performed according to the European Association of Cardiovascular Imaging (EACVI) guidelines, and three-dimensional (3D) echocardiographic data were acquired at the end of the standard two-dimensional (2D) echocardiography session.
3.4.1. Patient Preparation
Patients were positioned supine on the examination table. Conductive gel was applied to enhance ultrasound-wave transmission and improve image quality. Patients were instructed to remain calm and relaxed to minimize respiratory-motion artifacts.
3.4.2. Probe Selection and Machine Settings
A 3D matrix-array transducer was used for imaging. Echocardiographic settings were optimized according to individual patient characteristics, including age, weight, and cardiac condition. Machine settings were adjusted to enhance the volumetric frame rate (~22 volumes per second) and ensure complete left ventricular coverage, including the endocardial and epicardial borders (Figure 1).
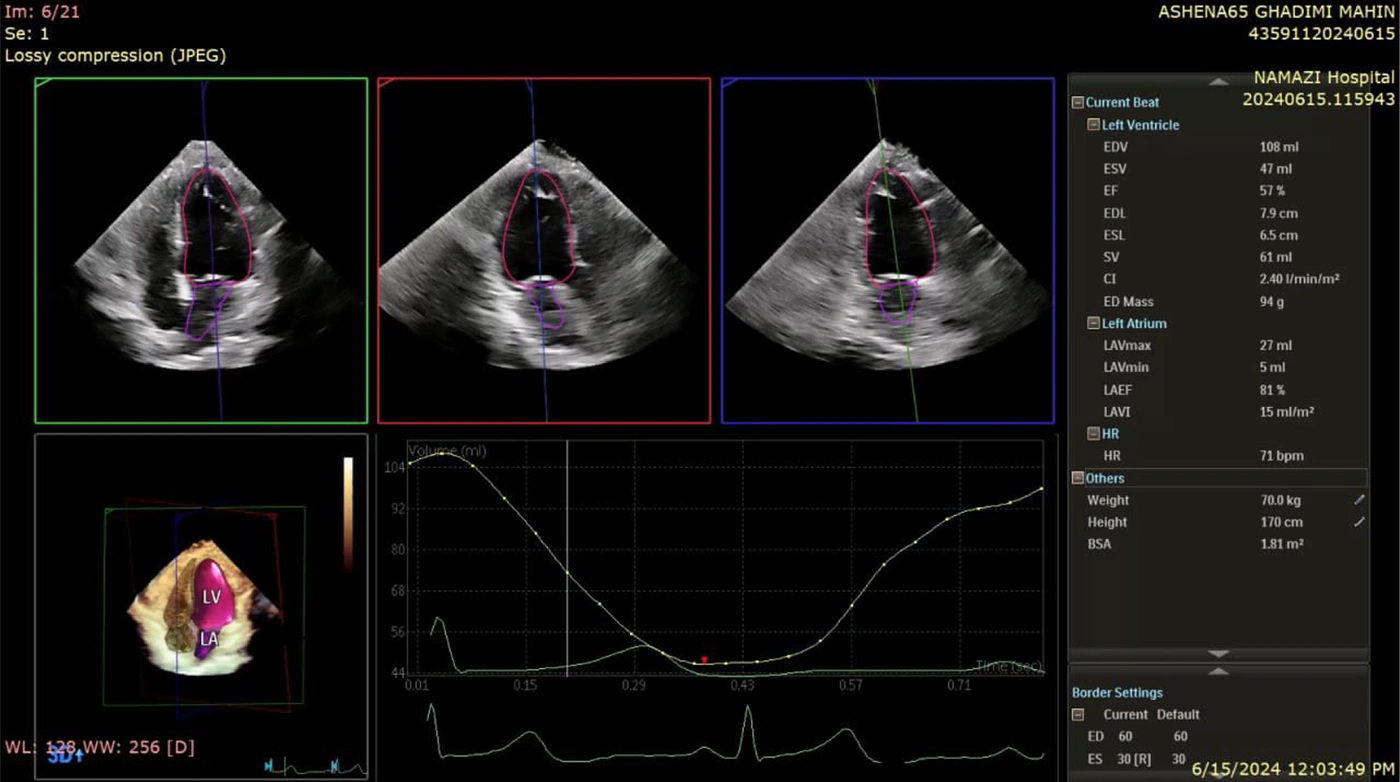
Figure 1.
The image is related to 3D echocardiography, which is used to assess left ventricular function and analyze heart volume and motion parameters. In this assessment, end-systolic and end-diastolic volumes of the left ventricle are measured, and the ejection fraction (EF), an index of the heart's pumping ability, is calculated. Based on the provided data, left ventricular systolic function falls within the normal range, and no signs of reduced function or clear heart failure are observed. Additionally, the left ventricular dimensions and volumes appear normal, with no signs of abnormal dilation. The volume-change chart throughout the cardiac cycle shows a regular pattern, indicating coordinated left ventricular function. Furthermore, the heart rhythm is regular, and no abnormal changes are recorded on the electrocardiogram. This type of assessment is commonly used to monitor heart function in patients with structural heart diseases, heart failure, and other left ventricular functional disorders.
3.4.3. 3D Image Acquisition
Patients were positioned in the left lateral decubitus position, and the transducer was placed at various chest locations. The apical four-chamber (Apical 4C) view was used for 3D imaging. Images were acquired throughout the cardiac cycle, capturing both systolic and diastolic phases for comprehensive volume analysis (Figure 2).
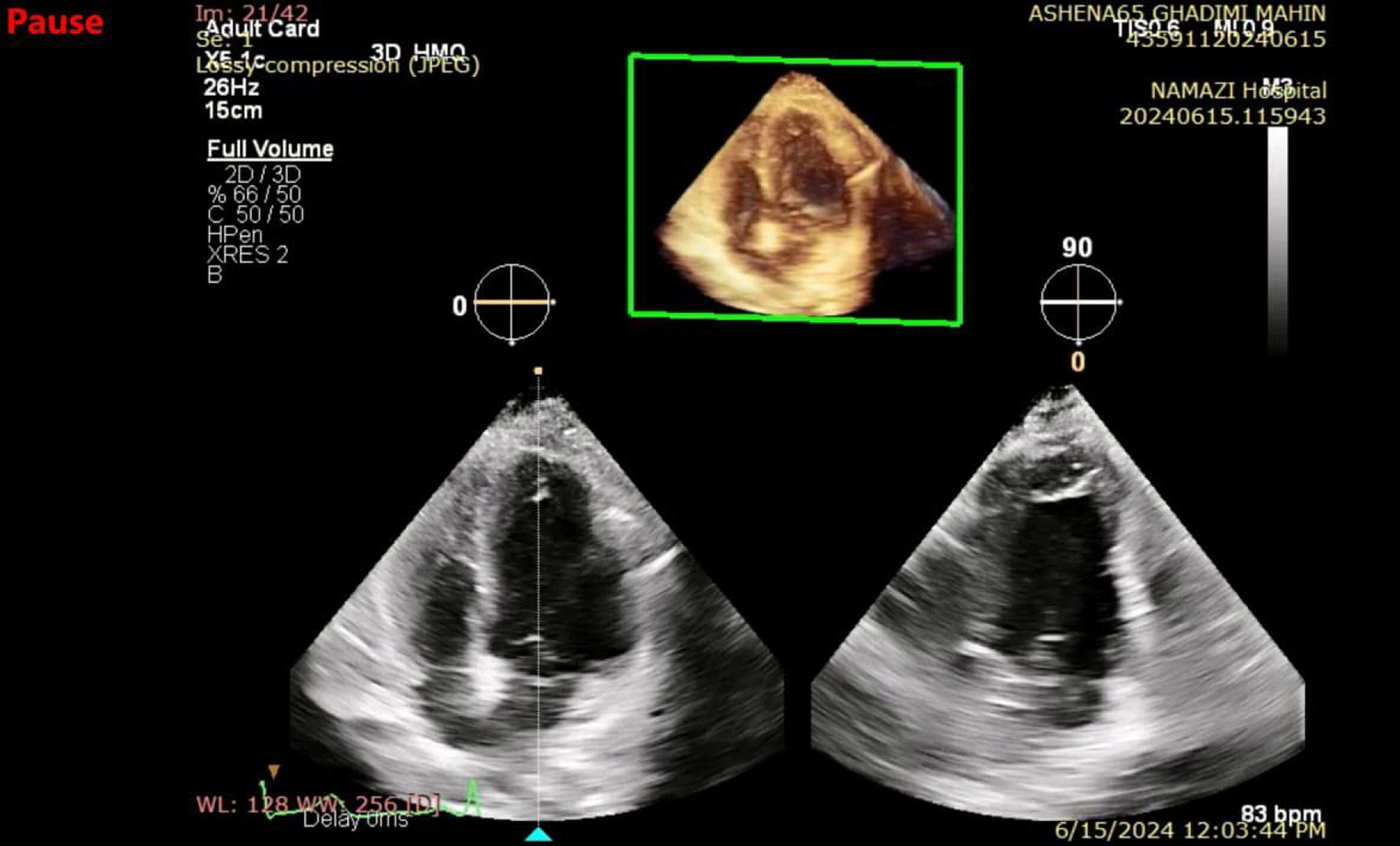
Figure 2.
This three-dimensional transthoracic echocardiography (3D TTE) image, captured in the apical four-chamber view, provides comprehensive visualization of the heart chambers, valves, and walls. The left and right ventricles, along with the left and right atria, are clearly delineated. Overall chamber sizes appear within normal limits, and left ventricular wall motion appears preserved. The three-dimensional reconstructed image enhances detailed assessment of valvular structures and intracardiac anatomy, providing valuable insights into cardiac function. With a recorded heart rate of 83 bpm, the rhythm is within the normal range. This echocardiographic view serves as a reliable tool for evaluating ventricular function, valvular integrity, and chamber dimensions, supporting both clinical and research applications.
3.4.4. Image Processing and Volume Measurements
Only patients with sinus rhythm and two consecutive cardiac cycles were included in the analysis using HM ACQ software. Image processing was performed using HM post-processing software, which automatically identified end-diastolic (ED) and end-systolic (ES) phases. When required, manual adjustments were made to correct software-detected boundary errors. The final echocardiographic analysis was performed by a senior cardiologist with more than 10 years of experience who had conducted approximately 7,000 two-dimensional and 250 three-dimensional echocardiographic assessments. Endocardial and epicardial borders were manually delineated for precise measurement. Left ventricular end-diastolic volume (LVEDV) and left ventricular end-systolic volume (LVESV) were determined by voxel counting within the endocardial boundary. Left ventricular myocardial mass (LVM) was calculated by subtracting the endocardial volume from the epicardial volume, assuming a myocardial density of 1.05 g/mL.
3.5. Statistical Analysis
Data were analyzed using SPSS software (version 15). One-way ANOVA was used to compare data between groups, and Tukey post hoc testing was applied for pairwise comparisons. A P value < 0.05 was considered statistically significant. Data were reported as mean ± standard deviation (SD).
4. Results
4.1. Statistical Analysis Overview
This section presents the findings derived from the collected data in accordance with the study objectives. Descriptive and inferential statistical methods were used to analyze the data, and the results are summarized in the relevant tables and figures. Descriptive statistics, including measures of central tendency and dispersion, were used to characterize the data, whereas significance tests were applied for inferential analysis. For continuous variables, the mean, standard deviation, and coefficient of variation were reported. In addition, 95% confidence intervals were included in graphical representations. Data normality was assessed using the Shapiro-Wilk test and combined skewness and kurtosis tests. For inferential analysis, an independent two-tailed t-test was performed, with a significance level of 5%. Statistical analyses were conducted using SPSS for Windows, version 16.0 (Chicago, SPSS Inc.).
4.2. Sample Size and Demographic Characteristics
The study included 72 patients aged 20 - 70 years, with a mean age of 42.13 ± 11.75 years. Of these, 56.9% (41 individuals) were male and 43.1% (31 individuals) were female. Demographic data were analyzed separately by gender (Table 1, Figure 3).
Table 1.
Demographic Characteristics of the Study Population a
| Characteristics | Total (n = 72) | Male (n = 41) | Female (n = 31) |
|---|---|---|---|
| Age (y) | 20 - 70 (42.13 ± 11.75) | - | - |
| Gender | 72 (100) | 41 (56.9) | 31 (43.1) |
a Values are expressed as mean ± SD or No. (%).
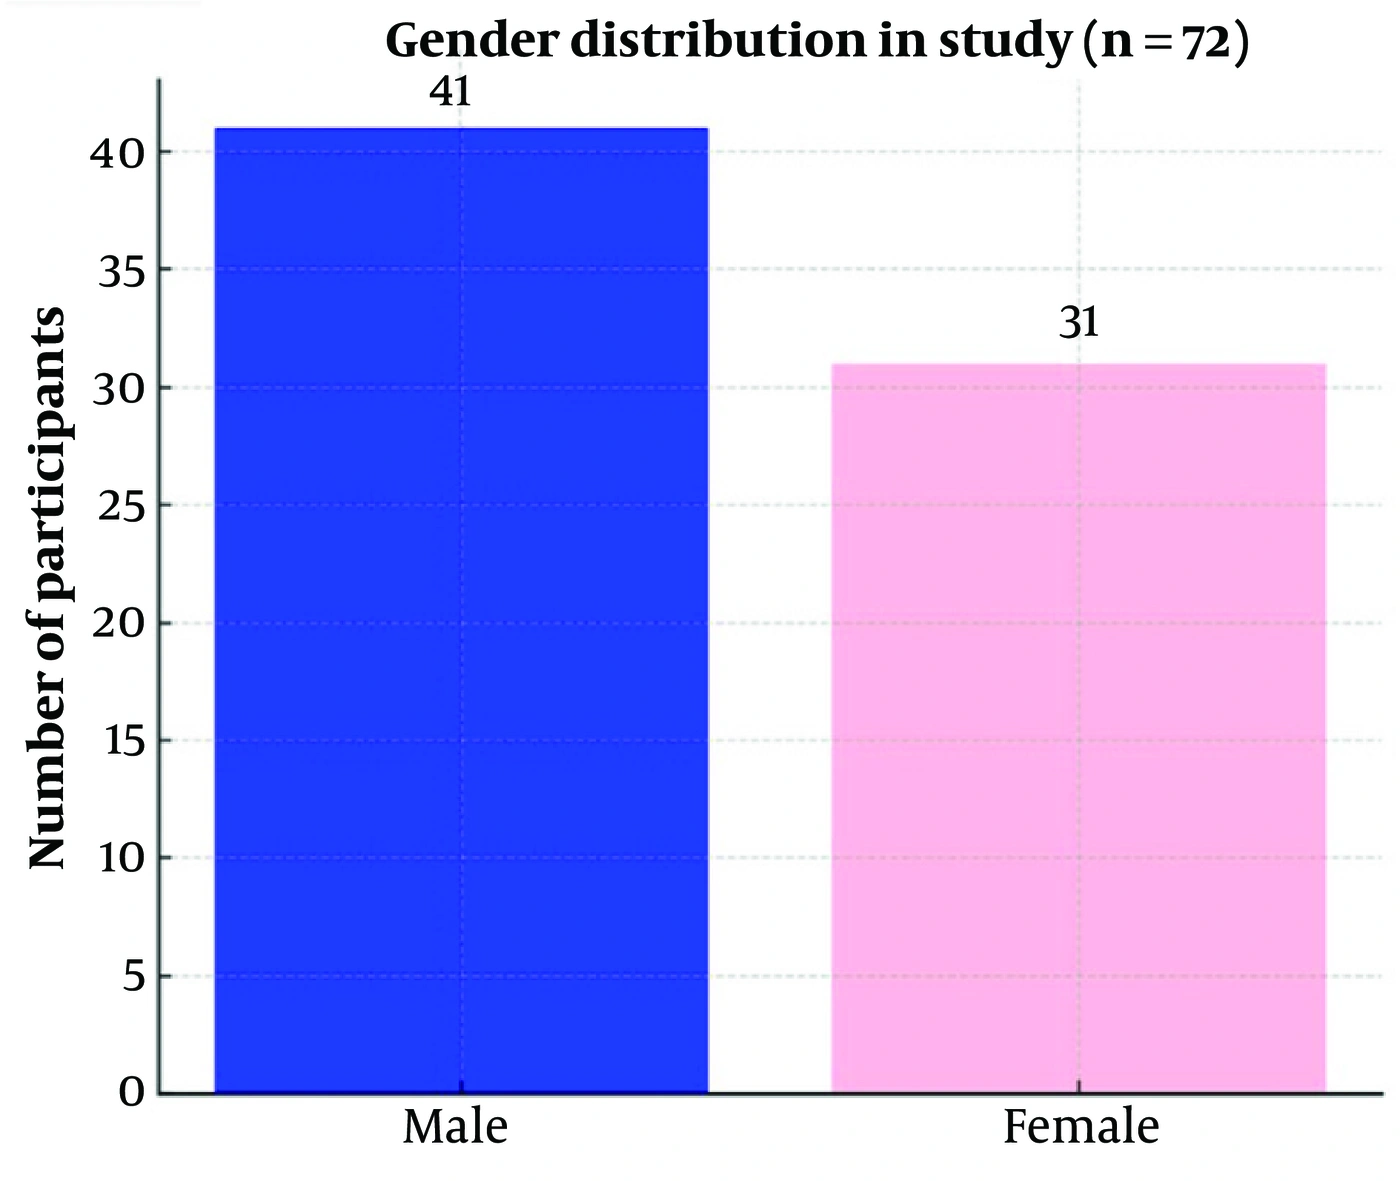
Figure 3.
Gender distribution of participants in the study (n = 72). A total of 41 male and 31 female participants were included, as illustrated in the bar chart.
4.3. Comparison of Echocardiographic Parameters by Gender
Gender differences in cardiac structure and function have been well documented in previous studies. This study aimed to compare various echocardiographic parameters between males and females to determine the extent of gender-based variation.
4.3.1. Body Surface Area
Body surface area (BSA) ranged from 1.49 to 2.37, with a mean of 1.84 ± 0.19. A statistically significant difference in BSA was observed between genders (P < 0.001), with males exhibiting a higher mean BSA (1.93 ± 0.13) than females (1.71 ± 0.13) (Table 2, Figure 3). This difference is expected because of variations in body composition and muscle mass between males and females.
Table 2.
Echocardiographic Parameters by Gender
| Parameter and Gender | Minimum | Maximum | Mean | Standard Deviation | P-Value |
|---|---|---|---|---|---|
| BSA | < 0.001 | ||||
| Male | 1.59 | 2.37 | 1.93 | 0.13 | |
| Female | 1.49 | 1.95 | 1.71 | 0.13 | |
| LVEDVI | 0.133 | ||||
| Male | 43.30 | 87.50 | 62.42 | 9.99 | |
| Female | 42.30 | 75.44 | 58.89 | 7.60 | |
| LVESVI | 0.547 | ||||
| Male | 14.30 | 38.90 | 24.92 | 5.68 | |
| Female | 12.10 | 31.10 | 23.60 | 5.01 | |
| EF | 0.140 | ||||
| Male | 53.00 | 73.00 | 60.17 | 5.38 | |
| Female | 54.00 | 74.00 | 60.19 | 5.71 | |
| LVED Mass | < 0.001 | ||||
| Male | 94.00 | 215.00 | 137.02 | 26.60 | |
| Female | 66.00 | 132.00 | 104.58 | 17.02 | |
| LVEDD | 0.004 | ||||
| Male | 3.80 | 5.49 | 4.86 | 0.38 | |
| Female | 3.98 | 5.39 | 4.51 | 0.31 | |
| LVESD | < 0.001 | ||||
| Male | 2.40 | 4.20 | 3.25 | 0.50 | |
| Female | 2.10 | 3.80 | 2.98 | 0.40 | |
| SV | < 0.001 | ||||
| Male | 48.00 | 98.00 | 72.66 | 11.98 | |
| Female | 43.00 | 77.00 | 61.61 | 8.31 | |
| CI | 0.435 | ||||
| Male | 1.84 | 3.52 | 2.68 | 0.42 | |
| Female | 1.87 | 3.80 | 2.77 | 0.47 | |
| LAEF | 0.421 | ||||
| Male | 51.00 | 74.00 | 64.04 | 5.39 | |
| Female | 43.00 | 75.00 | 65.16 | 6.99 | |
| LAVI | 0.203 | ||||
| Male | 10.00 | 27.00 | 18.90 | 4.27 | |
| Female | 12.00 | 23.00 | 17.39 | 2.85 |
Table 2 shows significant gender differences in several echocardiographic parameters. Males had higher BSA, LVED Mass, LVEDD, LVESD, and stroke volume (SV) than females (P < 0.05). However, no significant differences were observed in LVEDVI, LVESVI, EF, CI, LAEF, and LAVI between genders. These results suggest structural differences, whereas functional parameters remained comparable.
4.3.2. Left Ventricular End-Diastolic Volume Index
LVEDVI ranged from 42.30 to 87.50, with a mean of 60.90 ± 9.15. No statistically significant difference was observed between males (62.42 ± 9.99) and females (58.89 ± 7.60) (P = 0.133), suggesting that left ventricular filling capacity is not significantly influenced by gender in this population.
4.3.3. Left Ventricular End-Systolic Volume Index (LVESVI)
LVESVI values ranged from 12.10 to 38.90, with a mean of 24.35 ± 5.41. No statistically significant difference was observed between males (24.92 ± 5.68) and females (23.60 ± 5.01) (P = 0.547).
4.3.4. Ejection Fraction
Ejection fraction ranged from 53.00 to 74.00, with a mean of 60.18 ± 5.49. No statistically significant difference was observed between males (60.17 ± 5.38) and females (60.19 ± 5.71) (P = 0.140), indicating that systolic function remained comparable across genders.
4.3.5. Left Ventricular End-Diastolic Mass
A statistically significant difference in LVED Mass was observed between genders (P < 0.001), with males demonstrating higher values (137.02 ± 26.60) than females (104.58 ± 17.02). This finding is consistent with previous research indicating that males generally have greater left ventricular mass because of increased myocardial workload and larger body size.
4.3.6. Left Ventricular End-Diastolic Diameter
LVEDD values ranged from 3.80 to 5.49, with a mean of 4.71 ± 0.39. A statistically significant difference was observed (P = 0.004), with males exhibiting larger LVEDD values (4.86 ± 0.38) than females (4.51 ± 0.31).
4.3.7. Left Ventricular End-Systolic Diameter
LVESD showed a statistically significant difference between genders (P < 0.001), with males having higher values (3.25 ± 0.50) than females (2.98 ± 0.40).
4.3.8. Stroke Volume
Stroke volume (SV) showed a statistically significant difference between genders (P < 0.001), with males having a higher mean SV (72.66 ± 11.98) than females (61.61 ± 8.30). This difference is expected because of the larger left ventricular size and cardiac output in males.
4.3.9. Cardiac Index
Cardiac index (CI) did not differ significantly between males (2.68 ± 0.42) and females (2.77 ± 0.47) (P = 0.435). This suggests that although stroke volume is higher in males, overall cardiac output normalized to body surface area remains similar across genders.
4.3.10. Left Atrial Ejection Fraction
LAEF was slightly higher in females (65.16 ± 6.99) than in males (64.04 ± 5.39), although the difference was not statistically significant (P = 0.421). This finding is consistent with previous studies indicating that left atrial function remains comparable across genders.
4.3.11. Left Atrial Volume Index
LAVI was slightly higher in males (18.90 ± 4.27) than in females (17.39 ± 2.85), but the difference was not statistically significant (P = 0.203). The left atrial volume index is an important marker of diastolic function and does not appear to be strongly influenced by gender in this cohort (Table 2, Figure 4, Figure 5).
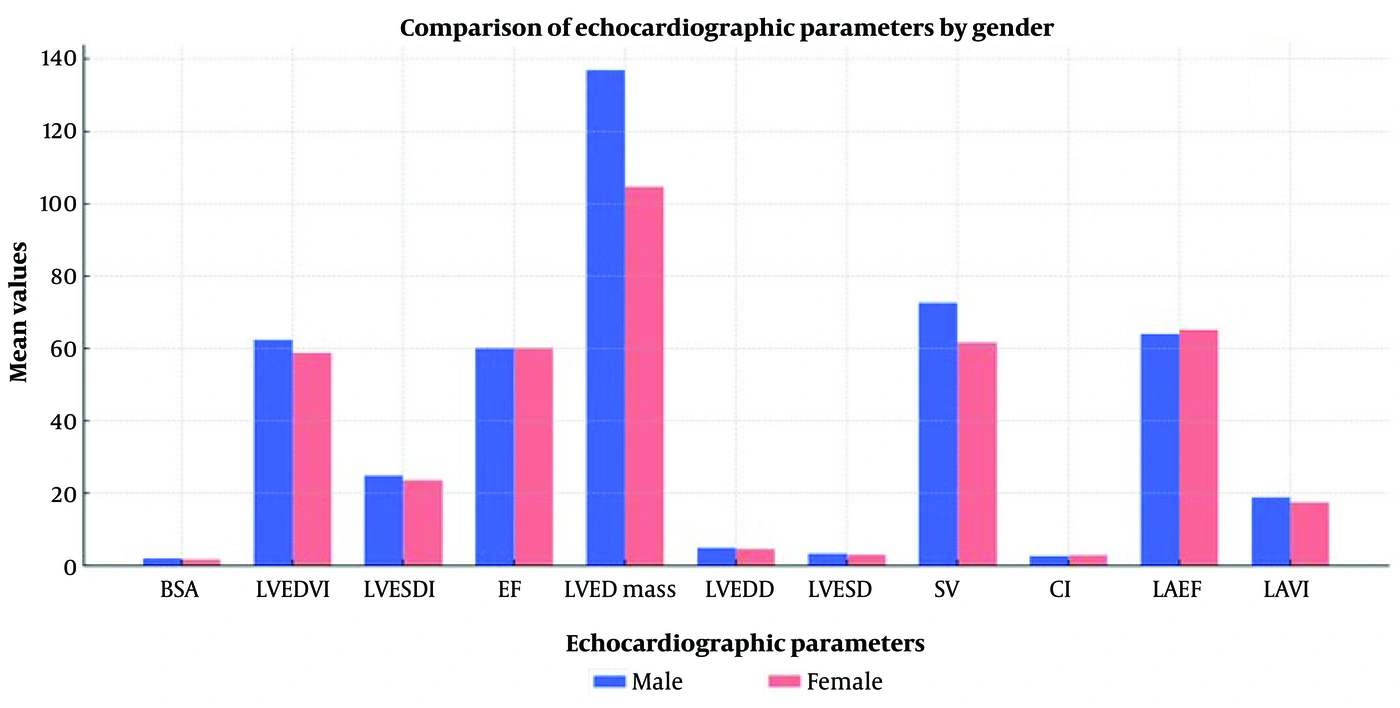
Figure 4.
Comparison of echocardiographic parameters by gender. The bar chart illustrates the mean values of key cardiac measurements in male and female participants. Males showed higher mean values for BSA, LVED Mass, LVEDD, LVESD, and stroke volume (SV), while other parameters, including EF and CI, were relatively similar between genders.
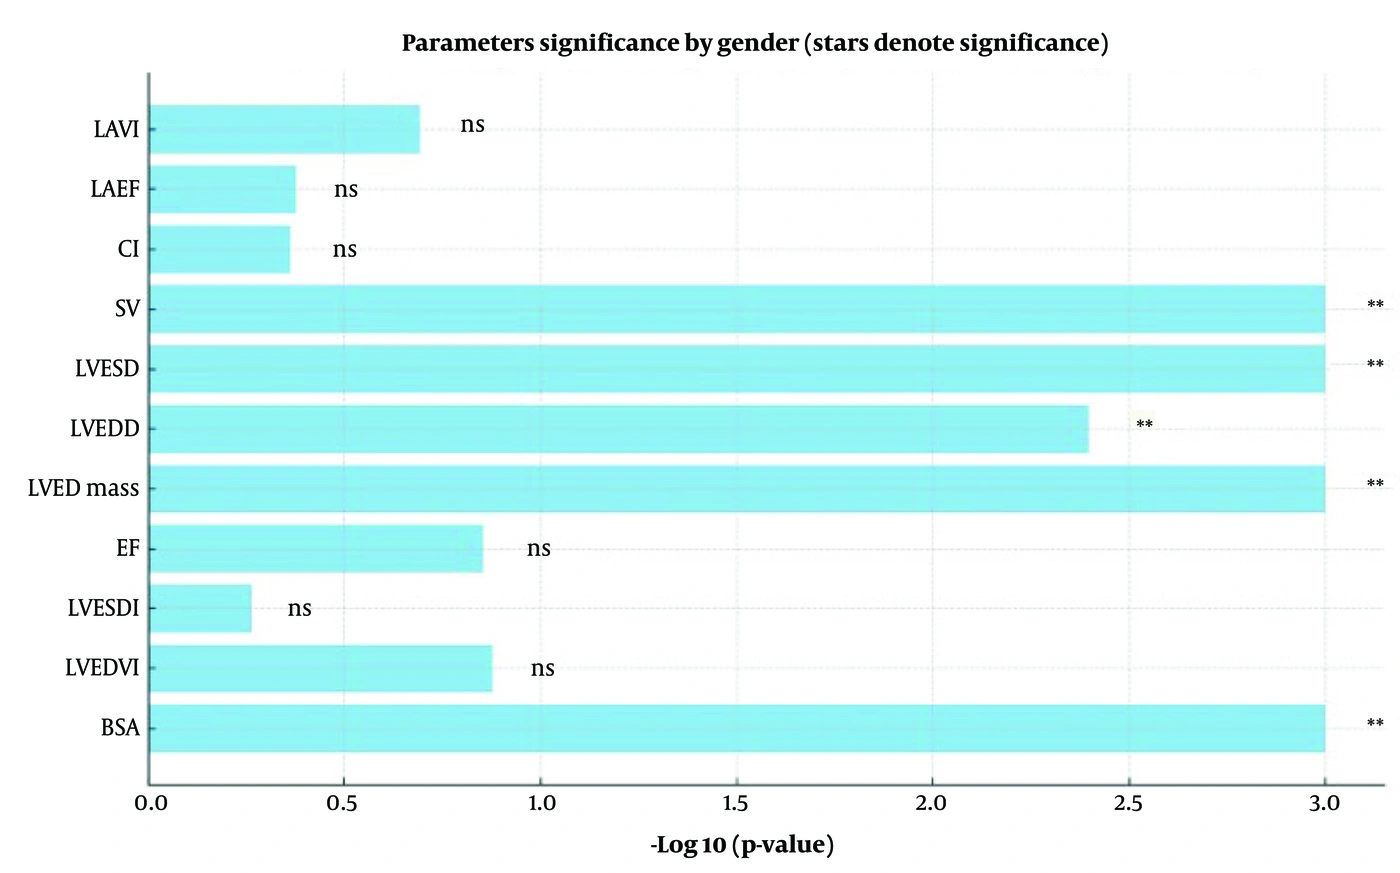
Figure 5.
The bar chart illustrates the statistical significance of gender differences across various echocardiographic parameters. The horizontal axis represents the negative logarithm of the P values (-log10 [P value]) derived from independent-sample t tests comparing male and female groups. This transformation allows clearer visualization of the level of significance, with larger values indicating stronger statistical evidence against the null hypothesis.; Each parameter is accompanied by asterisks denoting the level of significance based on conventional thresholds: *** indicates P < 0.001 (highly significant). ** indicates P < 0.01 (significant). * Indicates P < 0.05 (moderately significant). Abbreviation: ns denotes a nonsignificant difference (P ≥ 0.05).
The analysis showed that BSA, LVED Mass, LVEDD, LVESD, and SV differed significantly between genders, with P values less than 0.001 or 0.004. In contrast, LVEDVI, LVESVI, EF, CI, LAEF, and LAVI did not differ significantly.
4.4. Comparison of 3D Echocardiographic Measurements with CMR Reference Values
Table 1 provides a detailed comparison of left heart structural and functional parameters obtained using three-dimensional echocardiography (3D Echo) with the standard normal ranges reported for cardiac magnetic resonance imaging (CMR). Measurements are presented separately for male and female participants, along with their mean values and standard deviations.
For most parameters, including LVEDVI, LVESVI, EF, LVED Mass, LVEDD, LVESD, SV, CI, and LAVI, the mean values obtained from 3D Echo in both genders fell within the established normal CMR reference ranges.
However, LAEF values measured by 3D Echo were consistently higher than the upper limit of the CMR normal range (30 - 50%) in both male and female groups. This may reflect methodological differences between echocardiographic and MRI-based measurements of atrial function.
Furthermore, SV in females approached the lower limit of the CMR normal range, suggesting potential gender-specific differences in volumetric parameters that warrant further investigation.
Statistical analysis revealed significant gender differences in BSA, left ventricular mass, left ventricular end-diastolic and end-systolic diameters, and SV, all with P values < 0.05.
In conclusion, this comparison demonstrates strong concordance between 3D echocardiography values and established CMR reference standards for most left heart parameters, thereby supporting the reliability of 3D Echo as a valuable imaging modality for volumetric and functional assessment (Table 3, Figure 6).
Table 3.
Comparison of Left Ventricular and Atrial Parameters Measured by 3D Echocardiography in Males and Females, Presented as Mean ± Standard Deviation. Values Are Compared with Established CMR Normal Reference Ranges. Most 3D Echo Measurements Fall Within CMR Normal Limits, Except for LAEF, Which Exceeds Typical CMR Values
| Parameters and Gender | 3D Echo (Mean ± SD) | CMR Normal Range | Comparison / Comment |
|---|---|---|---|
| BSA (m2) | |||
| Male | 1.93 ± 0.13 | - | - |
| Female | 1.71 ± 0.13 | - | - |
| LVEDVI (mL/m2) | |||
| Male | 62.42 ± 9.99 | 50 - 90 | Within normal CMR range |
| Female | 58.89 ± 7.60 | 50 - 90 | Within normal CMR range |
| LVESVI (mL/m2) | |||
| Male | 24.92 ± 5.68 | 20 - 40 | Within normal CMR range |
| Female | 23.60 ± 5.01 | 20 - 40 | Within normal CMR range |
| EF (%) | |||
| Male | 60.17 ± 5.38 | 55 - 75 | Normal |
| Female | 60.19 ± 5.71 | 55 - 75 | Normal |
| LVED Mass (g) | |||
| Male | 137.02 ± 26.60 | 70 - 150 | Within normal CMR range |
| Female | 104.58 ± 17.02 | 60 - 120 | Within normal CMR range |
| LVEDD (cm) | |||
| Male | 4.86 ± 0.38 | 4.5 - 5.5 | Normal |
| Female | 4.51 ± 0.31 | 4.0 - 5.0 | Within normal CMR range |
| LVESD (cm) | |||
| Male | 3.25 ± 0.50 | 2.5 - 3.5 | Normal |
| Female | 2.98 ± 0.40 | 2.0 - 3.0 | Borderline upper normal |
| SV (mL) | |||
| Male | 72.66 ± 11.98 | 60 - 100 | Normal |
| Female | 61.61 ± 8.31 | 60 - 100 | Normal but close to lower limit |
| CI (L/min/m2) | |||
| Male | 2.68 ± 0.42 | 2.5 - 4.0 | Normal |
| Female | 2.77 ± 0.47 | 2.5 - 4.0 | Normal |
| LAEF (%) | |||
| Male | 64.04 ± 5.39 | 30 - 50 | Higher than normal CMR range |
| Female | 65.16 ± 6.99 | 30 - 50 | Higher than normal CMR range |
| LAVI (mL/m2) | |||
| Male | 18.90 ± 4.27 | 16 - 34 | Within normal CMR range |
| Female | 17.39 ± 2.85 | 16 - 34 | Within normal CMR range |
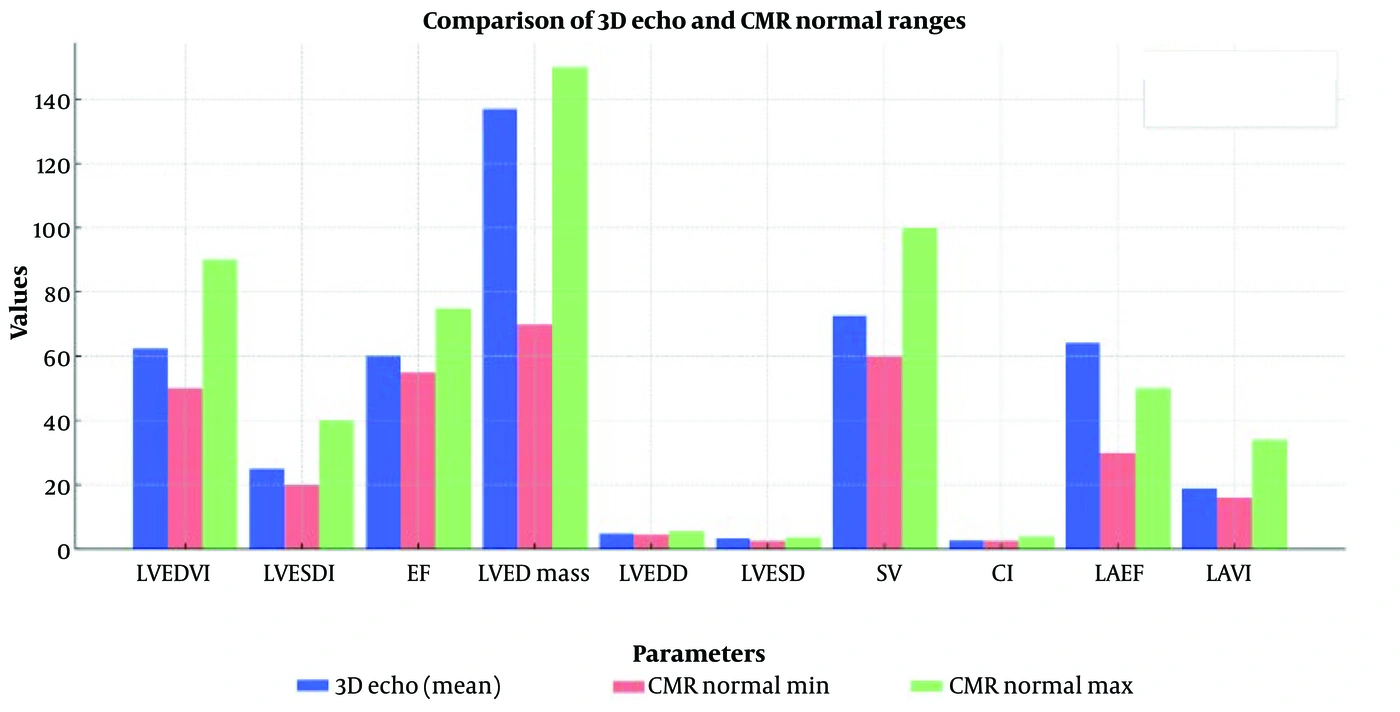
Figure 6.
This bar chart compares the mean values obtained from 3D echocardiography (3D Echo) with the normal range of cardiovascular magnetic resonance (CMR) for various cardiac parameters. Blue bars represent the mean values measured by 3D Echo. Red bars indicate the lower limit of the normal CMR range. Green bars indicate the upper limit of the normal CMR range. This comparison helps assess whether the echocardiographic measurements fall within the expected CMR range, providing insight into the reliability of 3D Echo in evaluating cardiac function. In most cases, the values remain within the normal range, although some parameters are near the upper or lower limits and require further consideration.
5. Discussion
The findings of this study highlight strong concordance between three-dimensional echocardiography (3D Echo) and cardiac magnetic resonance imaging (CMR) in assessing left heart structure and function. Most parameters, including left ventricular end-diastolic and end-systolic volume indices (LVEDVI, LVESVI), ejection fraction (EF), left ventricular mass (LV mass), stroke volume (SV), cardiac index (CI), and left atrial volume index (LAVI), were within the CMR-established reference ranges. These results support the accuracy and clinical applicability of 3D Echo as a reliable, noninvasive imaging modality.
One notable discrepancy was the consistently higher left atrial emptying fraction (LAEF) measured by 3D Echo compared with the upper CMR reference limit (30 - 50%). This finding is likely attributable to differences in imaging methodology, as echocardiographic techniques may be more sensitive to atrial functional changes than MRI-based measurements. Further studies are needed to clarify the clinical significance of this difference and establish modality-specific normal ranges.
Additionally, stroke volume in female participants approached the lower limit of the CMR normal range, suggesting possible sex-based differences in volumetric parameters. Significant sex differences were also noted in left ventricular mass, left ventricular diameters, stroke volume, and body surface area (BSA), with P values < 0.05. These findings underscore the importance of considering sex-specific reference values in echocardiographic assessments to improve diagnostic precision and clinical decision-making.
Three-dimensional echocardiography offers several advantages over CMR and computed tomography (CT), including faster imaging, cost-effectiveness, and the absence of ionizing radiation, making it well suited for routine clinical evaluations and long-term follow-up. Given the close alignment of 3D Echo measurements with CMR standards, this modality may serve as a primary method for assessing left heart function in both healthy individuals and patients with cardiovascular diseases.
Further research is warranted to refine population-specific normal ranges, particularly for underrepresented ethnic groups, and to investigate the clinical impact of the observed sex-based differences in cardiac volumetric parameters.
5.1. Conclusions
This study demonstrates strong concordance between left heart structural and functional parameters obtained using three-dimensional echocardiography (3D Echo) and established normal ranges from cardiac magnetic resonance imaging (CMR). Most volumetric and functional indices, including LVEDVI, LVESVI, EF, LV mass, LV diameters, SV, CI, and LAVI, fell within the CMR reference limits, confirming the reliability of 3D Echo for comprehensive cardiac assessment.
However, LAEF values measured by 3D Echo exceeded the upper CMR reference limit in both sexes, likely because of methodological differences between imaging modalities. Additionally, stroke volume in females approached the lower normal range, highlighting potential sex-specific variations that warrant further investigation.
Statistical analysis revealed significant sex differences in key cardiac parameters, including BSA, LV mass, LV diameters, and SV (P < 0.05). These findings emphasize the need for localized reference values for precise clinical assessments, particularly in the Iranian population.
Given its accuracy, noninvasiveness, cost-effectiveness, and radiation-free nature, 3D echocardiography is a valuable imaging modality for assessing LV structure and function. Its close alignment with CMR standards reinforces its role as a preferred tool for both routine evaluations and long-term follow-up in clinical practice.