
1. Background
Nowadays, there is a rising demand for recognition of factors that enroll in the process of aging and its effect on the brain and nervous system as a consequence of the world's population's longevity increase (1). According to Frolick et al.'s study, brain aging is associated with decreased cortical insulin concentration, impaired insulin receptor binding ability (2), and downregulation of insulin receptors in the blood-brain barrier (BBB) as a result of prolonged peripheral hyperinsulinemia and insulin resistance (3), which can result in insulin resistance in the brain, impaired systemic glucose control, and impaired glucose uptake in the brain (1). However, insulin was initially considered only a peripheral hormone, which was unable to cross the BBB; it was later demonstrated that the insulin concentration is much higher in the brain than in other organs (3, 4). It may, therefore, play an essential role in several processes within the central nervous system (CNS), including neuronal survival, neuroplasticity, memory, and cognitive abilities (5, 6). Three different sources of brain insulin augmentation have been discovered hitherto: Saturable insulin receptor-mediated pathway (7), Free diffusion of insulin through porous capillaries in circumventricular regions, and insulin production within the brain confirmed by animal experiments in 2015 (1). It is suggested that one possible condition implicated in brain aging could be chronic oxidative stress (8). As a result, the production of reactive oxygen (ROS) and nitrogen (RNS) species is out of balance. In addition, it is influenced by the efficiency of enzymes (e.g., catalase, glutathione peroxidase, superoxide dismutase) and non-enzymatic anti-oxidative systems (e.g., reduced glutathione (GSH), uric acid) (9). The latter leads to oxidative damage to the cell membrane or mitochondria, proteins, and nucleic acids (10). Furthermore, GSH, an essential brain antioxidant, regulates gene expression (including insulin signaling proteins) and neuronal apoptosis (11). According to Kimura et al., 2005, insulin moderates ROS-induced oxidative stress by activating PI-3K/Akt and/or extracellular signal-regulated kinase (ERK) signaling pathways through stimulation of uric acid and GSH redox cycles (12). However, previous studies proposed the hypothesis of insulin interaction in the brain and its potential role in aging; the main mechanism of its effects remains unknown. It has been shown that insulin increases the GSH and blocks the rise of ROS, thus preventing neuronal damage and death (12).
2. Objectives
The present study aimed to investigate the neuroprotective effect of insulin by prohibiting oxidative stress-mediated neuronal injury.
3. Methods
3.1. Animals
The present study protocol was reviewed and approved by the Ethics Committee at Shahid Beheshti University of Medical Sciences, Tehran, Iran (IR.SBMU.RETECH.REC.1400.026). The Pasteur Institute of Iran provided 48 adult male Naval Medical Research Institute (NMRI) mice weighing 25 - 30 g for this experiment. Animals were housed under standard conditions (22 °C and 12 hours of daylight/dark) and provided with food and water ad libitum. To divide the mice into 2 groups, we followed these steps: Group I (Control): The control animals were treated with water on weeks 8, 12, and 33. Group II (Insulin): The animals of this group received insulin at the dose of 100 µL with a 72-hour interval by intraperitoneal (IP) injection for 8, 12, and 33 weeks. It should be mentioned that when mice are weaned after 21 days of age, treatment was performed up to 8, 12, and 33 weeks in insulin groups. At the end of 8, 12, and 33 weeks, the right hemisphere was extracted for stereology analysis, and the left hemisphere was used for molecular and cellular analyses.
3.2. ROS in the Brain Tissue
The brain cells were isolated with the ethylenediaminetetraacetic trypsin acid (EDTA) (Sigma-Aldrich); after that, the samples were centrifuged with phosphate-buffered saline (PBS) (Sigma-Aldrich) at 1200 rpm at 4 °C for 5 min. Then, the 2,7-dichlorofluorescein diacetate (DCFDA) was added at a concentration of 20 μM in a 100 μL aliquot to the sample and stored in a 37°C incubator in the dark for 45 min. Finally, the sample was investigated by a flow cytometer with a wavelength of 495 nm (13).
3.3. GSH Disulfide Content Assessments
The GSH peroxidase assay kit (Zelbio GmbH) was used to measure GPX in brain tissue samples with a sensitivity of 5 U/mL (5 kU/L). As part of this essay, the GPX activity unit was examined, which catalyzes the decomposition of 1 μmol of GSH into glutathione disulfide (GSSG) in 1 minute. Following ortho-phthalaldehyde (OPA) and N-ethylmaleimide (NEM) staining of the testicular cell suspension (0.5 mL), the aliquots of the sample were centrifuged at 1000 rpm for 1 minute. For the next step, the cell pellet was suspended in 2 mL of fresh incubation medium twice so that the fluorescent dye was removed from the media twice. Lastly, all samples were adjusted to 495 nm excitation and 530 nm emission wavelengths using the Shimadzu RF5000U fluorescence spectrophotometer (13).
3.4. Tissue Preparation
In the end, the animals were sacrificed, and the testes were obtained and stored in Bouin's solution for 48 hours before being embedded in paraffin. With a microtome (Leica RM2125 RTS, Germany), we then made serial sections. The SURS (Systematic Uniform Random Sampling) was used to select 10 sections from each sample by picking a random number between 1 and 10. After that, they were stained with hematoxylin and eosin (H&E).
3.5. Total Volume of the Brain Cortex
The Cavalieri method was used to estimate the brain's total volume. The volume of the brain cortex was estimated using the following formula (12, 14).
This method is based on the sum of points that hit each brain section, which is ΣP. It also considers the size of the area associated with each point as a/p, and the distance between the sampled sections is t.
3.6. Number of Cortical Neurons and Glial Cells
The optical dissector method was used to estimate the number of neurons and glial cells (15). Using the equation below, we calculated the numerical density (Nv) of brain cells:
In this equation, (ΣQ) is the number of cells; (ΣP) is the number of counting frames per field; (a/f) is the area of the frame; (h) is the height of the dissector; (BA) is the thickness of the microtome section; and (t) is the thickness of the real section (16).
3.7. Immunohistochemically Study of GFAP Expression
After permeabilization (0.25% Triton® X-100 in PBS), the tissue section was incubated at EZ-RT for 20 min. Following that, a hydrogen peroxide (H2O2) solution of 3% was added for 10 minutes as a blocking solution. For GFAP detection, tissue sections were incubated with diluted (1:300) primary antibody (AB7260, Abcam). Follow the manufacturer's instructions when preparing the conjugated secondary antibody. We then incubated the sections with the avidin-biotin complex substrate and exposed them to 0.05% 3,3-diaminobenzidine tetrahydrochloride (DAB) (Abcam) and 0.03% hydrogen peroxide in 0.05mTris buffer (PH 7.6). To examine the sections under a light microscope, we mounted them, counterstained them, and exposed them to DAB.
3.8. Analysis of Caspase3, BAX, and BCL-2 Expression Using Real-Time Polymerase Chain Reaction (PCR)
All RNA samples were extracted with DNase I (Roche, Basel, Switzerland) after extraction to remove contamination caused by genomic DNA. Per manufacturer instructions, we synthesized cDNA at 42 C for 60 minutes in a commercial kit (Fermentas, Lithuania). Quantification of gene expression was done using TaqMan real-time PCR (Takara Bio Inc, Japan) with the QuantiTect SYBR Green RT-PCR kit. As an internal control, GAPDH expression levels were normalized for each target gene. Primers were designed using Primer3Plus software using an exon-exon junction method to separate cDNA from genomic DNA (17). The PCR primers were first tested with the Primer-Blast tool on the NCBI website (www.ncbi.nlm.nih.gov/tools/primer-blast) (Table 1).
Table 1.
Primers Design
| Genes | Primer Sequences |
|---|---|
| GAPDH | F: CTCAAGATTGTCAGCAATGC |
| R: CAGGATGCCCTTTAGTGGGC | |
| Caspase3 | F: AGCTTCTTCAGAGGCGACTA |
| R: GGACACAATACACGGGATCT | |
| BAX | F: AGGATAGAGCAGGGAGGATGG |
| R: TGGTAGCAAAGTAGAAGAGGG | |
| BCL2 | F: AGGAATGTGTGGAATGTGGAGA |
| R: AGATGAATGGTAGAGGGTGTGA |
3.9. Statistical Analysis
Analyses of quantitative data were conducted on all independent samples, and results are presented as mean ± standard deviation (SD). SPSS v. 20 (IBM Corp., Armonk, NY, USA) was used for all statistical analyses. The t-test was used to determine statistical significance. P < 0.05 was considered statistically significant.
4. Results
4.1. ROS and GSH Analysis
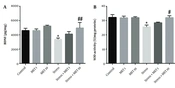
The effect of insulin on the formation of ROS and GSH as a marker for oxidative stress was assessed. The ROS production in the control group showed a significant increase compared to the insulin group at 33 weeks (P < 0.05) (Figure 1A). Moreover, the concentration of GSH in the insulin group significantly increased in comparison to the control groups (P < 0.05) (Figure 1B). However, no significant difference was seen after 8 and 12 weeks of treatment with insulin (Figures 1A and B).
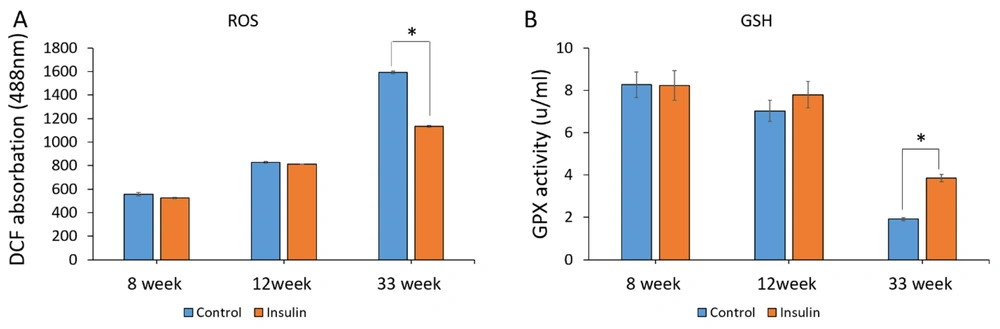
Figure 1.
The effect of insulin on reactive oxygen species (ROS) production and the level of glutathione (GSH) in an experimental animal model of brain aging. (A and B) Mean ± SD of the ROS production and GPX activity of the brain in the study groups (6 animals per group) compared by the ANOVA and LSD; (*P < 0.05). ANOVA: Analysis of variance; LSD: Least significant difference. The results show an increase in oxidative stress and a decrease in GSH with an increase in the age of the animals, while insulin treatment reverses the trend and is significant.
4.2. Stereological Analysis
The results of stereological parameters are shown in Figure 2A - D. Overall, in all cases, the volumes of the brain cortex, the number of neurons, and glial cells had better results in the insulin group at 8, 12, and 33 weeks as compared to the control group. In detail, the results showed that volumes of the brain in the insulin group at 33 weeks were significantly higher in comparison to the control group (P < 0.05) (Figure 1A). At the cellular level, the number of cortical neurons was significantly (P < 0.05) higher at 33 weeks in the insulin group in comparison to the control group (P < 0.05) (Figure 1B). Furthermore, the number of glial cells significantly decreased in the insulin group in comparison to the control group (P < 0.05) (Figure 1C). However, no significant difference was seen after 8 and 12 weeks of treatment (Figure 1A - C). The photographs from the brain cortex of mice in 2 experimental groups, which represent the protective effect of insulin over time, are shown in Figure 2D, and the results of H&E staining showed that histological parameter changes occur in animal brain tissue with age, which will reduce brain volume, decrease neurons, and increase glial cells (Figure 2D).
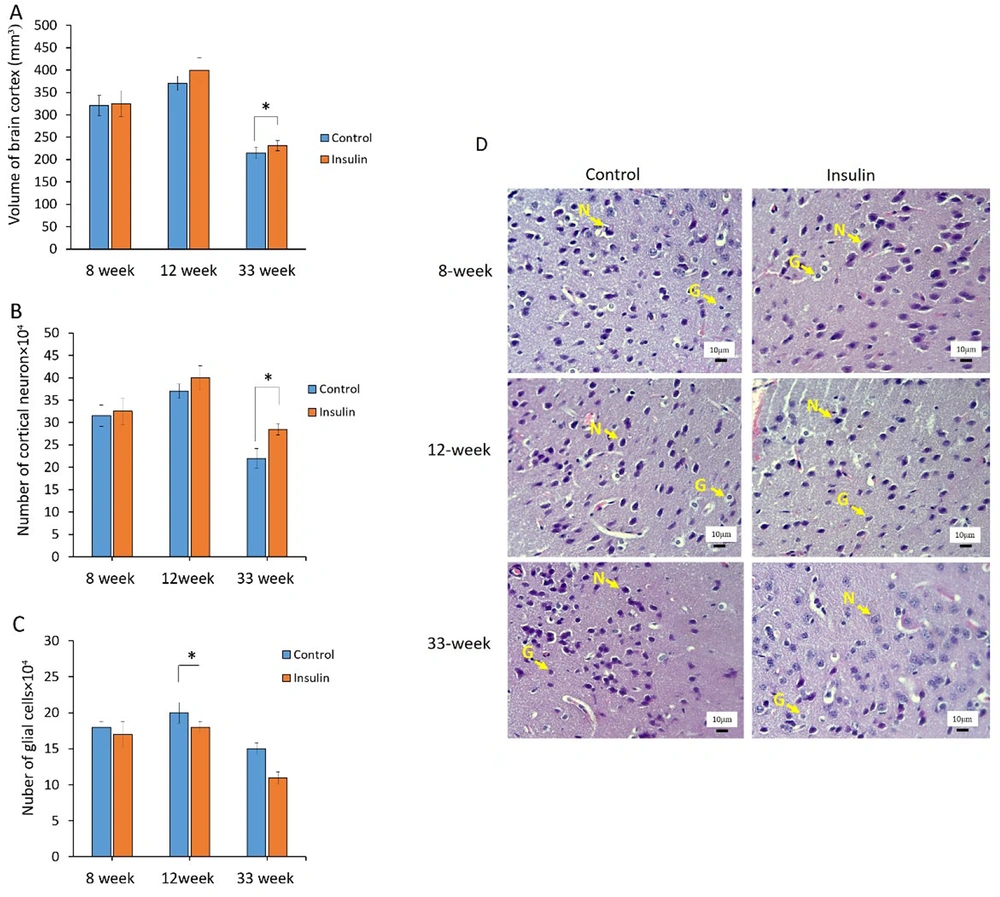
Figure 2.
The effect of insulin on stereological parameters in an experimental animal model of brain aging. (A-C) Mean ± SD of the volume and number of neurons and glial cells in the study groups (6 animals per group) compared by the ANOVA and LSD; (*P < 0.05). ANOVA: Analysis of variance; LSD: Least significant difference. (D) Photomicrograph of the cortex of brain stained with hematoxylin and eosin (H&E), 40 in study groups. The glial cells were distinguished from neurons by their smaller size and lack of a nucleolus and stained cytoplasm. Neuron (N); Glial cells (G).
4.3. GFAP Expression
The results revealed that the protein expression rate of GFAP significantly increased in the brain in the control groups as compared with the insulin group at 33 weeks (P < 0.05), but at 8 and 12 weeks, there was no significant difference between the control and insulin groups (Figure 3A and B). However, when the animals were treated with insulin, the expression of this protein decreased significantly, which could be due to the protective effect of insulin in the process of astrogliosis (Figures 3A and B).
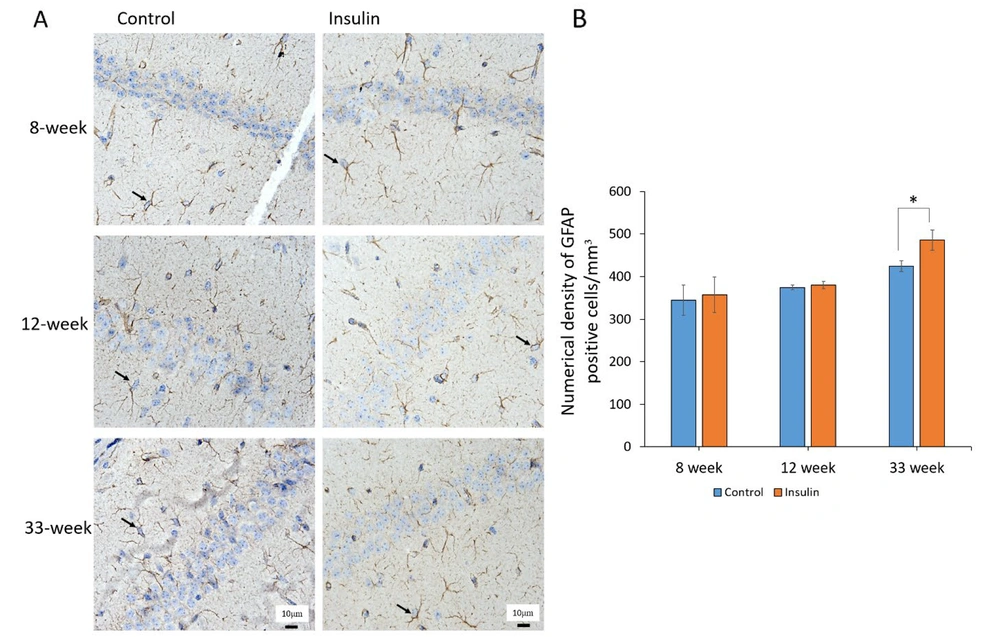
Figure 3.
The effect of insulin on astrogliosis in an experimental animal model of brain aging. (A) Astrocytic immunostaining for glial fibrillary acidic protein (GFAP) in the brain. The yellow arrow denotes astrocyte. (B) Mean ± SD of the numerical density of GFAP positive cells in the study groups (6 animals per group) compared by the ANOVA and LSD; (**P < 0.05). ANOVA: Analysis of variance; LSD: Least significant difference. The results of immunohistochemistry showed that the expression of GFAP protein increased with age in the experimental group compared to the control group.
4.4. Real-Time PCR Analysis
The expression of transcripts for the 3 genes contributing to apoptosis (caspase-3, BAX, and BCL-2) was assessed at 8, 12, and 33 weeks to investigate the impact of insulin on the prevention of cell death at the molecular level. The expression of genes associated with apoptosis showed that insulin could have important effects in preventing the destruction of brain cells. In this study, the expression of caspase-3 was a significant reduction in the insulin group compared to the control group at week 33 (P < 0.05) (Figure 4A). The expression of the BAX was significantly decreased in the insulin group compared to the control group at week 33 (P < 0.05) (Figure 4B). The expression of the BCL-2 was a significant decrease in the insulin group compared to the control group at week 33 (P < 0.05) (Figure 4C). However, no significant difference was seen after 8 and 12 weeks of treatment with insulin (Figures 4A and B).
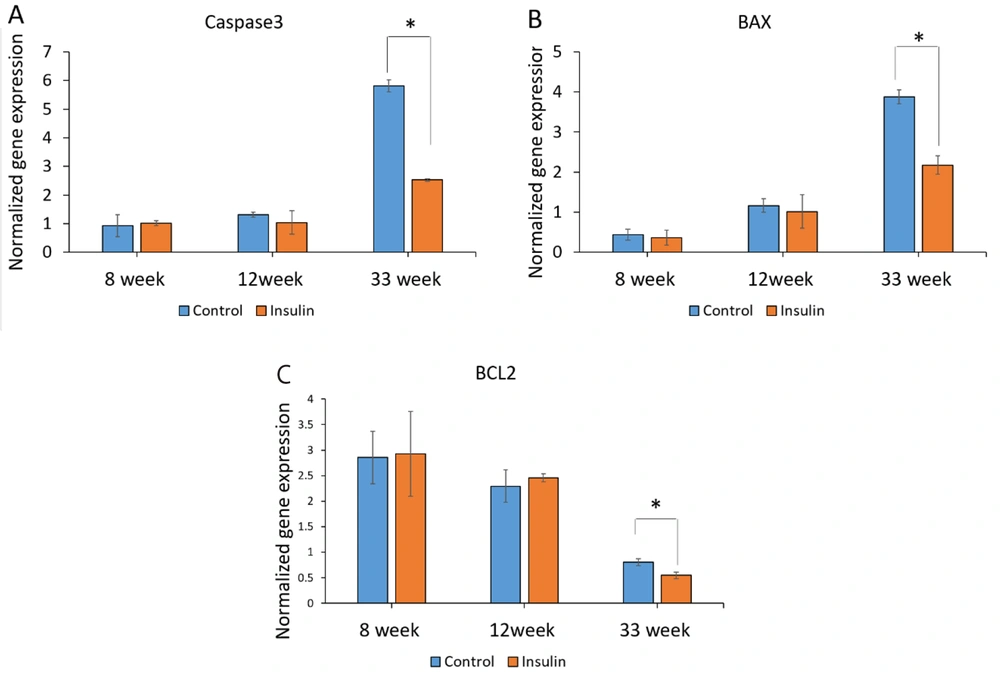
Figure 4.
The effect of insulin on apoptotic biomarkers in an experimental animal model of brain aging. (A-B) Mean ± SD of mRNA expression levels of caspase3, BAX, and BCL2 in the study groups (6 animals per group) compared by the ANOVA and LSD; (*P < 0.05). ANOVA: Analysis of variance; LSD: Least significant difference. The results of the expression of genes associated with apoptosis (caspase3, BAX, BCL-2) showed that insulin can have important effects in preventing the destruction of brain cells.
5. Discussion
Many studies started to focus on finding the role of insulin and its related mechanisms in the brain. It is documented that insulin and its signaling pathways participate in age-related neurodegenerative diseases (18). Therefore, it can be concluded that insulin can be used to treat age-related disorders; however, its mechanism is still unknown (14). Previous studies have shown the potential role of PI-3K/Akt and/or ERK signaling pathways of insulin receptors in cell protection against oxidation of lipids and proteins, which is an activator of the cell apoptosis process (18). This study aimed to investigate the role of insulin and its potential mechanism in age-related neurodegenerative diseases. For this purpose, the experimental group of rodents was fed with lifetime insulin to try to determine the possible therapeutic mechanism of insulin in the slackening of the brain aging process. We tried to define the brain insulin pathways, highlighting new mechanisms not well discussed hitherto. Mitochondria function is a critical organelle in cell apoptotic pathways. Apoptotic stimuli can change the mitochondria permeability, leading to the release of pro-apoptotic proteins like cytochrome C (19). Cytochrome C can further lead to the activation of the caspase cascade and, thus, a rise in the production of ROS, which is known as a cell apoptosis inducer (20). Besides, a reduction in GSH, as an essential protective factor against oxidative stress, was observed in age-related neurodegenerative diseases. Both conditions are related to neuronal death in the aging process. Our data suggest that insulin treatment can diminish ROS formation and render neuronal cells more resistant to it by a rise in the level of GPX. Thus, insulin can be used as a protective mechanism against neuronal cell aging. Based on previous studies, depletion of cyclic AMP response element-binding protein (CREB)-mediated expression of BCL-2 and caspase cascade may be involved in neuronal cell apoptosis (21). Our observation is that insulin decreased the encoding of caspase3 proteins and blocked the drop-fall of BCL-2 levels in the treatment group. We further demonstrated that BAX expression, an apoptotic regulator protein, was less with insulin treatment than in the control group, which can prevent cell death. Additionally, we applied 2 different staining techniques on brain tissue sections: H&E and immunohistochemistry methods. The H&E staining is used to determine the morphology of the CNS. Immunohistochemistry is also an astrocyte staining method that provides more detailed information about the structure of glial cells. The present study used these methods to distinguish neurons from glial cells in brain tissue. As expected, more glial cells and fewer neurons were observed in the control than in the treatment group. Therefore, the reduction in glial cells and increase in the neuron population in the insulin-treated group revealed the effectiveness of insulin in the prohibition of cell apoptosis. Our findings show the potential mechanism of insulin in the brain targeting the oxidative status, prohibits its harmful effect, and can be used as a neuroprotective/therapeutic agent against age-related disorders. Our data cannot suggest the exact dosage of insulin that can be used as a therapeutic agent. Additionally, the long-term adverse effects of external insulin usage on the body are still unknown. Furthermore, more clinical trials may be needed to improve the beneficial effect of insulin with different doses on human beings.
5.1. Conclusions
We used a brain-aging animal model and observed significant neuroprotective effects of insulin. Further, insulin conferred protection of neurons against aging changes and reduced apoptosis and cell death. This demonstration predominantly highlights the neuroprotective role of insulin in mice models of aging.