


1. Background
Obstructive sleep apnea (OSA) is a chronic sleep disorder that disrupts breathing during sleep due to the narrowing of the airway passages. This narrowing leads to the obstruction of airways. The obstruction causes a decrease or cessation of breathing, which then rouses the individual from sleep (1-5). Although the exact prevalence of OSA is not precisely determined, it ranges from 2 to 14 percent in the studied population (6, 7). In some countries, over half of the population is affected by OSA (8). The prevalence of OSA has increased in the United States over the past two decades. Around 60% of patients who are candidates for any type of surgery have OSA, which often goes undiagnosed and untreated until their preoperative visits (4, 9). Middle-aged and older patients are more prone to suffering from OSA (10). It is less common in women, particularly during perimenopause and among non-obese populations (3, 11). Older age, being male, and obesity are all risk factors (12-14). Obstructive sleep apnea raises the likelihood of perioperative complications, particularly respiratory issues (15, 16). The diagnosis and treatment of OSA and its complications are crucial. Overnight polysomnography is the gold standard for diagnosing OSA (17, 18). Since this diagnostic procedure is time-consuming, expensive, requires sleep medicine specialists, and labor-intensive, it may not always be accessible. However, simpler diagnostic procedures have been developed to allow for quicker diagnosis and treatment. One such screening tool is the STOP-Bang Questionnaire, which is a self-reported screening questionnaire. It consists of eight items including snoring, tiredness, observed apnea, high blood pressure, Body Mass Index (BMI), age, neck circumference, and gender. This questionnaire was initially developed to assess the risk of OSA in preoperative patients. Due to its simplicity and high sensitivity, it is commonly utilized during preoperative visits (19). Patients diagnosed with OSA are commonly deemed unsuitable candidates for craniotomy due to anticipated challenges related to maintaining proper oxygen levels, ensuring adequate ventilation, and managing a potentially complicated airway (20); thus, determining any possible OSA in seemingly normal patients is important to reduce the side effect of craniotomy and the rate of readmission (21). Early prediction of respiratory complications in patients undergoing craniotomy is crucial for ensuring the best possible patient care. By proactively identifying individuals at risk, healthcare providers can prepare the required equipment and resources ahead of time, ultimately enhancing patient safety and outcomes. The utilization of the STOP-Bang Questionnaire to accurately assess the risk of OSA and resulting developing respiratory complications post-craniotomy enables healthcare professionals to identify vulnerable patients who may require further investigations and interventions. This proactive approach not only reduces the likelihood of respiratory complications but also ensures that patients receive timely and targeted care, ultimately improving overall patient care and recovery following craniotomy procedures
2. Objectives
In this article, we aim to evaluate the ability of the STOP-Bang Questionnaire to predict respiratory and airway complications following supratentorial craniotomy.
3. Methods
We conducted a prospective cohort study on patients who underwent an elective supratentorial craniotomy between 2019 and 2020. This survey was approved by the Ethics Committee of Shahid Beheshti University of Medical Sciences (code: IR.SBMU.RETECH.REC.1398.074) and followed the Declaration of Helsinki study protocol. All patients who were included in the study were informed about the purpose of the study, and written informed consent was obtained from them. We included all the patients who were candidates for supratentorial craniotomy, aged over 18 to 80 years old, and were able to fully complete the questionnaire. Patients with a history of neuromuscular disorders, abnormal airway examinations, hypoparathyroidism, acromegaly, craniofacial abnormality, or previous airway surgery were excluded. Additionally, patients who experienced perioperative complications, lost more than 15% of intravascular volume, had craniotomies lasting more than four hours, or were transferred to the intensive care unit (ICU) while intubated were also excluded. As part of the study, patients who agreed to participate were given a preoperative visit and were asked to complete the STOP-Bang Questionnaire. Those with a score of less than three were classified as low-risk, while those with a score of three or higher were classified as high-risk. The Mallampati score was completed by a single anesthesiologist (EY) to predict difficulty in intubation based on the relation of the uvula, throat, and soft palate (22, 23). The EY instructed all patients to open their mouths and extend their tongues as much as possible. Patients were supine while the EY was measuring the Mallampati score. Patients were asked to remain silent during this process. Based on their observations, patients were classified into four categories: Class I, II, III, and IV (24). We divided patients into two groups: Those labeled as class I and II may have easy intubation, while the other two may experience hard intubation. Supratentorial craniotomy means the exposure of any part of a cerebral hemisphere over the basal line, joining the nasion to the inion (25). In this study, patients underwent craniotomy for supratentorial tumor. The anesthetic induction process was standardized for all patients in the study. Each patient was administered 0.02 mg/kg of midazolam, 2 mg/kg of propofol, 2 microgr/kg of fentanyl, 1 mg/kg of lidocaine, and 0.5 mg/kg of atracurium. Maintenance was achieved through the infusion of 100 microgr/kg of propofol and fentanyl. Throughout the surgical procedure, we closely monitored the patient's depth of anesthesia using the Bispectral Index (BIS) and maintained the BIS value between 45 and 55. The atracurium dose was repeated every thirty minutes during the surgery. Afterwards, patients were extubated in the operating room (OR) at the end of the surgery. Then, all patients received 100% oxygen via a face mask. They were then transferred to the recovery room where their pulse and oxygen levels were monitored by pulse oximetry. Besides, we monitored the patients’ blood pressure. While hospitalized, we kept track of any airway obstruction that required intervention (such as nasal or oral airway, jaw thrust, and reintubation), hypoxia, respiratory distress, tachypnea, complaints of difficulty in respiration or swallowing, hypotension, myocardial infarction, and new atrial fibrillation. All the patients were followed up until the end of their stay in neurosurgical ICU. Thus, we also recorded the length of stay in the recovery room and neurosurgical ICU. To effectively address potential biases in the study, several measures were implemented. First, patients were selected at random to further minimize the risk of selection bias, ensuring that the sample was representative of the population. Besides, in order to ensure accurate responses, patients were instructed to complete the questionnaire with care. A qualified general practitioner was assigned to explain each question thoroughly, which helped patients understand the intent behind the questions, thereby facilitating the most accurate responses possible. In addition, to enhance the integrity of the data collection process, the individual responsible for gathering the data was kept unaware of the patients' group allocations. This strategy aimed to prevent any unintentional influence on the data collection process. Moreover, the data analyst tasked with interpreting the results was also blinded to the grouping of participants, maintaining the objectivity of the analysis. Throughout the study, both negative and positive outcomes were meticulously recorded and reported, providing a comprehensive overview of the findings. These steps collectively contributed to a robust methodological framework designed to mitigate biases and ensure the reliability of the study results. The purpose of estimating sample size is to select an adequate number of participants to maintain the likelihood of errors at an acceptable level, while also preventing the study from being excessively large. To calculate the sample size, we used the G*Power software. Based on Vasu et al. study (26), by considering α = 0.05, and β (power) = 0.90, considering continuity correction, the sample size of 136 was calculated. To increase the precision, we increased the calculated sample size by 50%. The final sample size was 200. To effectively minimize the impact of confounding variables in our study, we implemented a blinding process for both the data analyst and the data collector. This means that neither individual had any knowledge of the participants' group assignments, preventing any potential bias in data interpretation or collection. Furthermore, we made a deliberate decision to limit the number of participants in the study to ensure a more manageable and controlled environment. This approach allowed us to focus on collecting high-quality data, which is critical for drawing reliable conclusions. In addition to these measures, we applied robust statistical methods throughout our analysis. These methods are designed specifically to account for and mitigate the influence of confounding variables, enhancing the validity of our results and allowing for more accurate interpretations of the data collected. The statistical analysis was conducted using SPSS version 20. A descriptive analysis of the data was performed. Qualitative variables were reported as frequencies and percentages, while quantitative variables were displayed as means and standard deviations. We performed Shapiro-Wilk test to assess the normal distribution. If the data were normally distributed, we performed an independent t-test to compare the difference of variables between the two groups. Otherwise, Mann-Whitney U test was performed. To evaluate the accuracy of forecasting surgery complications, we used the ROC curve. A P-value less than 0.05 was considered statistically significant.
4. Results
Two hundred patients were accidentally chosen and included in the study, out of which 100 (50%) were females. 120 (60%) of the patients were aged over 50 years. More than 80% of the patients had a BMI below 35. The American Society of Anesthesiologists (ASA) I classification applied to over 60% of the patients, while only 36 cases were categorized as ASA II. About half of the patients had coexisting diseases, such as diabetes and chronic obstructive pulmonary disease (COPD). Eighteen (8.5%) patients suffered from diabetes, while ten patients (5%) had COPD. Less than two-thirds of patients stated no habitual history. After evaluating patients by Mallampati score, it was revealed that 170 (85%) patients were class I and II, thus predicted to have easy intubation. The patients were evaluated based on their responses to the STOP-Bang Questionnaire, which resulted in categorizing them into two groups: Low-risk and high-risk. The classification details can be found in Table 1.
Table 1.Patients' Classifications Based on the STOP-Bang Questionnaire
| STOP-Bang Questionnaire | Frequency (%) |
|---|---|
| Low risk (scored < 3) | 125 (62.5) |
| High risk (scored > 3) | 75 (37.5) |
In Table 1, more than half of the patients were classified as low-risk. After conducting the Shapiro-Wilk test, it was revealed that all the assessed variables had a normal distribution. There were statistically significant differences in age, BMI, smoking, and Mallampati score between the two groups (P-values of 0.001, 0.001, 0.037, and 0.001, respectively). These variables were significantly higher in the high-risk group. We have recorded the postoperative complications that occurred in the recovery room. The frequency, percentage, and resulting P-value for the comparison between the two groups are presented in Table 2.
Table 2.Frequency (Percentage) and Resultant P-Value of Comparison Between Two Groups in the Recovery Room a
| Complications | Low-Risk | High-Risk | Total | P-Value |
|---|---|---|---|---|
| Airway obstruction | 16 (12.8) | 29 (38.7) | 45 (22.5) | < 0.001 |
| Need for nasal/oral airway | 13 (10.4) | 24 (32.0) | 37 (18.5) | < 0.001 |
| Need for jaw thrust | 3 (2.4) | 1 (1.3) | 4 (2.0) | > 0.999 |
| Reintubation | 0 (0.0) | 4 (5.3) | 4 (2.0) | 0.019 |
| Hypoxia | 11 (8.8) | 25 (33.3) | 36 (18.0) | < 0.001 |
| Mild/moderate hypoxia | 11 (8.8) | 22 (29.3) | 33 (16.5) | < 0.001 |
| Severe hypoxia | 0 (0.0) | 3 (4.0) | 3 (1.5) | 0.005 |
| Tachypnea > 20/min | 0 (0.0) | 2 (2.7) | 2 (1.0) | 0.139 |
| Complaint of difficulty in breathing or swallowing | 4 (3.2) | 10 (13.3) | 14 (7.0) | 0.007 |
| Hypotension | 2 (1.6) | 6 (8.0) | 8 (4.0) | 0.054 |
| Myocardial infarction | 0 (0.0) | 0 (0.0) | 0 (0.0) | NS |
| New onset atrial fibrillation | 0 (0.0) | 0 (0.0) | 0 (0.0) | NS |
Abbreviation: NS, not significant.
a Values are expressed as No. (%).
None of our cases had new-onset atrial fibrillation or myocardial infarction. Even though the high-risk group had a higher incidence of hypotension, this difference was not statistically significant. The high-risk group had a significantly higher incidence of airway obstruction. As a result, more patients in this group required nasal or oral airways. Additionally, the number of patients who required reintubation was higher in the high-risk group. Four patients in the high-risk group needed reintubation, while none in the low-risk group required it. Significantly, more patients in the high-risk group experienced hypoxia. Nearly one-third of high-risk patients had mild to moderate hypoxia, while only 8.8% of patients in the low-risk group experienced mild to moderate hypoxia. Although there was no significant difference in the rate of tachypnea between the two groups, patients in the high-risk group reported more difficulty in swallowing or breathing. Additionally, the high-risk group had a significantly longer hospitalization period (with a P-value of < 0.001) and a longer stay in the neurosurgery ICU. The details of the length of stay in the ICU and recovery room can be found in Table 3.
Table 3.Summarizes the Details of the Length of Stay in the Intensive Care Unit and Recovery Room a
| Length of Hospitalization | Low-Risk | High-Risk | Total | P-Value |
|---|---|---|---|---|
| Recovery time (min) | 75.32 ± 32.86 | 101.80 ± 42.12 | 85.25 ± 38.70 | < 0.001 |
| Recovery time [median (min - max)] | 60 (50 - 90) | 100 (60 - 120) | 90 (60 - 100) | < 0.001 |
| ICU length of hospitalization (days) | 1.72 ± 0.80 | 2.80 ± 1.30 | 2.12 ± 1.14 | < 0.001 |
Abbreviation: ICU, intensive care unit.
a Values are presented as mean ± SD unless otherwise indicated.
After analyzing the ROC curve, we found that the STOP-Bang Questionnaire could successfully predict airway obstruction with a P-value of less than 0.001 and a diagnostic power of 70.2% (60.7 - 79.6). Moreover, we identified the effective cut-off for airway obstruction prediction in the STOP-Bang Questionnaire. Table 4 presents the determined cut-off sensitivity and specificity. According to our findings, the cut-off points of more than two in the STOP-Bang Questionnaire displayed high sensitivity and specificity in predicting airway obstruction as well as any complaints regarding difficulty in swallowing or breathing.
Table 4.Sensitivity and Specificity of the Determined Cut-Off Point of the STOP-Bang Questionnaire
| Variables | The Cut-Off Points of STOP-Bang Questionnaire | Sensitivity | Specificity |
|---|---|---|---|
| Airway obstruction | > 2 | 0.64 | 0.7 |
| Nasal/oral airway | > 2 | 0.65 | 0.69 |
| Reintubation | > 2 | 1 | 0.64 |
| Hypoxia | > 2 | 0.69 | 0.7 |
| Complaint of difficulty in breathing or swallowing | > 2 | 0.71 | 0.65 |
Table 4 showed that the STOP-Bang Questionnaire's cut-off points greater than two had high sensitivity and specificity in predicting airway obstruction and difficulty swallowing or breathing. Figure 1 shows the ROC curve of STOP-Bang for airway obstruction, the need to use oral/nasal airways, the need for reintubation, and the incidence of complaints of difficulty in breathing or swallowing.
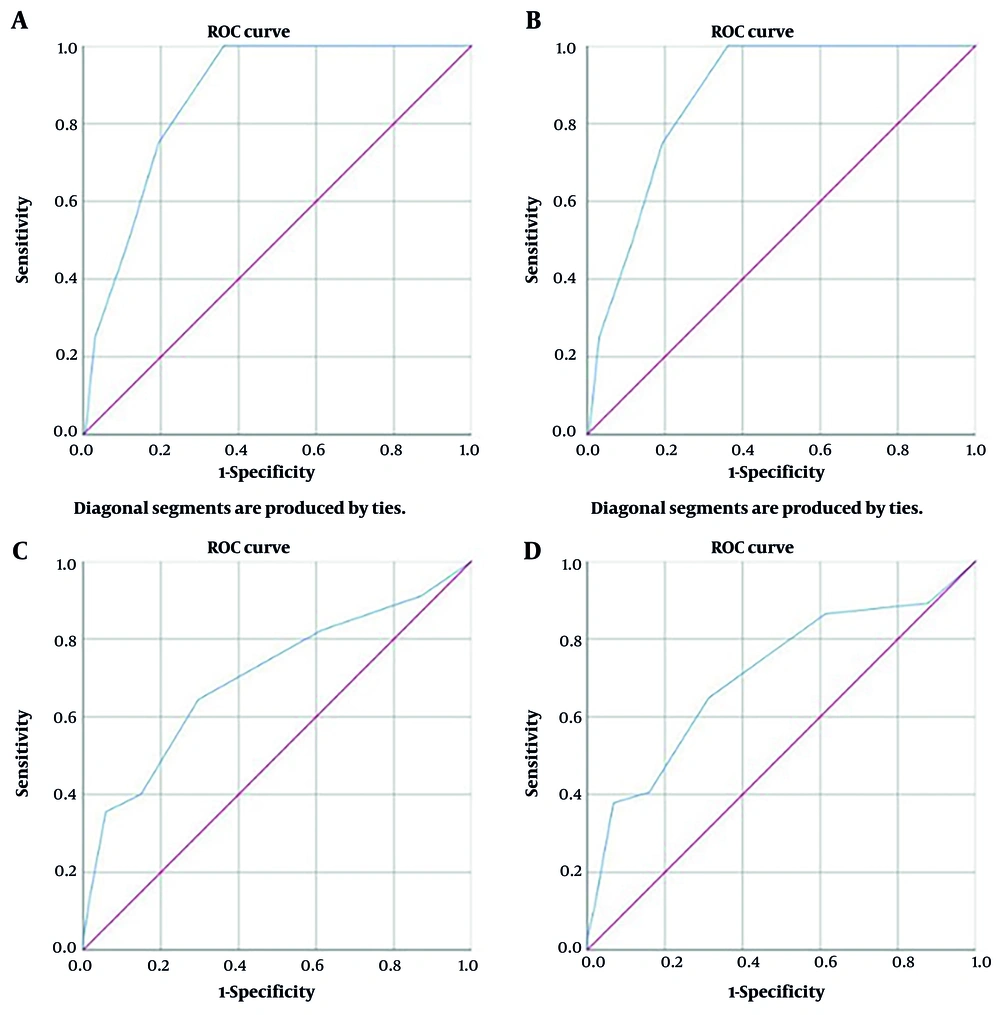
Figure 1.
Depicts the ROC Curve of STOP-Bang for A, predicting airway obstruction; B, use of oral/nasal airway; C, need for reintubation; and D, incidence of difficulty in breathing or swallowing
5. Discussion
We investigated patients who underwent a supratentorial craniotomy. Our objective was to evaluate the ability of the STOP-Bang Questionnaire to predict postoperative respiratory and airway complications. Furthermore, we established a cutoff in the STOP-Bang Questionnaire to predict airway obstruction and difficulty swallowing or breathing. It is known that OSA increases the risk of various postoperative complications like hypoxia, and respiratory, cardiac, and neurologic complications. Therefore, early diagnosis and treatment of OSA are crucial in reducing postoperative complications (27, 28). The STOP-Bang Questionnaire is a simple and easy self-reported questionnaire that was developed to screen OSA in perioperative patients (29). The effectiveness of the STOP-Bang Questionnaire was validated in different studies (29-33). In a study by Chung et al., a STOP-Bang score greater than 3 had a 93% sensitivity in predicting moderate to severe OSA and 100% sensitivity for severe OSA (30). Waseem et al. conducted a multi-center study involving 1205 patients from four different nationalities (Chinese, Malay, Indian, and Caucasian) who had cardiovascular risks and underwent major non-cardiac surgeries. All the patients were assessed using the STOP-Bang Questionnaire. After adjusting for sensitivity and specificity, the optimal threshold of the STOP-Bang Questionnaire for diagnosis of moderate to severe OSA was found to be four (34). According to a systematic review and meta-analysis of studies involving the general population, it was found that a STOP-Bang Questionnaire score higher than three helps detect OSA (35). All mentioned studies demonstrated that the STOP-Bang Questionnaire can accurately detect OSA.
Our survey found that individuals in the high-risk group, as determined by the STOP-Bang Questionnaire, had significantly higher rates of airway obstruction, hypoxia, and difficulty in swallowing and breathing. In a study conducted by Xara et al., early postoperative complications following general anesthesia were assessed. The study was conducted on 59 pairs of patients who were divided into two groups of high-risk and low-risk patients based on the STOP-Bang Questionnaire. The high-risk group consisted of patients with a score of three or higher on the STOP-Bang Questionnaire who also had OSA. The study found that these high-risk patients experienced more frequent respiratory adverse events, such as mild to moderate hypoxia and an inability to breathe deeply (36). Likewise, Vasu et al. conducted a study on 135 patients. Twelve patients in their study had respiratory and cardiac complications. Eleven of these complications happened in the high-risk group, while only one patient in the low-risk group had pneumonia. They concluded that patients who scored three or higher on the STOP-Bang Questionnaire had more postoperative complications (26). The study found consistent results in patients who underwent cardiac surgery. After assessing 306 patients, it was discovered that those classified as high-risk according to the STOP-Bang Questionnaire experienced more cardiac, respiratory, and neurological complications (37).
In contrast to previous studies and our findings, Wong et al. found no significant association between postoperative outcomes and the STOP-Bang Questionnaire score (38). Similarly, Sangkum et al. also found no associations between postoperative adverse events and the STOP-Bang Questionnaire score (39). In conclusion, more studies have demonstrated that the incidence of complications is higher in patients identified as high-risk by the STOP-Bang Questionnaire. In a study conducted by Seet et al., the focus was on patients over 45 years old undergoing non-cardiac surgeries. The objective was to evaluate the effectiveness of the STOP-Bang Questionnaire in predicting difficult airway cases. The distribution of high and low-risk patients based on the STOP-Bang Questionnaire was found to be similar to our results. The researchers concluded that a STOP-Bang Questionnaire score of more than three could indicate a difficult intubation (40). Sangkum et al. found that a STOP-Bang Questionnaire score of more than three accurately predicted difficult ventilation (39). In our study, a STOP-Bang score of more than two was associated with airway obstruction, reintubation, and difficulty in swallowing or breathing. We also discovered that high-risk patients according to the STOP-Bang Questionnaire had higher Mallampati scores, indicating difficult intubation. This difference between our cutoff and other studies may be because the study focused on individuals who were candidates for craniotomy. In addition, we demonstrated that patients with a higher risk had a lengthier hospital stay during their recovery and stay in the neurosurgical ICU. Similarly, Caplan et al. conducted two studies to examine patients who underwent supratentorial craniotomy. The results from both studies revealed that the STOP-Bang Questionnaire is a reliable method of predicting 30-day readmission, emergency department visits, and the risk of readmission within 30 days (21, 41). Lockhart et al. evaluated 14962 patients of whom 1939 reported a positive history of OSA. Despite our results, they showed that a history of OSA or a high score of STOP-Bang was associated with shorter hospital stays (42). This result is in contrast to our results. Besides, they showed that patients with a positive OSA history had longer ICU stays. However, this difference was insignificant between the low and high-risk groups (42). This finding was consistent with our results. Nevertheless, in our patients, this difference was significant. Furthermore, Lockhart et al. found that the one-year mortality rate was higher in high-risk patients according to the STOP-Bang Questionnaire (42). Unfortunately, in our study, we only followed patients for a short time. So, we are unable to determine the one-year mortality.
5.1. Limitations
This survey was carried out at a single center, which may limit the generalizability of the findings. To obtain more precise and comprehensive results concerning the rate of complications, it is essential to conduct a multi-center study. Such a study should involve a larger cohort of patients and include extended follow-up periods. This approach would allow for a better understanding of the complications across diverse populations and healthcare settings, ultimately enhancing the reliability of the outcomes.
5.2. Conclusions
In summary, our research showed that patients at high risk, according to the STOP-Bang Questionnaire, are more likely to experience respiratory and airway issues following surgery. Furthermore, those who score two or higher on the STOP-Bang test are prone to developing breathing difficulties, swallowing problems, and airway obstruction. Therefore, this test is valuable for identifying post-surgery complications.

