


1. Background
2. Objectives
3. Methods
3.1. Statistical Analysis
4. Results
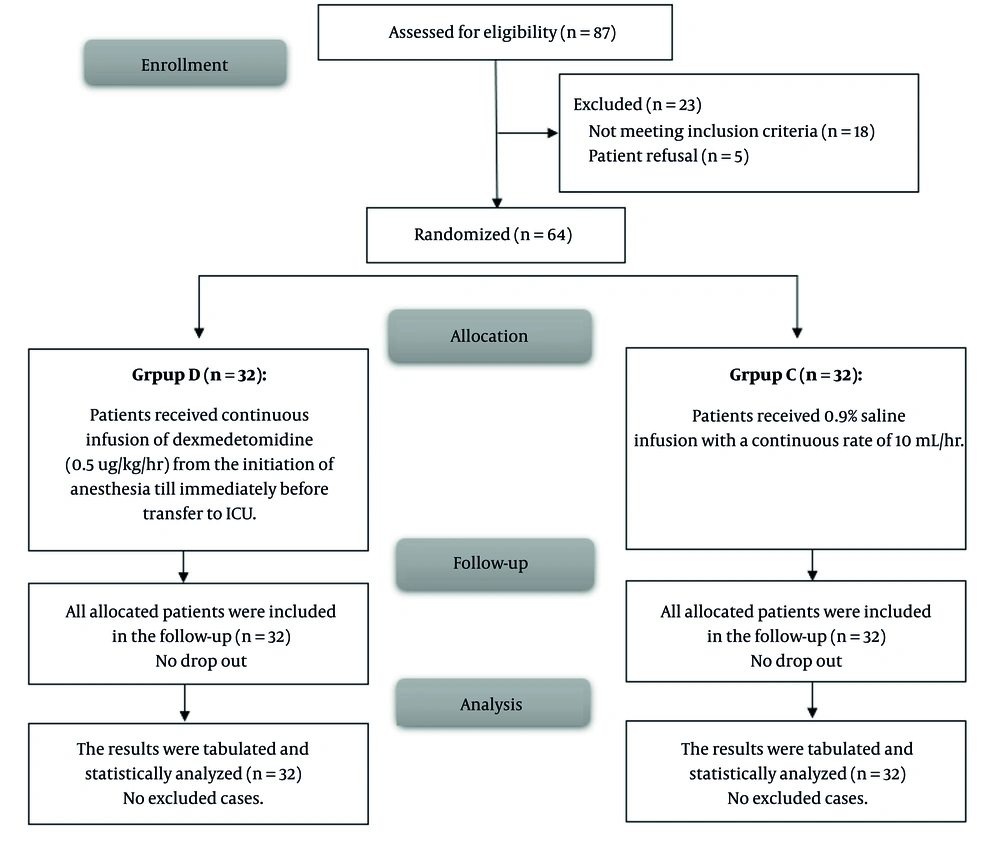
CONSORT flowchart of the included patients
| Variables | Group D (n = 32) | Group C (n = 32) | P-Value |
|---|---|---|---|
| Age (y) | 48.78 ± 14.82 | 49.75 ± 15.91 | 0.802 |
| Sex | 0.424 | ||
| Male | 23 (71.88) | 20 (62.5) | |
| Female | 9 (28.13) | 12 (37.5) | |
| Weight (kg) | 71.25 ± 11.22 | 72.38 ± 12.08 | 0.701 |
| Height (m) | 1.66 ± 0.08 | 1.68 ± 0.08 | 0.216 |
| BMI (kg/m2) | 26.07 ± 4.95 | 25.62 ± 4.67 | 0.712 |
| Duration of surgery (h) | 4.69 ± 1.71 | 4.88 ± 1.41 | 0.634 |
| Duration of CPB (min) | 62.56 ± 22.14 | 63.81 ± 22.34 | 0.823 |
Abbreviations: BMI, Body Mass Index; CPB, cardiopulmonary bypass.
a Values are expressed as No. (%) or mean ± SD.
b Age, sex, weight, height, BMI, duration of surgery and duration of CPB were insignificantly different between both groups.
| Variables b | Group D (n = 32) | Group C (n = 32) | P-Value |
|---|---|---|---|
| T0 | 72.72 ± 11.69 | 74.25 ± 9.37 | 0.565 |
| T1 | 69.31 ± 12.16 | 75.72 ± 9.42 | 0.022 c |
| T2 | 66.75 ± 12.34 | 75.16 ± 9.72 | 0.004 c |
| T3 | 65.13 ± 12.27 | 74.78 ± 9.93 | 0.001 c |
| T4 | 63.00 ± 11.41 | 76.78 ± 10.82 | < 0.001 c |
| T5 | 69.56 ± 11.82 | 75.19 ± 9.33 | 0.039 c |
| After 4 hours at the ICU | 71.38 ± 11.28 | 77.50 ± 9.17 | 0.020 c |
Abbreviation: ICU, intensive care unit.
a Values are expressed as mean ± SD.
b T0, before induction; T1, 3 minutes following skin incision; T2, 3 minutes following sternotomy; T3, before going on CPB; T4, 15 minutes after weaning from CPB; T5, immediately after transfer to ICU.
c A P-value ≤ 0.05 is considered statistically significant.
| Variables b | Group D (n = 32) | Group C (n = 32) | P-Value |
|---|---|---|---|
| T0 | 96.56 ± 18.82 | 91.81 ± 16.68 | 0.289 |
| T1 | 85.78 ± 16.59 | 94.94 ± 18.86 | 0.043 c |
| T2 | 87.28 ± 19.36 | 98.09 ± 17.46 | 0.022 c |
| T3 | 87.66 ± 19.35 | 97.09 ± 16.55 | 0.040 c |
| T4 | 86.53 ± 18.93 | 101.84 ± 16.58 | 0.001 c |
| T5 | 88.47 ± 18.67 | 98.72 ± 16.54 | 0.023 c |
| After 4 hours at the ICU | 91.22 ± 18.62 | 100.94 ± 16.79 | 0.032 c |
Abbreviation: ICU, intensive care unit.
a Values are expressed as mean ± SD.
b T0, before induction; T1, 3 minutes following skin incision; T2, 3 minutes following sternotomy; T3, before going on CPB; T4, 15 minutes after weaning from CPB; T5, immediately after transfer to ICU.
c A P-value ≤ 0.05 is considered statistically significant.
Abbreviation: ICU, intensive care unit.
a Values are expressed as mean ± SD.
b T0, before induction; T1, 3 minutes following skin incision; T2, 3 minutes following sternotomy; T3, before going on CPB; T4, 15 minutes after weaning from CPB; T5, immediately after transfer to ICU.
c A P-value ≤ 0.05 is considered statistically significant.
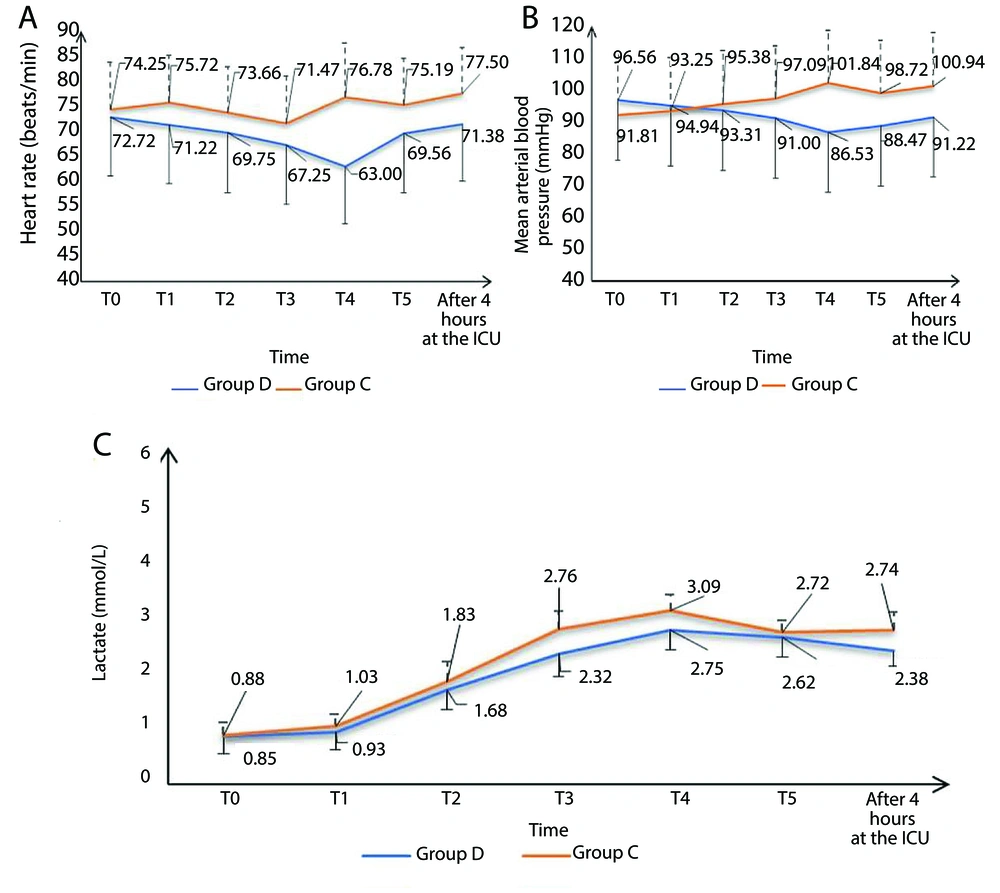
A, heart rate (HR); B, mean arterial pressure (MAP) and C, lactate of the studied groups
| Variables | Group D (n = 32) | Group C (n = 32) | P-Value |
|---|---|---|---|
| Pre bypass | 56.94 ± 9.3 | 54.41 ± 9.6 | 0.289 |
| Post bypass | 60.22 ± 9.1 | 58.38 ± 9.8 | 0.440 |
| Post-surgery | 59.06 ± 7.4 | 54.84 ± 8.9 | 0.043 b |
a Values are expressed as mean ± SD.
b A P-value ≤ 0.05 is considered statistically significant.
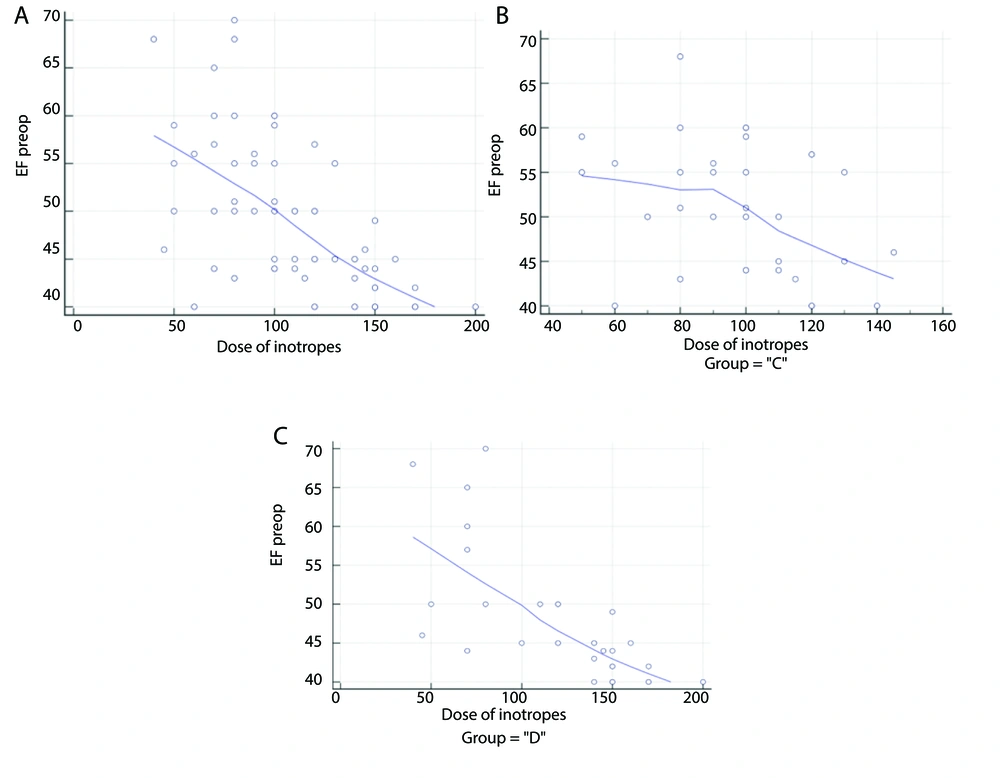
Correlation curves between dosage of inotropes and ejection fraction % (EF%). A, moderate negative correlation between dosage o finotropes and EF% among the 2 groups; B, weak negative correlation between dosage of inotropes and EF% among group C; C, strong negartive correlation between dosage of inotropes and EF% among group D.
| Variables | Group D (n = 32) | Group C (n = 32) | P-Value |
|---|---|---|---|
| Dose of inotropes (mic/min) | 6412.5 ± 1010.25 (5040 - 7830) | 4342.5 ± 724.78 (3120 - 5520) | < 0.001 b |
| Dose of narcotics (mic) | 285 ± 44.9 (224 - 348) | 361.88 ± 60.4 (260 - 460) | < 0.001 b |
| Need for pacemaker; No. (%) | 0.554 | ||
| Yes | 1 (3.13) | 2 (6.25) | |
| No | 31 (96.88) | 30 (93.75) | |
| Mechanical ventilation (h) | 25.31 ± 22.54 (4 - 110) | 30.63 ± 24.42 (10 - 122) | 0.369 |
a Values are expressed as mean ± SD (range) unless otherwise indicated.
b A P-value ≤ 0.05 is considered statistically significant.
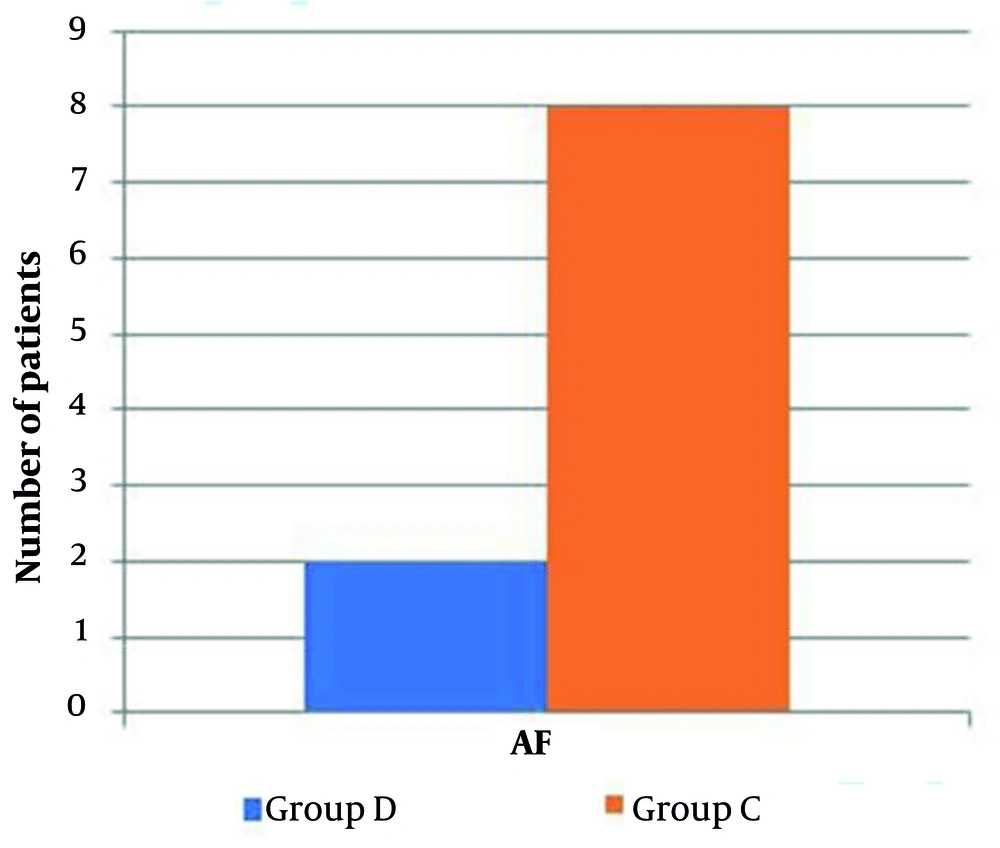
Incidence of AF in the studied group
Abbreviation: ICU, intensive care unit.
a Mann-Whitney test.
b A P-value ≤ 0.05 is considered statistically significant.

