
1. Background
Minimally invasive surgical techniques are increasingly favored, leading to renewed interest in thoracoscopy among thoracic surgeons. Over the past twenty years, video-assisted thoracic surgery (VATS) has been adopted for numerous conditions traditionally treated via open thoracotomy (1). Although VATS can lessen postoperative pain compared to open procedures, pain continues to be a significant difficulty for patients (2, 3). A key component of multimodal analgesia is regional analgesic methods, which provide better pain management than systemic opioids alone and can lessen opioid-related adverse effects by reducing total intake (4, 5). Multimodal analgesia, a key component of enhanced recovery regimens, blends opioids and nonopioid drugs (6). The serratus anterior plane block (SAPB) is a recognized element of multimodal analgesia following video-assisted thoracoscopic surgery (VATS). Numerous studies have confirmed its efficacy, and it is renowned for its safety and technical simplicity when compared to epidural or paravertebral blocks (7). A more recent innovation, the erector spinae plane block (ESPB), was introduced in 2016 and has rapidly gained popularity in regional anesthesia for thoracic surgery. ESPB is theorized to block both the dorsal and ventral rami of the thoracic spinal nerves, providing more comprehensive somatic and visceral analgesia (8). However, there is a lack of substantial clinical evidence directly comparing the analgesic efficacy of SAPB and ESPB in the VATS setting. A recent study by Taha et al. (9) compared these blocks, but differences in methodology and outcomes warrant further investigation.
2. Objectives
We conducted this randomized controlled trial to assess whether ESPB provides superior analgesia, as evidenced by reduced 24-hour opioid consumption, compared to SAPB in patients undergoing VATS.
3. Methods
3.1. Study Design and Setting
This was a prospective, randomized, open-label, blinded-endpoint (PROBE) study conducted at a single university hospital. The study protocol was approved by the Institutional Review Board of Ain Shams University (Protocol Record FMASU MS145/2025) and registered at ClinicalTrials.gov (Identifier: NCT06996691). Written informed consent was obtained from all participants before any study-related procedures.
3.2. Study Population
Between March 2025 and September 2025, adult patients (aged 18 - 75 years) with American Society of Anesthesiologists (ASA) physical status I-III who were scheduled for elective VATS were screened for eligibility.
3.2.1. Inclusion Criteria
American Society of Anesthesiologists I-III patients scheduled for elective VATS.
3.2.2. Exclusion Criteria
• Bleeding disorders or coagulopathy
• Known allergy to local anesthetics
• Infection at the potential injection site
• History of chronic opioid use or opioid abuse
• Sepsis or systemic infection
• Pre-existing neurological or spinal diseases
• Pregnancy or lactation
• Pre-existing renal impairment (creatinine clearance < 30 mL/min)
• Inability to provide informed consent
3.3. Sample Size Calculation
The sample size was calculated using PASS® software (version 15). Based on a previous study by Taha et al. (9), which reported total 24-hour meperidine consumption of 58.5 ± 10.5 mg in the SAPB group and 41.5 ± 8.5 mg in the ESPB group, a sample size of 18 patients per group was required to detect a difference with 90% power and an alpha error of 0.05. To account for potential dropouts and exclusions, we planned to enroll 30 patients per group (60 total). The study was powered for the primary outcome (24-hour opioid consumption) only and was not powered to detect differences in secondary outcomes such as pain scores or adverse events.
3.4. Patient Flow and Randomization
A total of 75 patients were assessed for eligibility. Fifteen patients were excluded (10 did not meet inclusion criteria, and 5 declined participation). The remaining 60 patients were randomized into two equal groups (30 per group) using computer-generated random numbers with allocation concealed in sealed opaque envelopes.
3.5. Blinding
Due to the nature of the intervention, performing anesthesiologists and patients were not blinded. However, the study employed a PROBE design: Postoperative data collection (pain scores and opioid consumption) was performed by research nurses who were blinded to group allocation.
3.6. Interventions
3.6.1. Anesthetic Management
All patients received standardized general anesthesia. Premedication consisted of midazolam 0.05 mg/kg IV. Standard monitoring included electrocardiography, non-invasive blood pressure, pulse oximetry, capnography, and Bispectral Index (BIS™, Medtronic) for depth of anesthesia monitoring with a target BIS value of 40 - 60. Anesthesia was induced with fentanyl 2 µg/kg, propofol 2 mg/kg, and rocuronium 0.6 mg/kg. Anesthesia was maintained with sevoflurane (1 - 1.5 MAC) in an oxygen-air mixture.
3.6.2. Regional Blocks
Prior to surgical incision, patients received ultrasound-guided regional blocks according to group allocation:
Group ESPB: With the patient in the lateral decubitus position, a high-frequency linear ultrasound probe was placed longitudinally 3 cm lateral to the T5 spinous process. The erector spinae muscle was identified superficial to the transverse process. Using an in-plane technique, a 22-gauge 80-mm needle was advanced until the tip was positioned deep to the erector spinae muscle and superficial to the transverse process. After negative aspiration, 30 mL of 0.25% bupivacaine was injected with intermittent aspiration. Correct spread was confirmed by hydrodissection of the fascial plane.
Group SAPB: With the patient in the supine position with the ipsilateral arm abducted, a high-frequency linear ultrasound probe was placed in the mid-axillary line at the level of the 5th rib. The latissimus dorsi, serratus anterior muscles, and rib were identified. Using an in-plane technique, a 22-gauge 80-mm needle was advanced until the tip was positioned in the fascial plane between the serratus anterior and latissimus dorsi muscles. After negative aspiration, 30 mL of 0.25% bupivacaine was injected with intermittent aspiration. Correct spread was confirmed by hydrodissection of the fascial plane.
All blocks were performed by consultant anesthesiologists with over five years of experience in ultrasound-guided regional anesthesia. Due to the pre-induction timing and to avoid patient distress, formal dermatomal sensory testing was not performed. Block success was therefore defined by appropriate ultrasound visualization of local anesthetic spread within the target fascial plane.
In the ESPB group, 8 patients did not receive the allocated block due to hypotension after induction (systolic blood pressure < 90 mmHg) that was unresponsive to fluid resuscitation and required vasopressor support, making block performance unsafe. In the SAPB group, 7 patients did not receive the allocated block for the same reason.
3.7. Postoperative Analgesia Protocol
Postoperatively, all patients were transferred to the intensive care unit (ICU). A standardized multimodal analgesic protocol was implemented for all patients:
• IV ketorolac 30 mg every 8 hours (contraindicated in patients with renal impairment or bleeding risk)
• IV paracetamol 1 g every 6 hours
Rescue analgesia followed a standardized institutional protocol for post-thoracoscopic pain: Intravenous meperidine (0.5 mg/kg) was administered when the Numerical Rating Scale (NRS) pain score exceeded 4.
3.8. Outcomes
3.8.1. Primary Outcome
Total meperidine consumption (mg) over the first 24 hours postoperatively.
3.8.2. Secondary Outcomes
1. Intraoperative fentanyl consumption (µg)
2. Postoperative pain scores assessed using:
• Numerical Rating Scale (NRS, 0 - 10) at 1, 2, 4, 8, 16, and 24 hours postoperatively
• Visual Analog Scale (VAS, 0 - 10) at the same time points (both scales were used to enhance robustness of pain measurement)
3. Time to first analgesic request
4. Incidence of adverse events including:
• Hypotension (systolic blood pressure < 90 mmHg or decrease >30% from baseline)
• Bradycardia (heart rate < 50 beats per minute)
• Postoperative nausea and vomiting (PONV)
• Respiratory depression (respiratory rate < 8 breaths per minute or SpO₂ < 90% on room air)
• Block-related complications (local anesthetic systemic toxicity, hematoma, infection)
3.9. Data Collection and Follow-up
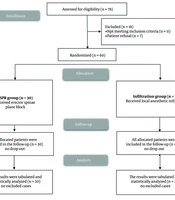
Postoperative data were collected by research nurses blinded to group allocation. Patients were followed for 24 hours postoperatively. During follow-up, 2 patients in the ESPB group and 3 patients in the SAPB group were lost to follow-up due to early discharge against medical advice. The final analysis included 20 patients in each group who received the allocated intervention and completed follow-up (per-protocol analysis) (Figure 1).
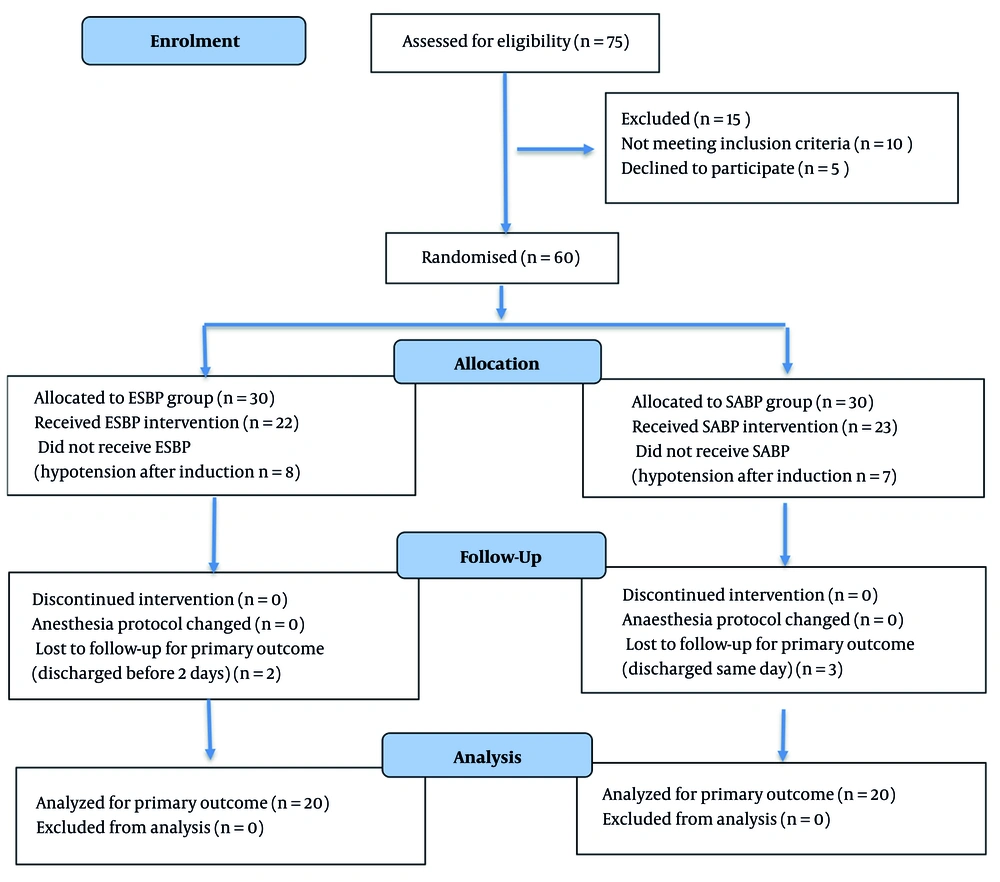
Figure 1.
CONSORT flow diagram of patient enrollment and allocation; this diagram outlines the flow of participants through each stage of the randomized controlled trial, including enrollment, intervention allocation, follow-up, and data analysis. Abbreviations: ESPB, Erector spinae plane block; SAPB, serratus anterior plane block.
3.10. Statistical Analysis
Statistical analysis was conducted using IBM SPSS Statistics for Windows, Version 26.0. The Shapiro-Wilk test was used to assess normality of continuous data. Based on this analysis, primary and secondary outcome data (opioid consumption, pain scores) were found to be non-normally distributed. Therefore, these data are presented as median (interquartile range, IQR) and were analyzed using the Mann-Whitney U test. Categorical data are presented as numbers (percentages) and analyzed using the Chi-square test or Fisher's exact test, as appropriate. The time to first analgesic request was analyzed using the Kaplan-Meier method and compared using the Log-rank test. A P-value of less than 0.05 was considered statistically significant. Given the post-randomization exclusions and loss to follow-up, the primary analysis was conducted on a per-protocol basis, including only patients who received the allocated intervention and completed follow-up. Sensitivity analyses were not performed due to the small number of excluded patients in each group.
4. Results
4.1. Patient Characteristics
Forty patients were randomized (20 per group). The groups were similar in baseline demographic and clinical characteristics (Table 1).
Table 1.
Baseline Demographic and Clinical Characteristics of the Study Population a
| Demographic & Clinical Data | ESPB Group (n = 20) | SAPB Group (n = 20) | P-Value |
|---|---|---|---|
| Age (y) | 47.55 ± 16.83 | 42.35 ± 20.22 | 0.382 |
| Sex, male | 14 (70.0) | 12 (60.0) | 0.740 |
| ASA I | 6 (30.0) | 8 (40.0) | 0.138 b |
| ASA II | 9 (45.0) | 3 (15.0) | |
| ASA III | 5 (25.0) | 8 (40.0) | |
| Weight (kg) | 74.65 ± 16.48 | 66.50 ± 11.49 | 0.078 |
| Height (cm) | 166.00 ± 8.32 | 163.25 ± 5.70 | 0.230 |
| BMI | 27.08 ± 5.51 | 25.02 ± 4.59 | 0.207 |
| Lung cancer | 4 (20.0) | 3 (15.0) | 1.000 |
| Non-cancerous lung diseases | 3 (15.0) | 2 (10.0) | 1.000 |
| Pleural diseases | 5 (25.0) | 6 (30.0) | 1.000 |
| Thymic diseases | 1 (5.0) | 3 (15.0) | 0.605 |
| Autoimmune diseases | 0 (0.0) | 1 (5.0) | 1.000 |
| Inflammatory diseases | 1 (5.0) | 2 (10.0) | 1.000 |
| Other diseases | 6 (30.0) | 3 (15.0) | 0.449 |
Abbreviations: ESPB, erector spinae plane block; SAPB, serratus anterior plane block.
a Values are presented as mean ± SD or No. (%).
b Overall p-value for ASA distribution (I vs. II vs. III) using Fisher’s exact test.
4.2. Intraoperative and Postoperative Outcomes
Intraoperative fentanyl consumption was significantly lower in the ESPB group (median 50 µg, IQR 50 - 50) compared to the SAPB group (median 80 µg, IQR 75 - 95; P < 0.001) (Table 2).
Table 2.
Intraoperative Fentanyl Consumption
| Fentanyl Consumption (µg) | ESPB Group (n = 20) | SAPB Group (n = 20) | P-Value |
|---|---|---|---|
| Median (IQR) | 50 (50 - 50) | 80 (75 - 95) | < 0.001 |
Postoperative pain scores are shown in Table 3. Numerical Rating Scale scores were significantly lower in the ESPB group at 2, 4, and 8 hours (all P < 0.05). Visual Analog Scale (VAS) scores were significantly lower in the ESPB group at 4, 8, 16, and 24 hours (all P < 0.05) (Table 3 and Figure 2).
Table 3.
Postoperative Numerical Rating Scale and Visual Analog Scale Scores
| Scale and Timepoint | ESPB Group (n = 20) | SAPB Group (n = 20) | P-Value |
|---|---|---|---|
| NRS (hr) | |||
| 1 | 4 (2 - 6) | 5 (4 - 6) | 0.341 |
| 2 | 2 (2 - 4) | 3 (2 - 4) | 0.031 |
| 4 | 1 (0 - 2) | 2 (2 - 4) | 0.040 |
| 8 | 0 (0 - 2) | 2 (0 - 3) | 0.020 |
| 16 | 0 (0 - 0) | 0 (0 - 2) | 0.192 |
| 24 | 0 (0 - 0) | 0 (0 - 0) | 0.289 |
| VAS (hr) | |||
| 1 | 4 (2 - 5) | 4 (4 - 6) | 0.315 |
| 2 | 3 (2 - 4) | 4 (2 - 5) | 0.274 |
| 4 | 2 (1 - 3) | 2 (2 - 4) | 0.033 |
| 8 | 1 (0 - 2) | 2 (1 - 2) | 0.012 |
| 16 | 0 (0 - 0) | 0 (0 - 2) | 0.017 |
| 24 | 0 (0 - 0) | 0 (0 - 0) | 0.038 |
Abbreviations: ESPB, erector spinae plane block; SAPB, serratus anterior plane block; NRS, Numerical Rating Scale; VAS, Visual Analog Scale.
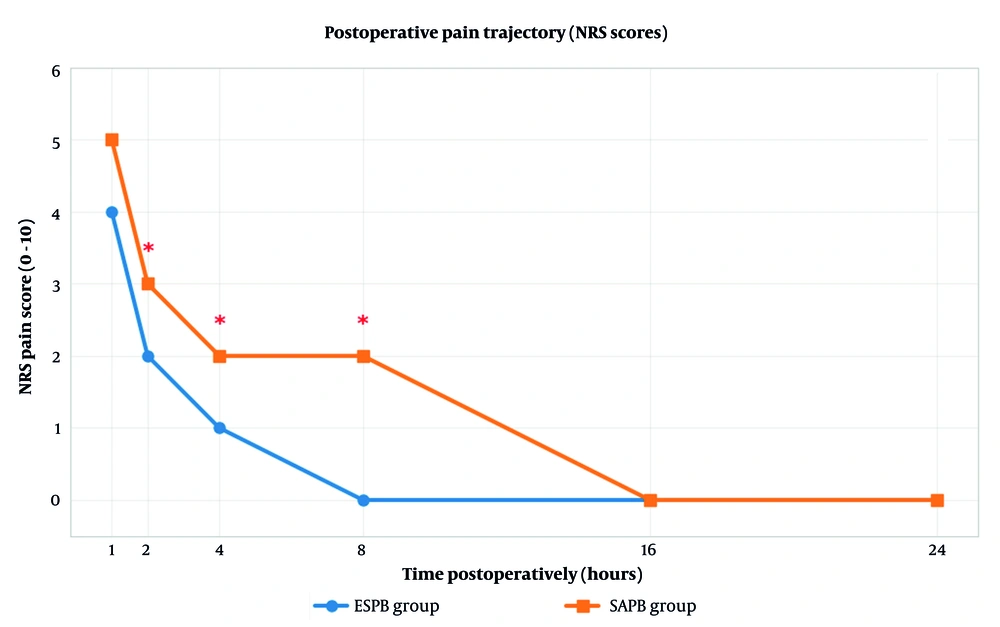
Figure 2.
Trend of postoperative pain scores over time. A line graph shows median Numerical Rating Scale (NRS) pain scores (0 - 10) at various times during the first 24 hours after surgery. The erector spinae plane block (ESPB) group had a more rapid reduction in pain and consistently lower pain levels than the serratus anterior plane block (SAPB) group. Asterisks (*) show times when the groups are significantly different from each other (P < 0.05).
Total 24-hour meperidine consumption was significantly lower in the ESPB group (median 40 mg, IQR 35 - 45) versus the SAPB group (median 80 mg, IQR 70 - 90; P < 0.001) (Table 4 and Figure 3).
Table 4.
Total 24-hour Meperidine Consumption
| Meperidine Consumption (mg) | ESPB Group (n = 20) | SAPB Group (n = 20) | P-Value |
|---|---|---|---|
| Median (IQR) | 40 (35 - 45) | 80 (70 - 90) | < 0.001 |
Abbreviations: ESPB, erector spinae plane block; SAPB, serratus anterior plane block.
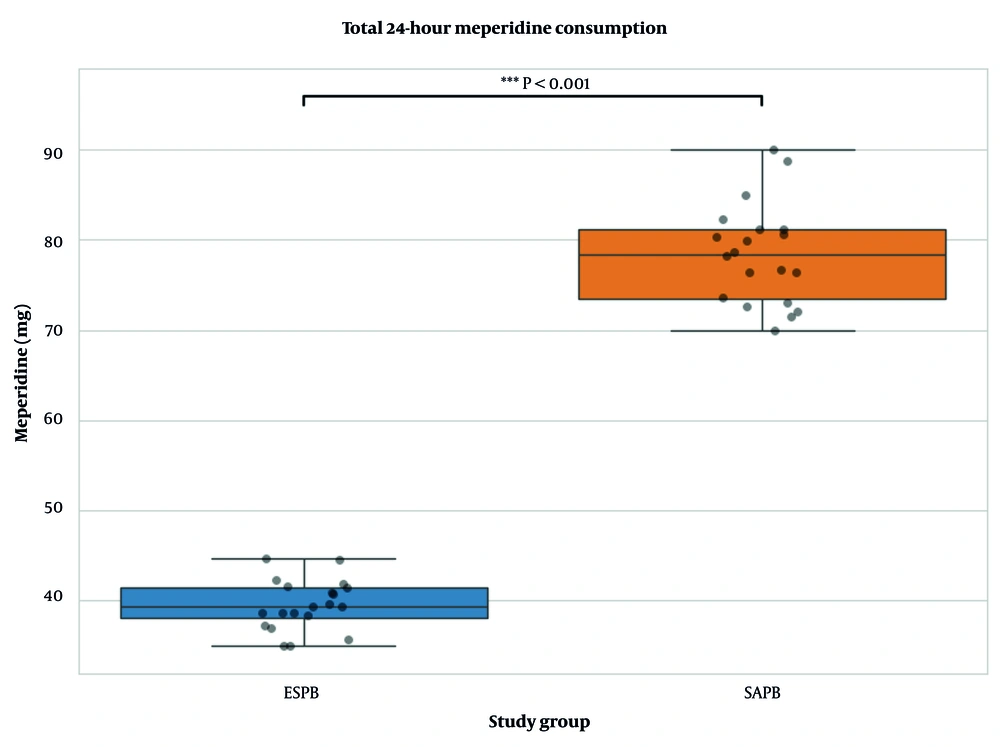
Figure 3.
Comparison of Total 24-hour postoperative meperidine consumption. Box-and-whisker plot demonstrating the total consumption of rescue meperidine (in milligrams) in the first 24 hours post-surgery. The box represents the interquartile range (IQR), the horizontal line within the box indicates the median, and the whiskers extend to the minimum and maximum values. The erector spinae plane block (ESPB) group showed significantly lower consumption than the serratus anterior plane block (SAPB) group. ***P < 0.001, Mann-Whitney U test.
4.3. Adverse Events
No significant differences were observed between groups in the incidence of hypotension, bradycardia, PONV, respiratory depression, or block-related complications (Table 5).
Table 5.
Postoperative Adverse Events a
| Adverse Event | ESPB Group (n = 20) | SAPB Group (n = 20) | P-Value b |
|---|---|---|---|
| Hypotension | 2 (10.0) | 3 (15.0) | 1.000 |
| Bradycardia | 1 (5.0) | 2 (10.0) | 1.000 |
| PONV | 3 (15.0) | 5 (25.0) | 0.695 |
| Respiratory depression | 0 (0.0) | 0 (0.0) | 1.000 |
| Block-related complications | 0 (0.0) | 0 (0.0) | 1.000 |
Abbreviations: ESPB, erector spinae plane block; SAPB, serratus anterior plane block; PONV, postoperative nausea and vomiting.
a Values are presented as No. (%).
b Test used: Fisher's Exact Test.
5. Discussion
This prospective, randomized trial demonstrates that preoperative ultrasound-guided ESPB provides superior postoperative analgesia compared to serratus anterior plane block in patients undergoing VATS. The ESPB group required significantly less intraoperative fentanyl and postoperative meperidine, and reported consistently lower pain scores throughout the 24-hour observation period.
Although VATS is less invasive than open thoracotomy, postoperative pain remains a clinically significant issue. Our findings address a relevant clinical question within enhanced recovery pathways. The observed 50% reduction in 24-hour meperidine consumption with ESPB aligns with the results of Taha et al. (9). This reduction may translate to decreased opioid-related adverse effects, supporting the role of ESPB within enhanced recovery after surgery (ERAS) protocols.
The enhanced analgesia from ESPB may be attributed to its proposed mechanism. Local anesthetic deposited deep to the erector spinae muscle may diffuse ventrally through the costotransverse foramen, potentially blocking both dorsal and ventral rami of thoracic spinal nerves, providing broader somatic and visceral coverage compared to SAPB, which primarily targets lateral cutaneous branches (8, 10).
Our results contribute to a growing but inconsistent evidence base. While some studies, like ours and that of Liu et al. (11), support the efficacy of ESPB, a well-designed multicenter trial by Clairoux et al. (12) found no significant difference between ESPB and a sham block. This heterogeneity underscores the importance of technical execution, patient selection, and surgical factors. The presumed anatomic advantage of ESPB remains theoretical and should be interpreted cautiously until confirmed by imaging or neurophysiological studies.
5.1. Limitations
Our study has several important limitations that must be considered when interpreting the results. First, the open-label design, despite employing a PROBE design with blinded outcome assessors for postoperative data collection, introduces potential performance bias as clinicians administering intraoperative anesthesia and postoperative rescue analgesia were not blinded to group allocation. This could have influenced decisions regarding opioid administration, particularly the use of intraoperative fentanyl based on hemodynamic parameters.
Second, we encountered significant methodological challenges in patient flow. Of the 60 randomized patients, 15 (25%) did not receive their allocated intervention due to post-induction hypotension, and an additional 5 patients (8%) were lost to follow-up due to early discharge. This substantial attrition rate after randomization may introduce selection bias and limit the generalizability of our findings. Furthermore, our per-protocol analysis, while clinically relevant for assessing the efficacy of the blocks in patients who actually received them, may overestimate treatment effects compared to an intention-to-treat approach that would preserve the randomization balance.
Third, block success was confirmed by ultrasound visualization of injectate spread but not by formal dermatomal sensory testing. While ultrasound confirmation is standard practice, the absence of sensory assessment limits our ability to determine whether observed differences in analgesia resulted from variations in block efficacy versus technical execution. Future studies should incorporate objective measures of sensory blockade when ethically and practically feasible.
Fourth, although we used Bispectral Index (BIS) monitoring to ensure adequate depth of anesthesia, intraoperative nociception was guided primarily by hemodynamic parameters rather than dedicated nociception monitors (e.g., Analgesia Nociception Index or Surgical Pleth Index). Hemodynamic responses lack specificity for nociception and may be influenced by factors such as light anesthesia, surgical stimulation, or autonomic instability.
Fifth, pain assessment inherently involves subjective reporting. While we used both Numerical Rating Scale (NRS) and Visual Analog Scale (VAS) scales and employed blinded assessors, patient expectations and the unblinded nature of the intervention may have influenced pain reporting, particularly in the early postoperative period when differences were most pronounced.
Sixth, our use of meperidine as rescue analgesia, while consistent with institutional protocols for post-thoracoscopic pain, limits direct comparability with studies using other opioids such as morphine or hydromorphone. Meperidine's unique pharmacokinetic profile and potential for adverse effects at higher doses or with renal impairment necessitate cautious interpretation of opioid-sparing outcomes.
Seventh, our single-center design and modest final sample size (20 patients per group) limit the external validity of our findings. The study was adequately powered for the primary outcome of opioid consumption but was not powered to detect differences in secondary outcomes such as pain scores at all time points or rare adverse events. Negative safety findings should therefore be interpreted with caution.
Finally, all blocks were performed at specific anatomical landmarks (T5 for ESPB, fifth rib for SAPB) by experienced anesthesiologists. Variations in technique, injectate volume, or operator experience might yield different results, emphasizing the need for standardized protocols in future comparative studies.
Despite these limitations, our study provides valuable preliminary evidence supporting the analgesic superiority of ESPB over SAPB in VATS patients. The consistent findings across multiple pain metrics and opioid consumption endpoints, along with the plausible anatomical rationale for ESPB's broader coverage, strengthen the clinical relevance of our results. However, definitive conclusions require validation through larger, multicenter, double-blind randomized trials with more rigorous methodology and comprehensive follow-up.
5.2. Conclusions
This randomized trial indicates that the ESPB is more effective than the serratus anterior plane block in reducing post-VATS pain, as evidenced by reduced opioid consumption and improved pain scores. These findings, combined with its technical feasibility and safety profile, suggest that ESPB is a valuable regional anesthetic technique for thoracic surgery. However, given the methodological limitations, larger, multicenter, double-blind randomized controlled trials are warranted to confirm these results and definitively establish the role of ESPB within contemporary thoracic enhanced recovery pathways.