


1. Background
Celiac disease, an autoimmune enteropathy, may present with classical or non-classical symptoms in children following gluten exposure (1). The prevalence of celiac disease is approximately 1% in most populations (2), with a similar rate reported in Iran (3). This condition leads to atrophy of the small intestine’s villi, resulting in malabsorption. Consequently, typical symptoms may include diarrhea, issues with weight gain or loss, and bloating. Non-classical symptoms can encompass chronic fatigue, anemia, delayed puberty, dermatitis herpetiformis, liver dysfunction, constipation, and other manifestations (4). These symptoms are often non-specific, and the interval between their onset and a definitive diagnosis can extend up to ten years (5). However, some patients may be asymptomatic or may exhibit mild, atypical extra-intestinal lesions (1).
The diagnosis of celiac disease typically involves a combination of clinical manifestations, histopathological studies, HLA typing, and serologic tests (6). However, these criteria are not always fulfilled, particularly in cases involving younger children. Additionally, fulfilling these criteria may require the introduction of gluten into the patient’s diet, which can pose significant challenges. Furthermore, serologic tests may yield false-negative results in certain situations, such as immune deficiency, antibody cross-reactions, and seronegative or latent forms of celiac disease. Therefore, most patients require endoscopy and biopsy to achieve an accurate diagnosis (7).
Endoscopic findings in celiac disease primarily appear in the distal duodenum and often include nodular mucosa, either with or without a mosaic pattern, absent or flattened Kerkring’s folds, mucosal erosions, visible submucosal vascularity, and deep mucosal grooves (1-5). These findings are indicative of villous atrophy and have a high specificity (> 90%) for celiac disease in regions where it is the most prevalent cause of villous atrophy. The sensitivity of these endoscopic signs has been reported to range from 40% to 70% in patients with this condition (8). Small, red spot lesions (RSLs) that do not damage the surrounding mucosa have been identified (1). However, research exploring the relationship between RSLs and celiac disease remains limited.
To our knowledge, no prior study has investigated RSLs in the pediatric celiac population in Iran. At the time of initiating this project, only a few studies worldwide had addressed this feature, underscoring the need for data from diverse geographic and ethnic populations. In this research, we aimed to evaluate the presence of RSLs in patients with celiac disease. We hypothesize that identifying such lesions in the duodenal bulb during endoscopy may assist in diagnosing or screening children, particularly those with rare, atypical complaints or even in asymptomatic cases.
2. Objectives
This study was designed to assess the presence of RSLs and to compare these findings with other endoscopic and pathological results. The primary goal of our research is to determine the validity and reliability of using these lesions in the diagnosis of celiac disease.
3. Methods
3.1. Study Design and Participants
The present diagnostic study was conducted over 36 months on children under 18 years old at Mofid Children’s Hospital, a tertiary hospital for pediatric patients in Tehran, Iran, from March 2019 to February 2022. These patients, who were candidates for duodenal biopsy and esophagogastroduodenoscopy, were selected based on clinical presentations and serologic results indicative of celiac disease. Initially, after obtaining informed consent, a pre-prepared checklist was completed for each patient, including details such as age, gender, height, weight, Body Mass Index (BMI), weight-for-height Z-score, clinical manifestations (chronic diarrhea, chronic abdominal pain, vomiting, nausea, anorexia, constipation, abdominal distention, steatorrhea, anemia, and skin lesions), comorbidities (type 1 diabetes, thyroiditis, hypothyroidism, autoimmune liver dysfunction, Down syndrome, and Turner syndrome), and results of serologic tests (anti-tTG IgA, total IgA).
The reference standard was selected according to the 2020 European Society for Paediatric Gastroenterology, Hepatology and Nutrition (ESPGHAN) guidelines, which recommend duodenal histopathology (Marsh ≥ II) in combination with positive anti-tTG IgA and normal total IgA levels as the most reliable diagnostic criteria for pediatric celiac disease. The positivity cut-off for the index test (presence of RSLs) was defined as at least one discrete, well-circumscribed RSL in the duodenal bulb identified under narrow-band imaging (NBI), based on prior prospective and retrospective studies reporting high specificity for celiac disease when applying this definition. According to ESPGHAN guidelines, the initial step in diagnosing suspected celiac disease involves consideration of tTG IgA and total IgA (6).
3.2. Inclusion and Exclusion Criteria
All eligible patients meeting the inclusion criteria were enrolled consecutively during the study period to minimize selection bias and to ensure representativeness of the target population. All patients included in this study exhibited clinical symptoms of celiac disease and had positive anti-tTG serology tests and normal total IgA levels. This serological marker was consistently tested in a single laboratory. Patients were excluded if they had a history of gastrointestinal surgeries affecting the duodenum or had other conditions that could mimic celiac disease histologically, such as Crohn’s disease, eosinophilic gastroenteritis, or other inflammatory disorders. Those with missing data, inadequate biopsy specimens, or incomplete follow-up were also excluded from the analysis.
3.3. Endoscopy Procedures
In the next step, the patients underwent esophagogastroduodenoscopy using NBI, an enhanced imaging technique that increases the accuracy of endoscopic images. The NBI employs a narrow-band filter that selects blue and green wavelengths of light, enhancing vascular visualization due to the absorption of these wavelengths by hemoglobin (9). All endoscopic procedures were performed by a highly experienced pediatric gastroenterologist using a high-resolution endoscope (EG-2990i; Pen Tax, Japan) under general anesthesia with fentanyl and midazolam. In cases of RSLs, the endoscopic view was independently confirmed by two experienced pediatric endoscopists who were blinded to each other's assessments. After conducting NBI endoscopy on each patient and collecting six biopsy specimens from the duodenum, the data revealed the visual endoscopic markers of celiac disease (such as nodular pattern, mosaic pattern, scalloped folds, flattened folds), including the presentation of RSLs in the duodenal bulb.
Inter-observer agreement for the identification of RSLs was assessed by two experienced pediatric endoscopists. During endoscopic procedures, the initial assessment was performed by an endoscopist. Subsequently, video recordings of the procedures were independently reviewed by a second endoscopist, who was blinded to both the findings of the first endoscopist and the final diagnosis.
3.4. Histologic Procedures
The pathological results of duodenal specimens, including Marsh grading (which assesses intraepithelial lymphocyte infiltration, neutrophilic infiltration, villous atrophy, and crypt hyperplasia), were accurately recorded in the checklist. Marsh grading was performed using a four-stage system based on the dynamic pattern of celiac lesion development. This system is characterized as follows: Type 1 (infiltrative lesions with intraepithelial lymphocyte infiltration), type 2 (hyperplastic lesions with increased crypt depth but no villous atrophy), type 3 (destructive lesions with crypt hyperplasia and villous atrophy), and type 4 (hypoplastic lesions and villous atrophy but without crypt hyperplasia) (10). Additionally, it is pertinent to mention that Marsh grading was conducted by an expert pathologist who was blinded to the endoscopist’s visual findings but had full access to the patient’s clinical and laboratory data.
3.5. Celiac Disease Diagnosis
All patients enrolled who adhered to the protocol, including attending endoscopy appointments and completing diagnostic and therapeutic procedures, were categorized into 'DEFINITE' and 'POTENTIAL' groups based on their pathology results (Figure 1). Definite cases included patients with clinical symptoms and serological evidence supportive of celiac disease, coupled with Marsh 2 or higher pathology findings. Potential cases included patients with clinical symptoms and serological indicators suggestive of celiac disease and pathology results but with Marsh 0 or 1 pathology results. In this study, the potential group served as the control group.
.")
The flowchart illustrates the study design, including the selection of patients and their subsequent division into two groups: 'Definite' and 'Potential' (control).
3.6. Statistical Analysis
Data analysis was conducted using SPSS version 23.0 (SPSS Inc, Chicago, IL). This analysis focused on evaluating the presence of RSLs in patients and comparing these results with other endoscopic and pathological findings. A P-value < 0.05 was considered statistically significant for all analyses.
3.7. Ethical Consideration
Ethics approval for this study was granted by the Ethics Committee of Shahid Beheshti University of Medical Sciences, under the ethics code IR.SBMU.MSP.REC.1398.1043. The study was conducted following the ethical principles outlined in the Declaration of Helsinki. Informed consent was obtained from all participants and/or their legal guardians. The confidentiality and anonymity of the participants were rigorously maintained throughout the study. All procedures involving human participants adhered to the ethical standards of the institutional and/or national research committee.
4. Results
In this study, 302 patients aged 1 to 17 years (mean age: 8.29 ± 4.27 years) were enrolled. Among them, 25 cases met the criteria for definitive celiac disease, characterized by clinical manifestations, positive serology, and lesions categorized as Marsh grade II or higher (comprising 36% males and 64% females). The control group included 277 patients, presenting with clinical manifestations and positive serology but exhibiting either normal pathology or lesions classified as Marsh grade 0 or I. This group, referred to as the potential celiac group, consisted of 47.29% males and 52.71% females. Statistical analysis revealed no significant gender differences in either group.
The mean age for the definite and potential groups was 8.57 ± 4.3 and 8.17 ± 4.28, respectively. Statistical analysis revealed a significantly higher Z-score BMI Index in the potential group compared to the definite group (P = 0.04). For patients over two years old, the average BMI Z-score was -0.72 ± 1 in the definite celiac group and 0.49 ± 1.41 in the potential celiac group. In patients under two years old, the potential celiac group had an average weight/height Z-score of -0.68 ± 2.30. Notably, the definite celiac group had no patients younger than two years.
Analysis of clinical manifestation frequencies indicated that chronic abdominal pain and anorexia were the most common symptoms in both groups. Nausea was the least prevalent in the definite group, while steatorrhea was the least common in the potential group. Further statistical analysis showed a significantly higher prevalence of chronic diarrhea in the definite celiac group compared to the potential group (P = 0.04).
The investigation into underlying diseases, specifically type 1 diabetes and hypothyroidism, across both groups revealed no statistically significant differences. However, analysis regarding familial history demonstrated a notable disparity between the two groups. The incidence of a confirmed celiac disease history among siblings was significantly higher in the definite celiac group compared to the potential celiac group (P = 0.01), as detailed in Table 1.
| Indices | Definite Celiac Group (N = 25) | Potential Group (N = 277) | P-Value |
|---|---|---|---|
| Age | 8.57 ± 4.35 | 8.17 ± 4.28 | 0.84 |
| Gender | 0.21 | ||
| Male | 9 (36) | 131 (47.29) | |
| Female | 16 (64) | 146 (52.71) | |
| Z-score high/weight (in children < 2 y) | - | -0.68 ± 2.30 | - |
| Z-score BMI (in children > 2 y) | -0.72 ± 1.0 | 0.49 ± 1.41 | 0.04 |
| Underlying disease | |||
| Diabetes | 3 (12) | 11 (4) | 0.06 |
| Hypothyroidism | 7 (28) | 44 (16) | 0.12 |
| Clinical signs | |||
| Chronic abdominal pain | 18 (71.4) | 185 (66.7) | 0.52 |
| Chronic diarrhea | 5 (20) | 22 (7.8) | 0.04 |
| Nausea | 3 (12) | 27 (9.8) | 0.35 |
| Anorexia | 14 (56) | 119 (43.1) | 0.10 |
| Abdominal distention | 9 (36) | 69 (25.5) | 0.11 |
| Vomiting | 4 (16) | 81 (29.4) | 0.15 |
| Constipation | 5 (20) | 92 (33.3) | 0.17 |
| Steatorrhea | - | 5 (1.8) | 0.24 |
| Family history of celiac disease | |||
| In father | 1 (4) | 5 (1.8) | 0.45 |
| In mother | 1 (4) | 5 (1.8) | 0.45 |
| In brother and/or sister | 2 (8) | - | 0.01 |
Abbreviation: BMI, Body Mass Index.
a Values are expressed as mean ± SD or No. (%).
Pathological examinations utilizing the Marsh grading system revealed that Marsh III was the most prevalent in children of the definite celiac group, with a frequency of 94%. In contrast, 94% of children in the potential group exhibited normal pathology (Marsh 0), and 5.9% were classified as Marsh I. Notably, all cases in the definite celiac group demonstrated the presence of intraepithelial lymphocytes in their microscopic pathology studies (P = 0.001). Additionally, villous atrophy and crypt hyperplasia were observed in 92% and 56% of cases, respectively, as outlined in Table 2.
| Indices | Definite Celiac Group (N = 25) | Potential Group (N = 277) | P-Value |
|---|---|---|---|
| Eosinophilic infiltration | - | ||
| Yes | 2 (8) | - | |
| No | 23 (92) | 277 (100) | |
| PMN infiltration | 0.13 | ||
| Yes | 7 (28) | 38 (13.71) | |
| No | 18 (72) | 239 (86.28) | |
| Crypt hyperplasia | - | ||
| Yes | 14 (56) | - | |
| No | 11 (44) | 277 (100) | |
| Vilous atrophy | - | ||
| Yes | 23 (92) | - | |
| No | 2 (8) | 277 (100) | |
| Intraepithelial lymphocite | < 0.001 | ||
| Yes | 25 (100) | 27 (9.74) | |
| No | - | 250 (90.25) |
a Values are expressed as No. (%).
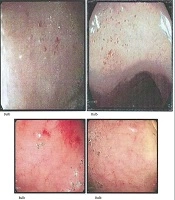
The concordance rate between two gastroenterologists in identifying RSLs was reported to be over 90%. The data presented in Table 3 show that 15 cases (60%) in the definite celiac group exhibited RSLs during endoscopy (Figure 2). In contrast, 23 cases (8.30%) in the potential group presented with RSLs. The sensitivity and specificity of RSLs were calculated to be 60.0% and 91.6%, respectively. The positive predictive value (PPV) was determined to be 39.4%, while the negative predictive value stood at 96.2%. Additionally, the positive likelihood ratio (LR) was calculated at 6.43, with a negative LR of 0.43. Similar values were also calculated for scalloping and flattening of folds as detailed in Table 3. Calculating the LRs for three endoscopic indicators — scalloping folds, RSLs, and flattening folds — revealed that the presence of scalloping folds is a more suitable diagnostic for celiac disease. This conclusion is based on both (LR+) and (LR-) indices, compared to the other indicators, as detailed in Table 3.
 in bulb during endoscopy in celiac group")
Exhibited red spot lesions (RSLs) in bulb during endoscopy in celiac group
| Variables | Definite Celiac Group (N = 25); No. (%) | Potential Group (N = 277); No. (%) | Sensitivity% | Specificity% | PPV% | NPV% | LR Positive | LR Negative |
|---|---|---|---|---|---|---|---|---|
| Red spot | 15 (60) | 23 (8.30) | 60 | 91.6 | 39.4 | 96.2 | 6.43 | 0.43 |
| Scalloping | 18 (72) | 17 (6.13) | 72 | 93.8 | 51.4 | 97.3 | 11.61 | 0.29 |
| Flattening fold | 9 (36) | 15 (5.41) | 39.1 | 94.6 | 37.5 | 94.9 | 7.24 | 0.64 |
Abbreviation: LR, likelihood ratio.
In summary, the results indicate a significantly higher prevalence of chronic diarrhea in the definite celiac group compared to the potential group. The potential group exhibited a higher BMI Z-score Index. Additionally, a higher rate of positive celiac history among siblings was observed in the definite celiac group compared to the potential celiac group. Marsh III grading was most frequent in children of the definite celiac group. Furthermore, 60% of children in the definite celiac group presented with RSLs. The sensitivity, specificity, PPV, and negative predictive value of RSLs for diagnosing celiac disease were 60%, 91.6%, 39.4%, and 96.2%, respectively. The positive and negative LRs for RSLs were 6.43 and 0.43, respectively.
5. Discussion
Our research was conducted at a referral center and involved 302 children, with an average age of 8.29 ± 4.27 years. We categorized them into two groups: Twenty-five confirmed cases of celiac disease and 277 potential cases. This classification was based on clinical symptoms, serological tests, and Marsh grading. Statistically, the average age was comparable in both groups. Notably, there was a higher proportion of female patients compared to males. The primary aim of our study was to identify RSLs in the duodenal bulb during endoscopy and to determine their role in diagnosing or screening children, particularly those with rare, atypical complaints or even asymptomatic cases.
The high specificity and low sensitivity of RSLs observed in this study indicate that the absence of these lesions is a strong indicator for ruling out celiac disease. However, the sensitivity of RSLs was modest (60%), and their PPV was relatively low (39.4%), indicating that many patients with celiac disease do not exhibit RSLs. This suggests that RSLs alone are not sufficient as a stand-alone screening marker, particularly in populations with a low to moderate prevalence of celiac disease. Our methodology and variables closely resemble those used in Silvester et al.'s study. We calculated the sensitivity, specificity, PPV, and negative predictive value of RSLs for diagnosing celiac disease as 60%, 91.6%, 39.4%, and 96.2%, respectively. In comparison, Silvester’s study reported these values as 31%, 94%, 80%, and 64%, respectively (1).
Considering that our study was conducted at a referral center, where screening tests with high specificity help to distinguish healthy individuals and those with the disease, the specificity of RSLs, as investigated in our study, is particularly important. As indicated in Table 3, the specificity of RSLs is 91.6%, underscoring its clinical significance in diagnosing celiac disease.
Given that both the specificity and negative predictive value in our study exceeded 90%, we can infer that patients lacking RSLs on endoscopy are unlikely to have celiac disease. The RSLs should be used in combination with other clinical and serological markers, not in isolation. When RSLs are present, especially in patients with suggestive serology (elevated tTG-IgA) or symptoms, they may raise suspicion and support the diagnostic process. Conversely, if RSLs are absent, the high negative predictive value can help reassure clinicians to consider alternate diagnoses, especially when other findings are equivocal.
In clinical practice, the endoscopic finding of RSLs could serve as an adjunctive marker, especially for ruling out celiac disease when negative. However, given their limited sensitivity, relying solely on RSLs risks missing a substantial proportion of celiac patients. Thus, we recommend that RSLs be evaluated as part of a multi-parametric approach that combines clinical, serological, and other endoscopic features, such as scalloping or a mosaic pattern, to enhance both sensitivity and specificity in screening and diagnosis.
An important finding, especially for rare diseases like celiac disease, is the influence of disease prevalence on predictive values. In Silvester et al.'s study (1), they reported a high PPV. However, it is crucial to recognize that PPV is contingent on the prevalence of the disease, meaning it can vary across different populations. In our study, the case-to-control ratio is roughly 1:11, reflective of a lower prevalence of celiac disease, resulting in a PPV of 39.4%. In contrast, Silvester's study had a closer case-to-control ratio of about 1:1.5, leading to a higher PPV (1).
Other important metrics prove especially useful in substantiating results, particularly in rare diseases. Referring to Table 3, the positive and negative LRs for the endoscopic findings of RSLs, scalloping, and flattening folds demonstrate meaningful and reliable results. Given their proximity in values, these metrics facilitate diagnosis in all three cases of endoscopy. Consequently, they can collectively be considered an effective and significant screening test.
A study conducted by Semwal et al. compared endoscopic findings in children with celiac disease, distinguishing between typical and atypical manifestations. Their most common endoscopic observations included scalloping, mosaic patterns with decreased fold height, and nodularity (11). They noted that identifying these alterations in duodenal mucosa could lead to an earlier diagnosis of celiac disease, especially in children with atypical presentations. They concluded that scalloping is the main endoscopic indicator of celiac disease in children (11). Their findings align with a study by Sahyouni et al. (12), whose retrospective study formed a consecutive cohort. They reported the highest sensitivity of 89% and a specificity of 96% for scalloping in the diagnosis of celiac disease in children. Furthermore, they observed a correlation between higher Marsh stages and an increased prevalence of scalloping (12). The findings from both these studies align with ours, despite variations in study designs and parameters.
The RSLs are distinct from both the visible submucosal vasculature, which serves as an endoscopic marker for celiac disease, and distal duodenal erosions (13, 14). These lesions appear in areas of intact mucosa and are not linked to superficial erosions. Their enhanced visibility under NBI suggests that they may represent submucosal blood, potentially within dilated vascular structures (15). Interestingly, RSLs have shown a strong association with elevated serum tTG IgA antibody levels. In celiac disease, the immune response primarily targets the tTG-2 isotype, which plays a role as a diagnostic marker and a key driver of the harmful immune process in celiac disease (1, 16). Components of the vascular wall, such as vimentin, are recognized as substrates of tTG-2. Experimental models have demonstrated that inhibiting tTG-2 can induce mesenteric vasodilation. Furthermore, tTG-2 is involved in regulating capillary sprouting and angiogenesis (17, 18). These observations imply that immune-driven vascular alterations mediated by tTG-2 antibodies may contribute to RSL formation in celiac disease. Further research is necessary to clarify the vascular impact of tTG-2 antibodies and uncover the underlying mechanisms.
Our study found that chronic abdominal pain was the most prevalent gastrointestinal symptom among our patient population. This finding aligns with the study by Dehbozorgi et al., which identified abdominal pain, bloating, and constipation as common gastrointestinal symptoms in patients (4). Dehbozorgi et al. also noted that type 1 diabetes and hypothyroidism were frequently associated with celiac disease (4). However, when comparing these underlying conditions (type 1 diabetes and hypothyroidism) in our study's two groups, we observed no significant differences (4). This discrepancy could be attributed to variations in sample sizes and also the duration of follow-up, since conditions like type 1 diabetes and hypothyroidism may emerge later, especially in younger children. Moreover, the co-occurrence of hypothyroidism and type 1 diabetes as primary autoimmune comorbidities with celiac disease is a very complex and multifactorial issue. It necessitates a large population and long-term randomized trials to thoroughly explore this association. Additionally, the impact of a gluten-free diet and its duration on the onset timing of such comorbidities remains unclear (19).
Our results revealed that the BMI Z-score Index was significantly higher in the potential group compared to the definite group. This result is consistent with prior studies. For instance, van der Pals et al. investigated body indices in children with celiac disease and found that those with a confirmed diagnosis typically had lower weights, shorter statures, and reduced BMI compared to their healthy counterparts. Despite this, their BMI often remained within the normal range for the broader population (20).
In terms of familial patterns, our study noted a higher incidence of celiac disease history among siblings in the definite celiac group compared to the potential group. This finding is supported by Sahin and Mermer, who identified a higher prevalence of the disease among first-degree relatives, especially siblings, who are at a higher risk (21). The frequent occurrence of celiac disease within families, along with its strong association with the HLA DQ2 and/or DQ8 alleles, further underscores the significant genetic contribution to its development. Additional studies focusing on siblings corroborate our findings: The global prevalence of celiac disease is estimated to be 3.9% among siblings of children with confirmed celiac disease and significantly higher, between 75 = 80%, among monozygotic twins (22, 23). In a study by Sahin and Mermer, it was shown that 10.7% of siblings of celiac patients were affected by the disease (21).
In summary, while the presence of RSLs in the duodenal bulb during endoscopy may assist in supporting a diagnosis of celiac disease, particularly in patients with positive serology and/or symptoms, their absence has a more definitive role in ruling out the disease in a high-risk context. Therefore, we recommend that RSLs be considered an adjunctive, rather than a primary, tool in celiac screening protocols. Integrating RSL findings with serology and clinical risk factors will allow for a more accurate and effective screening process.
5.1. Conclusions
The RSLs, along with scalloping and fold flattening observed during endoscopic examinations, may serve as potential indicators for suspected celiac disease. While these findings warrant attention during endoscopy, particularly in patients with gastrointestinal symptoms and positive serological tests, the role of RSLs in screening remains limited. The high specificity but low sensitivity and PPV of RSLs, as demonstrated in this study, make them unsuitable as a primary screening tool, suggesting that their absence can be a reliable tool for ruling out celiac disease. However, the presence of RSLs does not strongly support a diagnosis, reflecting the limited diagnostic value of these lesions in confirming celiac disease. Overall, these findings emphasize the negative predictive value of RSLs, highlighting their utility in exclusion rather than in definitive diagnosis. Definitive diagnosis must remain based on histopathological evaluation of duodenal biopsies, interpreted according to the Marsh classification by an experienced pathologist, in line with ESPGHAN guidelines. Further studies with diverse designs are recommended to explore their potential role more comprehensively.
5.2. Limitations and Suggestions
Our study faced certain limitations, including a brief duration and a consequently small sample size. Expanding the scope to include more participants and a longer timeframe would likely yield more precise and reliable results. Additionally, our research was conducted exclusively in a pediatric center. Conducting similar studies across multiple centers and broader populations would enhance the generalizability of the findings. A key limitation of our study design was the selection of the comparative group, which consisted of patients with milder forms of celiac disease rather than non-celiac individuals. Ideally, the control group should have included healthy children. However, considering the invasive nature of endoscopy under anesthesia, enrolling healthy children posed significant ethical and practical challenges. As an alternative, patients without duodenal pathology, such as those with functional abdominal pain or gastroesophageal reflux disease (GERD), could have served as a more appropriate control population. This adjustment would have provided a clearer comparison and improved the study’s diagnostic validity. Given the limited research on the association between RSLs and celiac disease, we suggest broader study models. Larger multicenter studies are warranted to confirm these findings.
