
1. Background
Iron deficiency anemia (IDA) is a global public health issue, particularly affecting infants and young children. According to estimates from the World Health Organization (WHO), approximately a quarter of the world's population suffers from anemia, including more than half of school-aged children (1), with a higher prevalence in developing countries (2). Currently, the most common cause of anemia is IDA (1), and, according to WHO statistics, in 2019 the prevalence of anemia in children aged 6 - 59 months was 39.8%, equivalent to 269 million children worldwide (3). In general, children under 7 years of age are the most vulnerable population group to IDA (4). Previous studies in Iran estimate that the prevalence of IDA among Iranian children ranges from 3.8% to 31.5%, with an average of approximately one in five children under the age of six. To prevent this disease, conventional oral iron supplements are prescribed for infants aged 6 - 24 months; however, there is no screening test program, resulting in a greater need for iron prescription (5). Fortunately, IDA can be prevented in most cases, and the WHO recommends daily consumption of iron supplements in individuals aged 6 to 23 months and in areas with a high prevalence of this disease. The recommended amount is 10 to 12.5 mg of elemental iron daily in the form of syrup or drops, for three consecutive months per year (6).
All oral iron supplements can provide sufficient elemental iron for therapeutic purposes; however, patient adherence is the main differentiating factor. Lack of availability and fear of side effects, such as nausea, vomiting, constipation, and a metallic taste, lead to poor treatment adherence. Typical iron supplements include ferrous sulfate with or without mucoproteose, glycine, iron protein succinylate, gluconate, and fumarate. These negative effects may reduce drug use (7). Micronization and microencapsulation of iron in liposomes and sachets represent the most advanced methods for improving iron absorption and tolerance. Micronization reduces particle size, increasing solubility and absorption due to a larger surface area. Microencapsulation confines micronized iron within a biological-like lipid bilayer. The phospholipid bilayer protects the iron core from oral and gastric enzymatic degradation and iron oxidation. Nanosized iron liposomes enhance absorption, reduce oxidative damage, and minimize side effects. The lipid bilayer in liposomal iron stabilizes and gradually releases its contents. Slow release improves absorption. Advanced liposomal encapsulation prevents iron from directly interacting with the intestinal mucosal barrier, thereby enhancing tolerance (8-10).
Several advantages of utilizing liposomal iron drugs are outlined here:
1. Faster absorption and restoration of iron content: Liposomal iron has been shown to restore liver iron levels more rapidly than oral iron. Numerous studies indicate that liposomal iron encapsulation improves absorption compared to conventional oral iron (11-13).
2. Liposomal iron is associated with decreased malondialdehyde levels and increased superoxide dismutase levels, indicating no oxidative damage. This may reduce the oxidative damage caused by traditional iron (11).
3. Improved absorption and fewer adverse effects compared to heme iron, possibly due to reduced oxidative damage (11).
4. Physical stability and slow release: Liposomes are nano-sized, unilamellar vesicles. The lipid bilayer imparts stability and facilitates the gradual release of contents. Gradual release can improve liposome absorption (14).
Clinical comparisons of the two drugs focus on side effects and effectiveness. In addition to previous studies on side effects, we aim to compare the effectiveness of these medicines on paraclinical parameters of iron stores and hemoglobin indices. Since children develop rapidly and require increased iron, the 4 - 6-month interval is critical for preventing IDA. Iron deficiency during cognitive and physical development can lead to long-term complications. Despite the importance of this population, few studies have compared iron supplementation in 4 - 6-month-old children, highlighting the significance of this study. Liposomal iron may be more effective and preferable than standard iron supplements due to better absorption and fewer adverse effects. This study examines the effects of liposomal iron and ferrous sulfate on key hematologic indicators in this at-risk group.
2. Objectives
This study aims to compare the effects of liposomal iron drops and conventional ferrous sulfate drops on various hematologic parameters, including hemoglobin, serum iron (SI), ferritin, total iron-binding capacity (TIBC), mean corpuscular volume (MCV), and mean corpuscular hemoglobin (MCH), in infants aged 4 - 6 months diagnosed with IDA.
3. Methods
3.1. Study Design
This study was conducted as a single-blind clinical trial involving patients diagnosed with IDA. Data were collected from children aged 4 to 6 months who were admitted to the clinics of Mohammad Kermanshahi Hospital in Kermanshah province, Iran, from 2024-04-17 to 2024-11-20. Infants aged 4 - 6 months with IDA [according to WHO criteria (15)] were eligible if they were exclusively breastfed, had not previously received iron supplements, and parents provided written informed consent. Exclusion criteria included formula feeding, intolerance to oral iron, chronic disease, or conditions affecting laboratory indices.
3.2. Sample Size
A sample size of 34 per group was calculated to detect a mean difference (MD) of 1.0 g/dL in hemoglobin at 8 weeks with 80% power and α = 0.05, assuming SD = 1.2, and allowing for 10% loss to follow-up.
3.3. Randomization and Blinding
An independent pharmacist prepared sealed opaque packets to randomly assign participants in a 1:1 ratio to liposomal or conventional iron using a computer-generated, block-stratified sequence (strata: Sex and baseline hemoglobin). This method generated approximate group balance without one-to-one matching. The study medication was repackaged to appear identical. Allocation was concealed from parents, while the dispensing pharmacist maintained the code in a locked file.
3.4. Procedure
Parents of children were informed of their right to decline participation in the study and could withdraw at any point after notifying the prescribing clinician.
3.5. Intervention
The intervention group (group A) received the iron supplement Children Ferro Fort® manufactured by Abidi Pharma Pvt. Ltd (Tehran, Iran). This microencapsulated iron pyrophosphate is presented in a water-dispersible, liposomal form to enhance absorption while minimizing gastrointestinal side effects and undesirable organoleptic properties. Each 30 mL solution contains 15 mg/mL of iron, flavored with strawberry to avoid metallic taste and discoloration of teeth. The supplement is provided free of charge to parents in a randomized, single-blind manner. The dosage is one milliliter daily, administered orally by the parents. Its components include monobasic sodium phosphate, vitamin C, sucralose, sodium metabisulfite, rosemary extract, xanthan gum, flavoring, and water. Paraclinical findings are collected by the study coordinator and analyzed by a statistician.
The control group (group B) received the conventional iron supplement IROFANT®, manufactured by Kharazmipharm Pvt. Ltd (Tehran, Iran), to assess its effectiveness. This supplement is also a 30 mL solution containing 125 mg/mL of ferrous sulfate heptahydrate, equivalent to 25 mg of elemental iron, and 0.4 mg of sodium saccharin as a sweetener. As with the intervention group, IROFANT® is provided free of charge to parents in a randomized, single-blind manner. The dosage is one milliliter daily, administered orally by the parents. The components of IROFANT® include 70% sorbitol, sodium metabisulfite, 96% alcohol, sodium saccharin, acerola essence, sugar, anhydrous citric acid, and water. As with the intervention group, paraclinical findings are collected by the study coordinator and analyzed by a statistician.
3.6. Outcomes and Follow-up
The primary outcome was the change in hemoglobin from baseline to 8 weeks. Secondary outcomes included MCV, MCH, SI, ferritin, TIBC, transferrin saturation, growth parameters, and adverse events, measured at baseline, 2 months, and 6 months. Serum C-reactive protein (CRP) was measured at each time point to assist in the interpretation of ferritin. We initially measured CRP levels to ensure that changes in ferritin were not influenced by underlying conditions such as infections or inflammation. However, due to the lack of sufficient or reliable CRP data, we were unable to include this in our analysis. Therefore, the analysis of ferritin levels was conducted without adjustment for CRP. We have clarified this limitation in the manuscript and acknowledged the potential impact on ferritin interpretation. The models were adjusted for baseline values and probable confounders.
3.7. Statistical Analysis
After collecting and classifying the data, descriptive statistics, including measures of central tendency, dispersion, frequency, and percentage, were employed. The primary approach for data analysis was mixed-effects models with adjustments for confounding variables (hemoglobin, MCV, SI, and TIBC) using the analysis of covariance (ANCOVA) test (Bonferroni). This approach allowed us to assess the effects of different treatments while accounting for changes over time and baseline characteristics such as age, sex, birth weight, and gestational status. For descriptive and secondary analyses, independent t-tests were conducted to compare quantitative variables between the two study groups. In instances where the normality assumption was not met, the non-parametric Mann-Whitney U test was utilized. Additionally, for categorical variables, the chi-square test or Fisher's exact test was applied. To track changes across three time points, repeated measures analysis was employed. Moreover, the impact of the duration of administration on hemoglobin levels, MCV, MCH, TIBC, SI, ferritin, and transferrin saturation was evaluated using repeated measures analysis. Hierarchical linear models (multilevel models) with a random intercept were employed to measure the effect of liposomal iron compared to ferrous sulfate drops at 2 and 6 months post-treatment, adjusting for baseline values and potential confounders. The marginal effect of the treatment compared to the control was estimated at 2 and 6 months after the initiation of treatment, with adjustments for baseline values and other confounders. The Bonferroni method was applied for multiple comparison adjustments of the P-values. Analyses were conducted using mixed commands in STATA software.
This methodology aims to provide a comprehensive understanding of the efficacy of different iron supplements in treating IDA in young children, contributing valuable insights to clinical practice.
3.8. Ethical Considerations
The study was approved by the Ethics Committee in Research, Faculty of Medicine, Kermanshah University of Medical Sciences (IR.KUMS.MED.REC.1403.047), and the Iranian Registry of Clinical Trials (IRCT20240809062702N1), 2024-04-17 to 2024-11-20. Additionally, parents were informed about participation in the study and signed the consent form. Data were kept confidential, with availability limited to only researchers and their physicians.
4. Results
One hundred and two infants aged 4 to 6 months with IDA participated in the study. After the exclusion of 34 individuals, the remaining patients were assigned to either the liposomal iron group or the ferrous sulfate group. One participant from the control group was excluded due to refusal to continue participation. Additionally, two infants from the intervention group and one from the control group were excluded due to being formula-fed. Two infants from the control group were excluded due to intolerance to oral iron, while two from the intervention group were excluded because of suboptimal laboratory indices. In conclusion, 60 infants were monitored for a duration of 6 months. Thirty received liposomal iron, and thirty received ferrous sulfate (Figure 1).
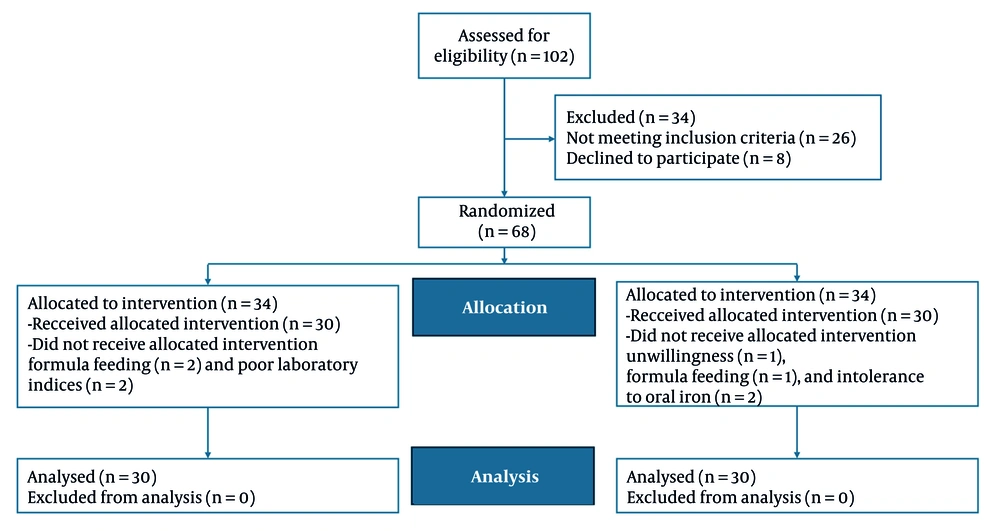
Figure 1.
CONSORT flow diagram
Baseline characteristics, including age, weight, birthweight, hemoglobin, ferritin, and red cell indices, were comparable between the groups, except for MCV and MCH, which were slightly lower in the liposomal iron group (P = 0.02 and P < 0.001, respectively), and SI and TIBC, which were higher in the liposomal iron group (P < 0.001 for both; Appendix 1, in the Supplementary File). It is notable that for all outcomes, adjustments for baseline values and covariates were performed (Table 1).
Table 1.
Total Iron-Binding Capacity, Serum Iron, Ferritin, Hemoglobin, Mean Corpuscular Volume, and Mean Corpuscular Hemoglobin Fixed Effects, Random Effect Parameters, and Bonferroni-Adjusted Marginal Effects
| Variables | Coefficient (95% CI) | Std. Errs | P > |z| |
|---|---|---|---|
| TIBC | |||
| Intervention | 12.96 (4.21, 21.72) | - | 0.004 |
| Time | |||
| 1 | -10.13 (-18.50, 1.77) | - | 0.018 |
| 2 | -28.07 (-36.44, 19.70) | - | 0.000 |
| Intervention × time | |||
| 1.1 | -26.6 (-38.44, -14.77) | - | 0.000 |
| 1.2 | -35.17 (-47.00, 23.33) | - | 0.000 |
| TIBC (baseline) | 0.66 (0.60, 0.72) | - | 0.000 |
| Age | 5.57 (1.67, 9.47) | - | 0.005 |
| Sex | -4.89 (-10.30, 0.52) | - | 0.076 |
| Cons | 41.89 (16.58, 67.21) | - | 0.001 |
| Random-effects parameters | |||
| var (cons) | 20.74 (3.92, 109.84) a | 17.64 | - |
| var (Residual) | 184.49 (142.63, 238.65) a | 24.23 | - |
| Marginal effect | |||
| Intervention × time | |||
| 1 vs. base | 8.04 (-3.07, 19.16) b | 4.96 | 0.210 c |
| 2 vs. base | 20.27 (9.15, 31.38) b | 4.96 | 0.000 c |
| SI | |||
| Intervention | 4.82 (-2.73, 12.37) | - | 0.211 |
| Time | |||
| 1 | 26.73 (19.86, 33.61) | - | 0.000 |
| 2 | 44.6 (37.73, 51.47) | - | 0.000 |
| Intervention × time | |||
| 1.1 | 8.04 (-1.68, 17.76) | - | 0.000 |
| 1.2 | 20.27 (10.55, 29.99) | - | 0.000 |
| SI (baseline) | 0.66 (0.60, 0.72) | - | 0.000 |
| Gravidity | -5.57 (-9.09, -2.05) | - | 0.002 |
| Sex | 8.82 (4.07, 13.57) | - | 0.000 |
| Cons | 15.04 (4.29, 25.78) | - | 0.006 |
| Random-effects parameters | |||
| var (cons) | 20.74 (3.92, 109.84) a | 17.64 | |
| var (Residual) | 184.49 (142.63, 238.65) a | 24.23 | |
| Marginal effect | |||
| Intervention × time | |||
| 1 vs. base | 8.04 (-3.07, 19.16) b | 4.96 | 0.210 c |
| 2 vs. base | 20.27 (9.15, 31.38) b | 4.96 | 0.000 c |
| Ferritin | |||
| Intervention | 0.34 (-12.54, 13.22) | - | 0.959 |
| Time | |||
| 1 | 25.33 (12.83, 37.84) | - | 0.000 |
| 2 | 61.23 (48.73, 73.74) | - | 0.000 |
| Intervention × time | |||
| 1.1 | 3.17 (-14.52, 20.85) | - | 0.726 |
| 1.2 | -9.13 (-26.82, 8.55) | - | 0.311 |
| Ferritin (baseline) | 0.36 (0.07, 0.64) | - | 0.015 |
| Gravidity | -7.10 (-12.93, -1.27) | - | 0.017 |
| Age | 10.07 (4.18, 15.96) | - | 0.001 |
| Cons | -18.63 (-56.14, 18.88) | - | 0.330 |
| Random-effects parameters | |||
| var (cons) | 29.06 (0.88, 955.45) a | 51.79 | |
| var (Residual) | 610.61 (472.06, 789.83) a | 80.18 | |
| Marginal effect | |||
| Intervention × time | |||
| 1 vs. base | 3.17 (-17.06, 23.39) b | 9.02 | 1.000 c |
| 2 vs. base | -9.13 (-29.36, 11.09) b | 9.02 | 0.623 c |
| Hb | |||
| Intervention | 0.11 (-0.09, 0.30) | - | 0.279 |
| Time | |||
| 1 | 0.38 (0.21, 0.56) | - | 0.000 |
| 2 | 0.90 (0.72, 1.08) | - | 0.000 |
| Intervention × time | |||
| 1.1 | 0.35 (0.10, 0.60) | - | 0.007 |
| 1.2 | 0.51 (0.26, 0.76) | - | 0.000 |
| Hb (baseline) | 0.78 (0.70, 0.87) | - | 0.000 |
| Gravidity | -0.15 (-0.24, -0.06) | - | 0.001 |
| Sex | 0.18 (0.06, 0.31) | - | 0.003 |
| Cons | 2.32 (1.46, 3.18) | - | 0.000 |
| Random-effects parameters | |||
| var (cons) | 0.02 (0.00, 0.071) a | 0.01 | |
| var (Residual) | 0.12 (0.10, 0.16) a | 0.02 | |
| Marginal effect | |||
| Intervention × time | |||
| 1 vs. base | 0.35 (0.06, 0.63) b | 0.13 | 0.014 c |
| 2 vs. base | 0.51 (0.22, 0.80) b | 0.13 | 0.000 c |
| MCV | |||
| Intervention | -0.02 (-3.43, 3.40) | 0.993 | |
| Time | - | ||
| 1 | 6.69 (3.87, 9.50) | - | 0.000 |
| 2 | 12.26 (9.45, 15.07) | 0.000 | |
| Intervention × time | |||
| 1.1 | -1.06 (-5.04, 2.92) | - | 0.601 |
| 1.2 | -1.06 (-5.04, 2.92) | - | 0.600 |
| MCV (baseline) | 0.84 (0.71, 0.97) | - | 0.000 |
| Gravidity | -2.76 (-4.59, -0.92) | - | 0.003 |
| Sex | 4.17 (1.78, 6.56) | - | 0.001 |
| Cons | 15.38 (5.16, 25.60) | - | 0.003 |
| Random-effects parameters | |||
| var (cons) | 11.27 (5.31, 23.93) a | 4.33 | |
| var (Residual) | 30.89 (23.88, 39.96) a | 4.06 | |
| Marginal effect | |||
| Intervention × time | |||
| 1 vs. base | -1.06 (-5.61, 3.49) b | 2.03 | 1.000 c |
| 2 vs. base | -1.06 (-5.61, 3.49) b | 2.03 | 1.000 c |
| MCH | |||
| Intervention | 0.17 (-0.40, 0.73) | - | 0.565 |
| Time | |||
| 1 | 0.88 (0.48, 1.29) | - | 0.000 |
| 2 | 1.19 (0.79, 1.60) | - | 0.000 |
| Intervention × time | |||
| 1.1 | 0.93 (0.35, 1.51) | - | 0.002 |
| 1.2 | 2.43 (1.86, 3.01) | - | 0.000 |
| MCH (baseline) | 1.08 (0.99, 1.17) | - | 0.000 |
| Cons | -2.43 (-5.17, 0.31) | - | 0.082 |
| Random-effects parameters | |||
| var (cons) | 0.46 (0.26, 0.80) a | 0.13 | |
| var (Residual) | 0.65 (0.50, 0.84) a | 0.09 | |
| Marginal effect | |||
| Intervention × time | |||
| 1 vs. base | 0.93 (0.27, 1.59) b | 0.29 | 0.003 c |
| 2 vs. base | 2.43 (1.77, 3.09) b | 0.29 | 0.000 c |
Abbreviations: TIBC, total iron-binding capacity; SI, serum iron; MCV, mean corpuscular volume; MCH, mean corpuscular hemoglobin.
a Estimate (95% CI).
b Contrast (95% CI).
c Bonferroni P > |z|.
After adjusting for baseline values and covariates, the intervention group exhibited a significantly greater reduction in TIBC than the control group at both 2 months [MD: -26.6; 95% confidence interval (CI): -40.13 to -13.06; P < 0.001] and 6 months (MD -35.16; 95% CI: -48.70 to -21.63; P < 0.001), with the between-group difference increasing over time. Older age was associated with higher TIBC, and time effects indicated declines in both groups, though more pronounced in the intervention arm (Table 1 , Figure 2A).
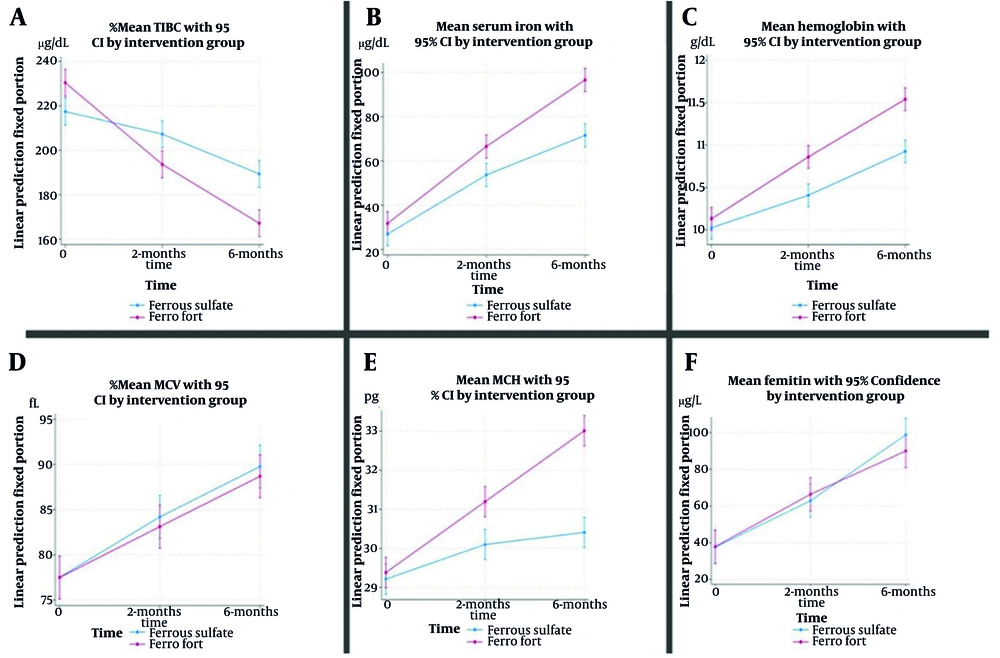
Figure 2.
A - F, the line graphs of means of hematological and iron storage indices by two groups across three visits
For SI, no significant between-group difference was observed at 2 months (P = 0.210); however, at 6 months, the intervention group had significantly higher levels than the control group (MD: 0.27; 95% CI: 9.15 to 31.38; P < 0.001). The SI increased over time in both groups, with higher values in males (P < 0.001) and lower values with increasing gravidity (P = 0.002; Table 1, Figure 2B).
Ferritin levels rose significantly over time in both groups (both P < 0.001), but there were no between-group differences at either 2 months (MD: 3.17; 95% CI: -17.06 to 23.39; P = 1.000) or 6 months (MD: -9.13; 95% CI: -29.36 to 11.09; P = 0.623). Ferritin was positively associated with age (P = 0.001) and inversely associated with gravidity (P = 0.017; Table 1, Figure 2F).
Hemoglobin was significantly higher in the intervention group at 2 months (MD: 0.35; 95% CI: 0.06 to 0.63; P = 0.014) and 6 months (MD: 0.51; 95% CI: 0.22 to 0.79; P < 0.001). Increases over time were observed in both groups (both P < 0.001), with higher values in males (P = 0.003) and lower values with greater gravidity (P = 0.001; Table 1, Figure 2C).
For MCV, there were no significant between-group differences at 2 or 6 months (P = 1.000 for both). The MCV increased over time in both groups (both P < 0.001), was higher in males (P = 0.001), and lower with greater gravidity (P = 0.003; Table 1, Figure 2D).
The MCH increased significantly more in the intervention group at both 2 months (MD: 0.93; 95% CI: 0.27 to 1.59; P = 0.003) and 6 months (MD: 2.43; 95% CI: 1.77 to 3.09; P < 0.001). In both groups, MCH increased over time (both P < 0.001), but the between-group difference widened by 6 months, indicating a sustained intervention effect (Table 1 , Figure 2E).
The evaluation of the effectiveness of two iron supplements on paraclinical parameters for assessing IDA indicated the following: Both liposomal iron and conventional iron supplementation were effective in improving SI, TIBC, MCH, MCV, and hemoglobin (Hb) levels, with statistically significant differences favoring liposomal iron for SI, TIBC, MCH, and Hb improvements over time. Ferritin increased with both treatments, but no significant difference was observed between the groups.
Liposomal iron demonstrated several pharmacological advantages, including the presence of a phospholipid bilayer, absence of gastric acidity effects, targeted iron delivery, enhanced intestinal absorption (including via M-cells), and no food effect. It also had a lower risk of oxidation, oxidative intestinal damage, gastrointestinal side effects, metallic taste, and chelation with other metals compared with conventional iron (Table 2).
Table 2.
Comparative Efficacy and Tolerability of Conventional Versus Liposomal Iron in Iron Deficiency Anemia
| Effects of Consumption on the Parameter | Conventional Iron Supplement | Liposomal Iron Supplement | Statistically Significant Effectiveness Between the Two Drugs During Time |
|---|---|---|---|
| SI improvement | ✔ | ✔ | ✔ |
| Ferritin improvement | ✔ | ✔ | 🗶 |
| TIBC improvement | ✔ | ✔ | ✔ |
| MCH improvement | ✔ | ✔ | ✔ |
| MCV improvement | ✔ | ✔ | 🗶 |
| Hb improvement | ✔ | ✔ | ✔ |
| Phospholipid bilayer | Absent | Present | - |
| Effect of gastric acidity | Present | None | - |
| Oxidation of iron | Yes | No | - |
| Targeted iron delivery | No | Yes | - |
| Absorption of iron | Regular | Enhanced | - |
| Absorption via intestinal M cells | No | Yes | - |
| Food effect | Yes | No | - |
| Oxidative damage to intestinal epithelium | Yes | No | - |
| Gastrointestinal side effects | Yes | Minimal/absent | - |
| Metallic taste | Yes | No | - |
| Chelation with other metals | Yes | No | - |
Abbreviations: SI, serum iron; TIBC, total iron-binding capacity; MCH, mean corpuscular hemoglobin; MCV, mean corpuscular volume.
5. Discussion
This randomized trial aimed to evaluate the effectiveness of liposomal iron compared to ferrous sulfate drops in infants with IDA. Our primary findings demonstrate that although both supplements were efficacious, liposomal iron at a reduced elemental dosage resulted in markedly superior enhancements in hemoglobin, SI, MCH, and TIBC, while exhibiting similar effects on ferritin and MCV.
5.1. Hemoglobin Levels and Iron Supplementation
The analysis indicates that the administration of both supplements leads to significant increases in hemoglobin levels over time. This not only underscores the importance of regular monitoring of hemoglobin in children at risk of IDA but also highlights the potential of liposomal iron formulations to enhance iron absorption and bioavailability. The results are consistent with previous studies, such as the randomized controlled trial by Kulkarni and Menon (16), which found that liposomal iron could effectively increase hemoglobin levels at a lower concentration compared to traditional iron forms, and Biniwale et al. (8). This finding is crucial as it suggests that liposomal iron may offer a more effective and potentially safer alternative for managing iron deficiency in children.
5.2. Impact on Other Hematologic Indices
The study found significant changes in hemoglobin and complex effects on MCV and TIBC. The duration of liposomal iron and ferrous sulfate administration correlated with significant changes in MCH and TIBC, suggesting that these iron formulations may affect iron metabolism and erythropoiesis in children. The absence of statistically significant MCV changes suggests that both iron supplements have similar long-term benefits (17). The significant increase in average MCH and TIBC with prolonged use of both drops indicates a potential enhancement in the production of hemoglobin and the body’s capacity to transport iron, respectively. This aligns with the physiological understanding that as the body becomes more efficient in utilizing iron, we would expect to see corresponding changes in these indices.
The findings suggest that while both drops are effective, the dynamics of iron absorption and utilization may differ, necessitating further investigation into their mechanisms of action. Additionally, a study has shown that liposomal iron can partially correct transferrin saturation, particularly in anemic patients, but may not significantly affect iron storage or hemoglobin levels (18).
Ferritin and transferrin dynamics showed that average ferritin levels rose in both groups, albeit not significantly. This raises questions regarding the interpretation of ferritin as an indicator of iron status, particularly in the context of inflammation or other confounding factors. As an acute phase reactant, ferritin can be influenced by various physiological and pathological conditions, complicating the diagnosis of IDA. Both liposomal iron and ferrous sulfate can replenish iron stores, although liposomal iron may offer better absorption.
In contrast, the significant changes in SI levels between the two groups underscore the effectiveness of both supplements in enhancing iron availability for erythropoiesis. The observed increase in transferrin levels further supports the notion that the body is responding to increased iron needs, particularly in the context of enhanced erythropoietin activity. This finding aligns with previous studies that have emphasized the importance of assessing transferrin alongside ferritin to achieve a more comprehensive understanding of iron status in pediatric populations.
5.3. Gender Differences in Response to Iron Supplementation
The findings also suggest that gender may influence the efficacy of iron supplementation, with potential variations in hematologic responses between boys and girls. This is an important consideration, as hormonal and metabolic differences can impact iron absorption and utilization. Furthermore, although we observed potential variations in response by sex, our study was not powered to examine this effect definitively. Future studies with larger sample sizes should investigate the role of gender in response to different iron formulations. Further research is warranted to delineate these differences and to clarify how they may affect the management of IDA in children.
5.4. Implications for Clinical Practice
The implications of this study are manifold. Given the high prevalence of IDA among children, especially in developing countries, the results support the use of liposomal iron formulations as a viable strategy for improving iron status and preventing anemia. The demonstrated efficacy of liposomal iron in raising hemoglobin levels at lower concentrations, compared to traditional iron supplements, suggests that it may be a more practical and effective option for pediatric patients. Furthermore, these findings highlight the importance of regular monitoring of hematologic indices in children receiving iron supplementation. Clinicians should consider not only hemoglobin but also MCH, TIBC, and SI levels when evaluating treatment efficacy. Incorporating these parameters into routine clinical practice could allow for more comprehensive assessments of iron status and better inform treatment decisions.
5.5. Improving Iron Deficiency Anemia Diagnosis, Beyond Ferritin
The diagnosis of IDA can be challenging when ferritin levels are inconclusive (20 - 100 μg/L). Several studies have explored alternative parameters to improve IDA diagnosis. The transferrin/log (ferritin) ratio, with a cut-off value of 1.70, has shown promise in diagnosing IDA when ferritin is ambiguous (19). Soluble transferrin receptor (sTfR) and the sTfR/Log (Ferritin) Index have demonstrated better diagnostic efficacy than ferritin alone, particularly in differentiating IDA from anemia of chronic disease (ACD) (20). The sTfR/Log (Ferritin) Index, with cut-off values of 1.30 for IDA and 0.90 for ACD, has been useful in distinguishing these conditions (21). Therefore, to more accurately assess the effectiveness of two oral iron forms, examine other acute phase reactants, and follow up with patients alongside ferritin, it is advisable to use more precise tests such as sTfR.
5.6. Transferrin Versus Total Iron-Binding Capacity
Multiple studies have shown that TIBC is an indirect estimate of transferrin, since each gram of transferrin binds approximately 1.25 mg of iron. While TIBC remains inexpensive and widely available, direct transferrin measurement offers advantages such as standardized reference ranges and reduced inter-laboratory variability (22-24). Recent clinical guidance emphasizes that transferrin saturation, derived from either TIBC or transferrin, is often a more reliable parameter for diagnosing iron deficiency, particularly in the presence of inflammation (25, 26). Nevertheless, in populations with significant genetic variation in transferrin, TIBC remains a pragmatic and acceptable approach (27).
5.7. Conclusions
This study highlights the importance of effective iron supplementation in improving hematologic parameters in children at risk of IDA. Liposomal iron supplementation notably increased hemoglobin levels while maintaining a good safety profile, making it a promising treatment option for pediatric IDA. The research emphasizes the need for a thorough understanding of iron metabolism, particularly the roles of ferritin and transferrin. Incorporating these findings into clinical practice can enhance strategies for preventing and treating IDA, ultimately improving health outcomes for vulnerable children.
Additionally, this single-blind clinical trial showed that both liposomal iron and ferrous sulfate drops significantly impacted paraclinical indicators in infants aged 4 - 6 months. The duration of iron supplementation was identified as a critical factor affecting these indicators, underscoring the necessity for long-term monitoring of iron supplementation effects in this age group. Further research is required to validate these findings and to explore additional factors influencing iron levels in young children. It is important to note that the findings of this study are applicable only to the specific doses of liposomal iron (15 mg/day) and ferrous sulfate (25 mg/day) used in this trial. Future studies should consider comparing equivalent doses to better understand the relative efficacy of these treatments.
5.8. Limitations and Future Directions
While this study provides valuable insights, it is not without limitations. The relatively short duration of follow-up may not capture the long-term effects of iron supplementation; future studies should consider longer follow-up periods to assess sustained improvements in iron status and hematologic indices. Additionally, reliance on traditional markers such as ferritin may limit the accuracy of diagnosing IDA, particularly in populations with inflammatory conditions. Future research should explore the utility of alternative biomarkers, such as sTfR, to enhance the diagnostic accuracy for IDA in children.
The manufacturer’s instructions and previous pharmacokinetic studies indicate that liposomal iron has higher bioavailability, requiring a lower elemental iron dosage than ferrous sulfate for therapeutic efficacy. We acknowledge that the different elemental iron doses (15 mg/day for liposomal iron versus 25 mg/day for ferrous sulfate) may limit the comparability of the findings. This difference was based on bioavailability considerations, with liposomal iron exhibiting superior absorption. As such, the results should be interpreted with caution, as they apply to the specific doses used in the study and may not be generalized to other dose comparisons.
This study demonstrates that liposomal iron improves hemoglobin and SI in children with iron-deficiency anemia better than ferrous sulfate. The MCV was continuously lower in the liposomal group throughout the experiment, suggesting that ferrous sulfate may affect red blood cell size more than liposomal iron. This discrepancy may not be clinically significant, but it should be considered when interpreting our findings regarding the overall benefit of liposomal iron.
No significant change in ferritin levels across groups represents another limitation of this research. Despite increases in hemoglobin and SI levels in the liposomal group, ferritin levels did not change, suggesting that the liposomal formulation may be less effective at increasing iron storage than circulating iron levels. Although statistical adjustments were made for baseline values, the higher baseline SI and TIBC in the liposomal group may have influenced the results, particularly for these measurements. Subsequent research with more closely aligned baseline characteristics or longer follow-up periods may reveal the long-term benefits and address potential study design biases.
Moreover, the study’s findings regarding gender differences necessitate further exploration. Future research should aim to elucidate the underlying mechanisms that contribute to these differences and assess how they may influence treatment strategies.
The CRP measurement was performed solely to control for underlying conditions that could affect ferritin levels, such as inflammation or infection; however, due to normal values in CRP levels for patients, it was not incorporated into the final analysis.