
1. Background
Attention-deficit/hyperactivity disorder (ADHD) is a prevalent neurodevelopmental condition characterized by persistent patterns of inattention, hyperactivity, and impulsive behavior (1). Recent research estimates that ADHD affects approximately 7.6% of children between the ages of 3 and 12, and 5.6% of those aged 12 to 18 (2). The ADHD leads to functional impairments in areas such as work, school, social relationships, and family environments, and is often associated with emotion regulation disorders (3). This disorder exhibits a high comorbidity with other neurodevelopmental disorders, including autism (4). The ADHD is associated with abnormalities in the dopamine and noradrenaline neurotransmitter systems (1). Consequently, stimulant drugs are highly effective in improving its symptoms by inhibiting the reuptake of dopamine and noradrenaline via their transporters (5).
The ADHD has a multifactorial etiology, involving genetic, environmental, and perinatal factors. However, the degree to which environmental factors contribute remains a matter of ongoing debate. Numerous family and twin studies have underscored a genetic basis for ADHD (6), with particular emphasis on dopamine receptor genes such as DRD4 and DRD5. Genome-wide association studies (GWAS) have also identified associations with dopamine and serotonin transporter genes (7). Furthermore, rare microdeletions and microduplications associated with ADHD have been identified, indicating a genetic complexity that requires further exploration (8).
Alterations in gut microbiota have emerged as a potential risk factor for ADHD, with increasing interest in how these microbial imbalances may influence neurodevelopmental disorders. The gut-brain axis plays a role in behavioral regulation through its impact on the enteric nervous system (9). In recent years, various clinical investigations have examined the connection between the diversity and composition of intestinal microflora and the presence and severity of ADHD symptoms (10, 11). The gut microbiota plays an important role in modulating brain activity and behavior (12). One proposed mechanism for this interaction involves the microbial production of neuroactive compounds and their precursors, which resemble neurotransmitters found in the human nervous system (13). Certain gut bacteria are capable of generating monoamine precursors — such as phenylalanine, tyrosine, and tryptophan — which are essential for the synthesis of dopamine, norepinephrine, and serotonin, all of which are implicated in ADHD (14-16). These compounds can be absorbed into the bloodstream and may reach the brain (13), potentially influencing neurotransmitter levels. Variations in the populations or metabolic functions of these bacteria might therefore affect neurological processes related to ADHD. Notably, one study found that lower levels of Bifidobacterium in early infancy were linked to a greater risk of developing ADHD and Asperger’s syndrome later in childhood (17).
In recent years, increasing attention has been directed toward the potential role of probiotics in supporting mental well-being. Clinical trials, particularly those involving older adults, have demonstrated promising outcomes in alleviating symptoms of depression, anxiety, and stress (18, 19). These beneficial effects may be mediated via both direct and indirect mechanisms. Notably, children diagnosed with ADHD often exhibit more severe gastrointestinal symptoms — such as constipation, diarrhea, irregular stool consistency, bloating, and abdominal discomfort — compared to healthy peers, as reflected in elevated GI Severity Index scores (20). Alleviation of these gastrointestinal symptoms may consequently lead to an improvement in overall quality of life (18).
Research indicates that Lactobacillus rhamnosus GG may enhance the integrity of the intestinal barrier by modulating tight junctions, promoting mucin secretion, and stimulating the production of antigen-specific immunoglobulin A (17, 21). Additionally, this probiotic strain appears to influence emotional regulation and the central GABAergic system via vagus nerve pathways — an interaction implicated in various neurodevelopmental and psychiatric conditions, including ADHD, autism spectrum disorders, anxiety, and depression (17, 22, 23).
In light of growing global interest in alternative therapies, probiotics have emerged as a promising adjunct in managing ADHD symptoms in children. Despite increasing evidence from other countries, no clinical trials to date have evaluated this approach in Iran, particularly at Isfahan University of Medical Sciences. Additionally, many parents are seeking non-pharmaceutical options to support their children’s treatment.
2. Objectives
This study aims to assess the effectiveness of probiotic supplementation alongside standard ADHD care — which includes medication and parent training — in children receiving services at pediatric psychiatric clinics in Isfahan. A double-blind randomized clinical trial was conducted during 2023 - 2024.
3. Methods
3.1. Materials/Patients
Participants were selected from children aged 6 to 12 years with ADHD who were referred to subspecialized child and adolescent psychiatry treatment centers in Isfahan city in 2023 - 2024. Demographic data, including gender, age, parental education level, and home conditions, were collected using a structured questionnaire at the initial visit. Approval for the study was granted by the Ethics Committee of Isfahan University of Medical Sciences (IR.MUI.MED.REC.1402.150), and the study was registered under the identification number IRCT20211004052670N6. Additionally, it is important to note that the participants’ diet was not recorded, which represents a significant factor in the management of ADHD symptoms and in influencing the composition of the microbiota. To partially mitigate this limitation, participants were instructed to maintain their usual dietary habits throughout the study and were asked to refrain from consuming probiotic-rich foods such as yogurt, kefir, and fermented vegetables during the intervention period. However, no formal dietary assessment (such as a Food Frequency Questionnaire or dietary recall) was conducted, which limits the ability to account for dietary variability when interpreting gut-brain axis interactions.
3.2. Inclusion and Exclusion Criteria
Inclusion criteria comprised children with ADHD aged 6 to 12 years, no change in treatment regimen during the last two months, and consent to participate in the study. Exclusion criteria included: Use of antidepressants, antipsychotics, or mood stabilizers; presence of depression and anxiety based on the Hamilton Anxiety and Children Depression Inventory questionnaires completed by the parents; diagnosis of inflammatory bowel diseases, celiac disease, or irritable bowel syndrome; and diagnosis of diabetes. Additionally, exclusion criteria included non-cooperation, such as discontinuation of the assigned drug, failure to cooperate in completing the questionnaires (if more than 30% of the questions were left unanswered), withdrawal of consent to continue participation, and any changes to the drug regimen.
3.3. Sampling and Sample Size
In this study, health-treatment centers were chosen using random cluster sampling. Within each center, participants were selected with the approval of a pediatric psychiatry subspecialist (supervisor). Sampling was conducted according to the criteria outlined in the fifth edition of the Diagnostic and Statistical Manual of Psychiatric Disorders and included children referred to specialized child and adolescent psychiatry centers in Isfahan during the intervention period. Participants were then randomly assigned using a simple block design into two groups comprising 86 and 82 individuals. The parenting education sessions were designed to provide parents with tools and strategies to support their children’s treatment and to better manage ADHD symptoms. Each parent participated in three 90-minute group sessions led by a child psychiatrist and psychologist, covering behavioral reinforcement, communication improvement, and home structure routines. These sessions were conducted for both groups before the probiotic/placebo phase, ensuring equal exposure to parent training.
3.4. The Procedure of Drug Production
To produce this medication, Amin Pharmaceutical Company weighed the required raw materials according to specified ratios and transferred them to a blender along with auxiliary materials for mixing. Once the laboratory approved the sample, the capsules were filled, packaged, and labeled before being moved to the warehouse. Users were instructed to store the medication in a dry and cool environment. Additionally, participants were advised not to make drastic changes to their diets while taking the medication and were cautioned against consuming fermented products, laxatives, or taking antibiotics during the study period. It was specified not to use the medication if the seal was broken. In case of constipation, participants were advised not to take laxatives. Probiotics are immune modulators and generally have minimal side effects. The participants were evaluated three times: At baseline (t0), after 15 days of participation in parent training sessions before the intervention (t1), and 45 days later, after the medication had concluded (t2).
3.5. Study Selection
The selection of subjects was performed using computer-generated randomization to allocate participants to two groups (placebo and probiotic) in a randomized double-blind clinical control trial. Participants were instructed to take a probiotic capsule (brand name MODAMIN) once a day for 45 days, in addition to their usual treatment (drug therapy), which included medication reminders via phone calls to the patients. The use of this medication followed the prescription provided by the manufacturer and was based on previous studies reviewed. Among the available medications, children utilized only stimulant medications or sympathomimetic agents. It is important to note that the medication delivered from the pharmaceutical company was labeled with two different names, A and B, ensuring that the researcher (resident) was unaware of the specific type of medication administered. The responsibility for drug delivery to parents was held by the resident (the medical professional in training). Additionally, structured parenting education sessions were implemented at the beginning of the study for both probiotic and placebo groups. These sessions aimed to enhance parental skills in managing ADHD-related behaviors, ensuring consistency in home-based behavioral interventions throughout the trial. Each probiotic capsule contained L. helonticus bacteria (2.682 × 10⁹ CFU) and Bifidobacterium longum (0.318 × 10⁹ CFU). Microcrystalline cellulose 102, lactose 80, croscarmellose sodium, colloidal silicon dioxide, and magnesium stearate were included in both placebo and probiotic capsules to optimize drug manufacturing conditions and protect active ingredients. The placebo capsules appeared identical to probiotic capsules in terms of the volume of contents and shell colors.
The questionnaires utilized in this study included the Attention-Deficit/Hyperactivity Disorder Rating Scale (ADHD-RS)-IV, Parent Conners Questionnaire, Pediatric Quality of Life Inventory (PedsQOL, parent version), Children’s Depression Inventory (CDI), which was completed by the child, and Hamilton Anxiety Rating Scale (HAM-A). All questionnaires used in the study have been validated in the Iranian population with acceptable psychometric properties. Specifically, the Persian version of the ADHD-RS-IV has demonstrated good internal consistency (Cronbach’s α = 0.88) and test-retest reliability (R = 0.83) (24). The Persian Conners Parent Rating Scale has shown strong reliability (Cronbach’s α = 0.89) and confirmed construct validity through factor analysis (25). The Iranian version of the PedsQOL has shown high internal consistency (Cronbach’s α = 0.87) and good convergent validity in children aged 5 - 18 years (26). The Persian form of the CDI has demonstrated satisfactory internal consistency (Cronbach’s α = 0.82) and concurrent validity with Beck Depression Inventory scores (27). Finally, the Persian HAM-A has been validated in clinical samples with Cronbach’s α = 0.90 and good discriminant validity for anxiety disorders (25). It should be noted that the CDI was self-reported by children, while the other questionnaires (Conners, PedsQOL, and Hamilton Anxiety) were completed by parents.
3.6. Statistical Analysis
The data obtained from this research were of quantitative and qualitative types, measured using nominal, ranked, and ratio scales. Descriptive and inferential statistical methods were employed for data analysis, utilizing SPSS version 18. The significance level for all tests was set at 0.05, with data analysis methods including paired t-tests, analysis of variance, and analysis of covariance.
4. Results
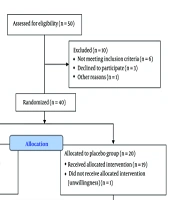
In this randomized double-blind clinical control trial study with a placebo, 168 children aged 6 to 12 years with ADHD were enrolled in super-specialized child and adolescent psychiatry treatment centers in Isfahan from 2023 - 2024 (Figure 1). Table 1 summarizes the key demographic characteristics of the 168 participants divided into two groups: Placebo and probiotic.
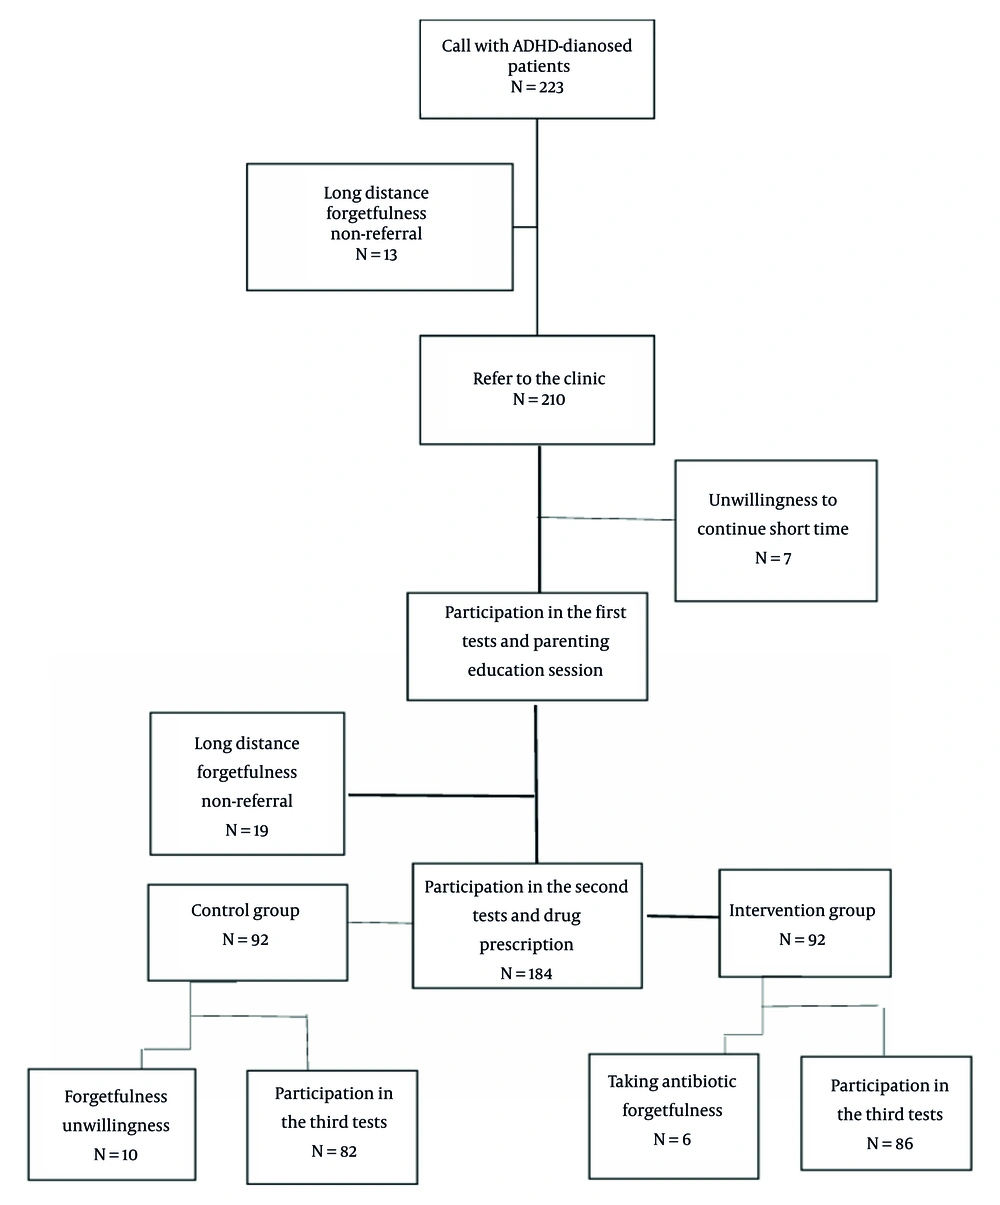
Figure 1.
CONSORT flow diagram
| Variables | Placebo Group (N = 86) | Intervention Group (N = 82) | P-Value |
|---|---|---|---|
| Age (mean ± SD) | 8.36 ± 1.68 | 8.37 ± 1.94 | 0.973 |
| Sex | 0.071 | ||
| Male | 35 (43.8) | 24 (30.0) | |
| Female | 45 (56.3) | 56 (70.0) | |
| Number of parents | 1.000 | ||
| 1 | 6 (7.5) | 6 (7.5) | |
| 2 | 74 (92.5) | 74 (92.5) | |
| Education | |||
| Father | 0.959 | ||
| High school | 18 (22.5) | 17 (21.3) | |
| Diploma | 23 (28.8) | 26 (32.5) | |
| Master's | 31 (40.0) | 32 (38.8) | |
| Master’s and Ph.D. | 7 (8.8) | 6 (7.6) | |
| Mother | 0.981 | ||
| High school | 10 (12.5) | 9 (11.3) | |
| Diploma | 27 (33.8) | 29 (36.3) | |
| Master's | 33 (41.3) | 33 (41.3) | |
| Master’s and Ph.D. | 10 (12.5) | 9 (11.3) | |
| Home condition | 0.607 | ||
| Rental | 54 (67.5) | 57 (71.3) | |
| Landlord | 26 (32.5) | 23 (28.8) | |
| Physical illness | |||
| Father | 1.000 | ||
| Yes | 13 (16.3) | 13 (16.3) | |
| No | 67 (83.7) | 67 (83.7) | |
| Mother | 0.658 | ||
| Yes | 12 (16.2) | 11 (13.8) | |
| No | 68 (83.8) | 69 (86.2) | |
| Mental illness | |||
| Father | 0.598 | ||
| Yes | 9 (11.3) | 7 (8.8) | |
| No | 71 (88.7) | 73 (91.2) | |
| Mother | 0.772 | ||
| Yes | 6 (7.5) | 7 (8.8) | |
| No | 74 (92.5) | 73 (91.2) |
a Values are expressed as No. (%) unless indicated.
b P-value indicates statistical significance in the comparative analysis between the two groups.
- Age: The mean age of participants was similar in both groups (placebo: 8.36 ± 1.68 years, probiotic: 8.37 ± 1.94 years), with no significant difference (P = 0.973).
- Sex: The ratio of males to females was fairly balanced, although there were more females in the probiotic group (70%) compared to the placebo group (56.3%). However, this difference was not statistically significant (P = 0.071).
- Parental education: The educational backgrounds of parents were comparable between the groups, with no significant differences observed across categories such as high school, diploma, and master’s degrees.
- Home conditions: Both groups reported similar housing conditions, with no significant differences (P = 0.607).
- Parental mental illness: The mental illness of fathers or mothers was determined based on responses to the Hamilton Anxiety Questionnaire (completed by the parents) and the CDI (completed by the child). It should be noted that the Hamilton Anxiety Questionnaire does not assess overall mental health; it only measures the level of anxiety in parents. Therefore, parental mental health cannot be fully inferred from this questionnaire alone. There were no significant differences in parental health status between the groups.
- Number of parents: The number of parents was similar across both groups, with 92.5% having two parents (P = 1.000), i.e., the number of legal guardians involved in the child’s care.
Overall, these demographic data confirm that the groups were comparable at baseline, which is essential for unbiased treatment outcomes.
Table 2 presents scores from the ADHD-RS-IV at three different time points: Before the Intervention, after parenting education, and after drug intervention. It should be noted that parenting education sessions were conducted before the probiotic/placebo intervention phase for both groups. These sessions aimed to enhance parents’ behavioral management skills and ensure consistent home-based support, allowing the study to evaluate the separate and combined effects of parental training and probiotic treatment.
Table 2.
| Groups | Before Intervention | After Parenting Education | After Drug | P-Value Time | P-Value Intervention | P-Value Interaction |
|---|---|---|---|---|---|---|
| Intervention | 28.35 ± 6.76 | 30.74 ± 6.63 | 31.35 ± 6.76 | < 0.001 | 0.279 | 0.136 |
| Placebo | 27.14 ± 6.48 | 28.65 ± 6.45 | 30.14 ± 6.48 | < 0.001 | - | - |
| Total | 27.74 ± 6.63 | 30.74 ± 6.63 | 29.13 ± 6.51 | - | - | - |
| P-value | 0.249 | 0.249 | 0.301 | - | - | - |
a Values are expressed as mean ± SD.
b Significance is noted with values less than 0.05.
c Mean and standard deviation represent the Attention-Deficit/Hyperactivity Disorder Rating Scale (ADHD-RS) scores across the timepoints.
- Before intervention: The probiotic group scored higher (28.35) than the placebo group (27.14), but this difference was not statistically significant.
- After parenting education: Scores increased for both groups, indicating improvement; however, the interaction P-value suggests no significant differences between the groups (P = 0.136).
- After drug intervention: Both groups showed improvement, but the differences remained non-significant (between-group P = 0.301; within-group change P < 0.001). Notably, statistical significance was found for the time factor (P < 0.001), indicating that both groups improved regardless of intervention type, whereas the group × time interaction was not significant, suggesting similar trajectories of improvement.
Table 3 displays scores from the Conners test assessed at the same three time points.
Table 3.
| Groups | Before Intervention | After Parenting Education | After Drug | P-Value Time | P-Value Intervention | P-Value Interaction |
|---|---|---|---|---|---|---|
| Intervention | 78.56 ± 7.88 | 79.62 ± 7.64 | 81.61 ± 7.87 | < 0.001 | 0.959 | 0.274 |
| Placebo | 78.66 ± 8.63 | 79.66 ± 8.23 | 81.28 ± 8.71 | < 0.001 | - | - |
| Total | 78.61 ± 8.24 | 79.64 ± 8.12 | 81.44 ± 8.28 | - | - | - |
| P-value | 0.939 | 0.977 | 0.797 | - | - | - |
a Values are expressed as mean ± SD.
b Statistically significant changes highlighted for comparison across both groups.
- Overall improvements: Significant improvements across time points were observed for both groups (within-group P < 0.001), although between-group comparisons revealed no statistically significant differences (P > 0.05).
- P-value interaction: The interaction P-values indicate no differential effect of probiotics versus placebo over time.
Table 4 evaluates changes in physical health.
Table 4.
| Groups | Before Intervention | After Parenting Education | After Drug | P-Value Time | P-Value Intervention | P-Value Interaction |
|---|---|---|---|---|---|---|
| Intervention | 46.62 ± 11.61 | 46.21 ± 12.16 | 46.56 ± 13.60 | 0.869 | 0.687 | 0.942 |
| Placebo | 47.30 ± 11.52 | 47.03 ± 12.61 | 47.07 ± 14.46 | 0.912 | - | - |
| Total | 46.95 ± 11.53 | 46.62 ± 12.35 | 46.81 ± 13.99 | - | - | - |
| P-value | 0.701 | 0.676 | 0.819 | - | - | - |
a Values are expressed as mean ± SD.
b Evaluates the change in physical health indicators across the intervention timeline.
- Mean scores: No significant changes were noted in physical health scores across the evaluation points for both groups (main effect of group P > 0.05; main effect of time P < 0.05 only reflects overall trend, not a treatment effect).
- Comparison: Both groups displayed similar patterns, indicating that probiotics did not effectively alter physical health metrics.
Table 5 assesses emotional conditions.
Table 5.
| Groups | Before Intervention | After Parenting Education | After Drug | P-Value Time | P-Value Intervention | P-Value Interaction |
|---|---|---|---|---|---|---|
| Intervention | 46.31 ± 12.74 | 46.37 ± 12.77 | 47.25 ± 14.16 | 0.773 | 0.881 | 0.515 |
| Placebo | 47.50 ± 12.53 | 47.18 ± 12.37 | 45.94 ± 15.16 | 0.897 | - | - |
| Total | 46.90 ± 12.61 | 46.78 ± 12.54 | 46.59 ± 14.64 | - | - | - |
| P-value | 0.553 | 0.683 | 0.572 | - | - | - |
a Values are expressed as mean ± SD.
b Focuses on emotional well-being indicators and changes over the study periods.
- Similar to physical health, emotional well-being measurements showed no significant changes within or between the groups across the evaluation points.
Table 6 evaluates social circumstances, producing results consistent with the emotional and physical health assessments.
Table 6.
| Groups | Before Intervention | After Parenting Education | After Drug | P-Value Time | P-Value Intervention | P-Value Interaction |
|---|---|---|---|---|---|---|
| Intervention | 46.25 ± 13.58 | 46.62 ± 14.81 | 46.44 ± 11.21 | 0.962 | 0.655 | 0.827 |
| Placebo | 47.75 ± 12.92 | 47.25 ± 14.58 | 46.75 ± 13.78 | 0.781 | - | - |
| Total | 47.00 ± 13.24 | 46.93 ± 14.65 | 46.59 ± 13.32 | - | - | - |
| P-value | 0.475 | 0.788 | 0.883 | - | - | - |
a Values are expressed as mean ± SD.
b Evaluates social health dimensions relevant to attention-deficit/hyperactivity disorder (ADHD) management.
- No significant differences were noted among the groups or across time points, reaffirming the findings of minimal impact from probiotic intervention.
Table 7 examines psychological metrics, following a comparable trend.
Table 7.
| Groups | Before Intervention | After Parenting Education | After Drug | P-Value Time | P-Value Intervention | P-Value Interaction |
|---|---|---|---|---|---|---|
| Intervention | 46.27 ± 11.86 | 46.35 ± 10.70 | 46.66 ± 9.61 | 0.894 | 0.705 | 0.551 |
| Placebo | 47.45 ± 11.42 | 47.10 ± 10.25 | 46.43 ± 10.34 | 0.539 | - | - |
| Total | 46.86 ± 11.62 | 46.73 ± 10.45 | 46.55 ± 9.95 | - | - | - |
| P-Value | 0.520 | 0.651 | 0.885 | - | - | - |
a Values are expressed as mean ± SD.
b Focuses on psychological metrics and their evolvement during the study.
- Measurements showed no significant differences either within groups or across time assessments (P > 0.05 for group × time interaction).
Table 8 covers educational performance.
Table 8.
| Groups | Before Intervention | After Parenting Education | After Drug | P-Value Time | P-Value Intervention | P-Value Interaction |
|---|---|---|---|---|---|---|
| Intervention | 46.25 ± 14.08 | 46.06 ± 10.36 | 46.31 ± 11.21 | 0.983 | 0.658 | 0.951 |
| Placebo | 47.12 ± 14.00 | 46.87 ± 9.85 | 46.62 ± 11.27 | 0.935 | - | - |
| Total | 46.68 ± 14.01 | 46.47 ± 10.08 | 46.47 ± 11.21 | - | - | - |
| P-Value | 0.694 | 0.612 | 0.861 | - | - | - |
a Values are expressed as mean ± SD.
b Examines educational performance and metrics among the children involved in the study.
- Both groups displayed similar baseline scores and changes throughout the study, with no significant differences (no between-group effect; P > 0.05), indicating the observed within-group improvements were not attributable to probiotic treatment.
Table 9, the final assessment, summarizes overall well-being across several dimensions.
Table 9.
| Groups | Before Intervention | After Parenting Education | After Drug | P-Value Time | P-Value Intervention | P-Value Interaction |
|---|---|---|---|---|---|---|
| Intervention | 46.38 ± 10.98 | 46.30 ± 9.96 | 46.63 ± 10.06 | 0.815 | 0.692 | 0.534 |
| Placebo | 47.40 ± 10.65 | 47.07 ± 9.77 | 46.65 ± 10.95 | 0.523 | - | - |
| Total | 46.89 ± 11.62 | 46.69 ± 9.84 | 46.64 ± 10.48 | - | - | - |
| P-Value | 0.552 | 0.620 | 0.987 | - | - | - |
a Values are expressed as mean ± SD.
b Summarizes the overall health and wellness indicators across all evaluation points.
- Mean scores: Once again, both groups showed no significant between-group changes (P > 0.05), confirming that probiotic supplementation did not produce a measurable treatment effect.
5. Discussion
The parenting education component of this trial was intended to standardize behavioral management across both groups, ensuring that any differences observed could be attributed to probiotic supplementation rather than variations in parental involvement. Clinical research has shown that early-life probiotic intake may be linked to better long-term outcomes, including a reduced likelihood of being diagnosed with ADHD by age 13 (17). In contrast, antibiotic use during the first year has been associated with an increased risk of developing ADHD (28). The present study investigated the potential effects of probiotic supplementation in children diagnosed with ADHD. Findings indicated no significant differences between the probiotic and control groups regarding attention span, physical and emotional well-being, or social, psychological, and academic functioning (between-group P > 0.05 across all outcomes). Although statistically significant within-group improvements were observed over time (time effect P < 0.001), these changes occurred in both groups and should not be interpreted as probiotic efficacy. These results imply that probiotics alone may not be sufficient to meaningfully influence these domains in the target population.
However, a key limitation of this study is the concurrent administration of multiple interventions, including stimulant medication and structured parenting education sessions for all participants. This multi-component design prevents the isolation of the specific effects of probiotic supplementation. Therefore, the observed improvements could be attributed to the combined influence of pharmacological treatment and behavioral training rather than the probiotics themselves. Future studies should consider employing a factorial or sequential design to disentangle these overlapping effects.
Importantly, the improvement in the PedsQOL scores observed over time in both groups should be interpreted cautiously. A significant within-group improvement (P < 0.001) does not indicate a causal treatment effect without a corresponding between-group difference. Therefore, the absence of significant between-group differences (P > 0.05) indicates that the observed improvements were likely due to concurrent behavioral and pharmacological treatments rather than probiotic supplementation.
Additionally, the role of dietary influences — known to shape gut microbiota — may not have been fully accounted for, possibly affecting the observed outcomes related to ADHD symptoms. The absence of a structured dietary assessment represents a notable limitation, given the close relationship between nutrient intake, gut microbiota composition, and neurobehavioral regulation through the gut-brain axis. Future studies should incorporate validated dietary assessment tools to better isolate the independent contribution of probiotics from diet-related effects.
Furthermore, since the Hamilton Anxiety Questionnaire used in this study only evaluates the anxiety levels of parents and not their overall mental health status, its results cannot be interpreted as a comprehensive measure of parental mental health.
Ahmadvand et al. conducted a randomized, double-blind, placebo-controlled trial to examine the clinical and metabolic effects of probiotic supplementation in children with ADHD (29). The study involved 34 participants diagnosed with ADHD, who were randomly assigned to receive either probiotic supplements containing 8 × 10⁹ CFU/g (n = 17) or a placebo (n = 17) over an eight-week period. The research aimed to evaluate the impact of probiotics on both mental health outcomes and metabolic parameters. Findings revealed significant reductions in ADHD-RS scores (P = 0.006) and HAM-A scores (P = 0.01) in the probiotic group compared to the placebo group. However, no notable changes were observed in depression scores or metabolic indices following supplementation (29).
Variations in outcomes between this study and ours may be attributed to differences in sample characteristics, the specific probiotic strains used, participants’ dietary patterns, or the assessment tools employed.
Elhossiny et al. conducted a study to investigate the potential effects of the probiotic strain L. acidophilus LB (Lacteol Fort) on ADHD symptoms and cognitive function in 80 children and adolescents aged 6 to 16 years, a demographic similar to that of our study (30). Participants were randomly divided into two groups: One received probiotics alongside atomoxetine, while the other was treated with atomoxetine alone. The ADHD symptoms were measured using the Conners Parent Rating Scale-Revised Long Version (CPRS-R-L) and the Child Behavioral Checklist (CBCL/6–18). Cognitive functions such as vigilance and executive function were evaluated through Conner's Continuous Performance Test (CPT) and the Wisconsin Card Sort Test (WCST) (30). Assessments were conducted at baseline and after twelve weeks. The results demonstrated that supplementation with L. acidophilus LB led to improvements in ADHD symptoms and cognitive performance (30), suggesting that certain probiotic strains may offer beneficial effects in managing ADHD — findings that differ from those in our study.
Compared to those studies, our shorter intervention duration (45 days) may have limited the detection of more gradual improvements, particularly in domains such as quality of life and emotional or social functioning, which typically evolve over longer periods. Therefore, future clinical trials are encouraged to extend the duration of probiotic supplementation and follow-up to at least 12 weeks or longer to better assess potential changes in these slower-to-respond measures.
Probiotics are known for their anti-inflammatory properties and their role in synthesizing tryptophan, a precursor of serotonin (31, 32). Several studies have reported their beneficial effects in alleviating symptoms of depression and anxiety, typically without significant side effects (33, 34). However, some research suggests that their efficacy, when compared to placebo, remains uncertain (35). To date, limited research has explored the psychological effects of probiotics, especially within the Iranian context. Addressing this gap, Parhizgar et al. conducted a study examining the association between probiotic intake and mental health outcomes in a sample of 279 individuals (36). Of these, 74.9% (n = 209) had moderate probiotic consumption, 3.6% had high intake, and the remainder reported low levels. Results showed a significant negative correlation between probiotic use and both depression (R = -0.183, P = 0.002) and anxiety (R = -0.122, P = 0.041). While probiotic intake significantly predicted depressive symptoms, it did not show a strong predictive value for anxiety. The regression analysis produced a coefficient of R = 0.233, R2 = 0.054, with P-values of 0.016 for depression and 0.430 for anxiety (36). Differences between their findings and ours may stem from several factors: The type of measurement tools used, the nature of the psychiatric condition (non-ADHD in some cases), and the age range of participants. Nevertheless, their results suggest that probiotics may help alleviate symptoms of depression and anxiety.
Moreover, it is crucial to consider dietary influences on ADHD symptoms, as the consumption of specific nutrients and the presence of food sensitivities can significantly impact treatment outcomes. Additionally, to obtain more accurate results, clinical trials on the use of probiotics tailored to ADHD are recommended (36). This suggests that while probiotics may contribute to alleviating symptoms of depression and anxiety, the specific application and outcomes in ADHD warrant further focused research.
Among the limitations of this study, the long intervention period and the need to follow specific dietary guidelines may have led to participant attrition. To mitigate this issue, considering larger sample sizes in future studies may be warranted. Additionally, it is important to note that the participants’ diet was not recorded, which is a significant factor in managing ADHD symptoms and influencing microbiota composition.
5.1. Conclusions
This study determined that, in general, the Conners test, ADHD-RS, and the physical, educational, emotional, psychological, social, and total scores of the PedsQOL did not change significantly between probiotic and placebo groups (all P > 0.05 for group effect). Although both groups demonstrated improvement over time (within-group P < 0.001), these parallel improvements likely reflect standard therapy and parent training effects rather than probiotic supplementation. Therefore, a non-significant P-value does not confirm equivalence or lack of any biological effect but rather indicates insufficient statistical evidence to reject the null hypothesis. Future studies with larger samples and longer follow-up durations are warranted to detect smaller effect sizes if present. Moreover, inclusion of systematic dietary assessments is recommended to more accurately evaluate gut-brain interactions and probiotic efficacy in ADHD management.