

1. Background
Peris-Bonet mentioned that the main obstacles for children’s’ development are diseases. Cancer is 1 of these diseases (1). Cancer is a chronic cell disease characterized by an infinite and uncontrolled proliferation of cells that form malignant neoplasms (2). In terms of epidemiology, when cancer occurs before age 15, it is called pediatric cancer (3) and is among the disabling diseases, which is the major leading cause of child deaths (4). In Iran, this disease is the second leading cause of death in children younger than 14 years of age (5). Before puberty, the prevalence of cancer is similar in both genders (6). Cancer usually leads to disability, despair, and death (7). In recent years, the survival rate of children with cancer has increased, such that a 5-year survival rate is considered for most of these children. Therefore, paying attention to these children is of significant importance (8). Since children are the greatest human capital in every society, implementing accurate healthcare and treatment policies aimed to provide their physical and mental health seems essential. Diagnosis of cancer can create numerous psychological traumas, which should be taken into consideration (9).
Examining the quality of life is considered as an important issue in healthcare, especially in chronic diseases. Research has shown that cancer diagnosis directly affects a patient’s quality of life and changes his/her daily life in various ways (10). Cancer has negative effects on a patient’s quality of life (11). The quality of life in children with cancer is a multidimensional concept, which is not limited to the social, physical, and mental functions of children. The quality of life should be examined from the perspectives of children, adolescents, their families, and changes that occur during their growth. Hence, quality of life is a multidimensional structure that includes physical, social, emotional, and cognitive domains (12). As a result, building knowledge regarding the quality of life can improve the personal statuses of patients with cancer (13). Research conducted to assess the quality of life among cancer patients revealed that these patients had low levels of quality of life. Thus, examining the quality of life among children with cancer can lead to positive changes in their lives and makes their lives easier (14).
Therefore, providing psychological treatments to children with cancer is one of the most significant clinical issues. Given psychological difficulties caused by cancer, providing psychological training for these people seems necessary. Although a primary prevention is always effective and useful, a secondary prevention (psychotherapy interventions) can greatly decrease psychosocial problems among these children (15). In spite of medical advances, developments in cancer treatment methods, as well as an increase in the number of cancer survivors, cancer is still regarded as a unique disease in terms of creating deep feelings of fear and despair (16). Among pieces of training that promote these children’ quality of life, emotion regulation training with a positive thinking approach can be mentioned.
An emotion regulation mechanism plays a key role in improving comparative performances of children with cancer (17). Problems in regulating emotions are associated with low levels of well-being (18). Emotion regulation provides methods that aid people to decrease, maintain, and increase their emotions (19). Moreover, emotion regulation is a process in which emotions automatically or voluntarily monitor, evaluate, and modify emotional reactions to pain (20). Through applying a number of cognitive processes (including memory, attention, and social interaction), emotion regulation changes the level of emotions, releases negative emotions, and provides the ground for paying more attention to positive emotions. Results indicated that emotion regulation among children with cancer is limited to the consideration of negative feelings. Through providing training for these children, positive emotions can be addressed (17).
Ciuluvica, Amerio, and Fulcheri (2014), in their study, entitled “emotion regulation strategies and quality of life in dermatologic patients” indicated that emotion regulation training improved the quality of life among patients in their study (21).
Furthermore, training positive thinking to children improves their quality of life and is among the most fundamental concepts in positive psychology (22). Thus, the main objective of positive psychology is not only eliminating disorders but also creating factors, which lead to growth in people without denying the necessity and importance of harm (23). According to this approach, training strategies that aid people to create a pleasurable, attractive, and a meaningful life is known as a positive intervention.
In another study, Bolier et al. (2013) indicated that applying positive psychology interventions can be considered as a complementary strategy for promoting mental health as well as treatment programs and showed that positive thinking training increased mental and physical well-being as well as promoted quality of life (24).
Since several studies indicated that training emotion regulation and positive thinking can be effective in improving people’s quality of life, promoting their mental health, as well as considering the limited research carried out in this field, the present study sought to answer the following research question:
Is emotion regulation training with a positive thinking approach effective in promoting quality of life and its dimensions (physical functioning, emotional functioning, social functioning, and school functioning) among children with cancer?
2. Objectives
Since very few studies were carried out to examine the effect of emotion regulation training with a positive thinking approach on promoting the quality of life and its dimensions among children with cancer, the present study was conducted with the aim of assessing the effect of emotion regulation training with a positive thinking approach on improving quality of life and its dimensions among children with cancer.
3. Methods
3.1. Research Environment and Patients
This quasi-experimental study is followed by a pretest, posttest, and follow-up (conducted a month after completing therapy sessions) design. A statistical population constituting of 40 children with cancer, who were hospitalized at the Imam Ali hospital in Zahedan, from January to April 2017 were selected. Among these people, 30 individuals using Morgan’s sampling table, were selected using a convenience sampling method and were assigned to 2 matched groups (15 individuals assigned to a control group and 15 individuals assigned to an experimental group). The experimental group took part in 8 60-minute sessions of emotion regulation training with a positive thinking approach. Before initiating these therapy sessions, a pretest was conducted on both groups. After completing the sessions, a posttest and a 1-month follow-up were carried out to examine the effectiveness of the mentioned training and to ensure the stability of results. If the results are stable a month after conducting the training, it can be expected that the effects stay stable in the future. The control group did not receive any such training. The inclusion criteria of this study included individuals who were at least 9 years old, being hospitalized at the Imam Ali hospital in Zahedan, having sufficient physical and mental abilities to take part in the study, and not having any other diseases. Moreover, the exclusion criteria of the present study included having a history of mental disorders, having a history of cognitive disorders, dealing with a recurrence of the disease, being older than 16 years old, and not being interested in participating in the study. None of the subjects were excluded from the study.
3.2. Intervention
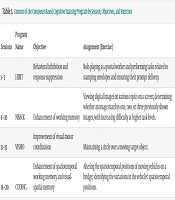
Objectives and contents of the therapy sessions were extracted from the treatment protocol proposed by Seligman et al. (25) in the field of positive thinking. To provide emotion regulation training, a book entitled “The Passport program: a journey through emotional, social, cognitive, and self-development” translated by Firouzbakht (26) and an emotion regulation training model designed by Gross (27) were applied. The main objective of holding these therapy sessions was to improve the levels of quality of life among the subjects. The therapy sessions were held in the form of questions and answers as well as group discussions. At the end of each session, homework assignments were provided and at the beginning of each session, topics discussed in the previous session were reviewed. The content and summary of each session are presented in Table 1.
Table 1.Summary of the Structure and Contents of the Therapy Sessions of Emotion Regulation Training with a Positive Thinking Approach
| Session | Objectives | Content and Activities |
|---|---|---|
| First | Preparation | Explaining the rules of the group to the children, establishing proper interactions with the members of the group, carrying out the questionnaire, presenting session schedules, and explaining the main objectives of carrying out these therapy sessions |
| Second | Providing emotional training and identification | Teaching methods of identifying emotions (negative and positive) and factors affecting them |
| Third | Accepting and responding to emotions and evaluating emotional vulnerability and emotional skills | Accepting emotions (positive and negative), reacting to primary and secondary emotions, and evaluating their harms |
| Fourth | Creating a change in provoking situations and performing cognitive assessments | Modifying a situation and evaluating it |
| Fifth | Re-assessing and changing behavioral and physiological outcomes | Assessing emotional tools and moderating a response |
| Sixth | Identifying and creating positive emotions and mentioning blessings | Talking about the methods of using strengths in everyday life, writing down positive life events, discussing being grateful, and writing thank you letters to friends |
| Seventh | Enjoying the present, teaching response styles, improving interpersonal relationships, increasing hope, and setting goals | Enjoying life, creating active responses, and talking about personality traits and values which the subjects wish to have in the future |
| Eighth | Using new capabilities in a new form, increasing positive emotions, and reviewing previous sessions | Talking about positive abilities and methods a person can apply to show all his/her abilities |
3.3. Questionnaires
In this study, 1 questionnaire was used as follow:
Pediatric quality of life questionnaire (PedsQL): This 23-item questionnaire, originally developed in English, assesses children’s quality of life and includes 4 dimensions including physical functioning (8 items), emotional functioning (5 items), social functioning (5 items), and school functioning (5 items). This self-report questionnaire can be used for children aged 8 to 12 years. This questionnaire is an appropriate psychometric instrument for examining the quality of life in various populations. The items are scored based on a 5-point Likert-type scale (ranging from 1 = never to 5 = always). The best score is 0 and the worst score is 100. The original self-report PedsQL had a high internal consistency that ranged from 0.70 to 0.90. Moreover, its test-retest reliability coefficient examined within a 2-week interval was more than 0.88 (28). The content validity of the whole questionnaire was 0.84 and the content validity of the physical functioning, emotional functioning, social functioning, and school functioning was respectively, 0.80, 0.86, 0.83, and 0.88. The construct validity of this questionnaire was good. This questionnaire had a good internal consistency (α = 0.82). Cronbach’s alpha coefficients that were related to various dimensions of this questionnaire ranged from 0.65 to 0.77. This questionnaire was approved by Iranian researchers (29).
3.4. Data Collection Method
Initially, after obtaining a license and presenting it to association of cancer children, all necessary explanations on methods of carrying out this study, its confidentiality, and the right to abandon the study whenever needed were provided for those who had the inclusion criteria. Afterward, patients who were willing to participate in the current study were asked to fill out the questionnaires. Questionnaires were read to those who were not eager to read the questionnaires and responses chosen by these patients were marked. Then, subjects were randomly assigned to an experimental group and a control group. Information was collected within 4 months from January 2016 to April 2017.
3.5. Ethical Considerations
After explaining the main objectives of carrying out the current study, the informed consent was obtained from all eligible patients and their parents. Afterward, before initiating the therapy sessions, a pretest was carried out on both groups. Additionally, after completing the sessions, a posttest and 1-month follow-up were conducted. Whenever a question seemed vague, additional explanations were provided. It should be noted that these explanations were presented to avoid any kind of ambiguity and/or bias. The subjects were assured of both confidentiality as well as anonymity and a code was only assigned to each patient (Ethical code: 1371680).
3.6. Statistical Analyses
Data were analyzed via SPSS16 using both descriptive and inferential, including analysis of covariance, statistics. Conducting this analysis depends on a number of presumptions including normality of data, homogeneity of variances, and homogeneity of regression slopes, which should be examined.
4. Results
Table 2 indicates the frequency and percent of the age of the children with cancer in the experimental and control groups.
Table 2.Demographic Information of the Subjects (the Control and Experimental Groups)
| Ager Range | Group | Frequency | Percent |
|---|---|---|---|
| 9 to 12 years | Experimental | 13 | 86.60 |
| Control | 13 | 86.60 | |
| 13 to 16 years | Experimental | 2 | 13.40 |
| Control | 2 | 13.40 | |
| Total | Experimental | 15 | 100 |
| Control | 15 | 100 |
Results presented in Table 3 show the scores on quality of life and its dimensions obtained by the experimental and control groups, which indicate an improvement in the quality of life.
Table 3.Means and Standard Deviations of Quality of Life and its Dimensions in the Pretest, Posttest, and Follow-Up
| Group | Index | Physical Functioning | Emotional Functioning | Social Functioning | School Functioning | Total | |||||
|---|---|---|---|---|---|---|---|---|---|---|---|
| M | SD | M | SD | M | SD | M | SD | M | SD | ||
| Experimental | Pretest | 28.00 | 4.86 | 18.86 | 3.24 | 17.06 | 4.21 | 18.60 | 3.79 | 82.53 | 1.332 |
| Posttest | 20.13 | 3.27 | 10.93 | 2.68 | 10.00 | 2.20 | 13.46 | 1.50 | 54.53 | 54.6 | |
| Follow-up | 18.13 | 2.61 | 10.06 | 2.76 | 8.93 | 1.70 | 12.53 | 1.50 | 49.66 | 6.35 | |
| Control | Pretest | 25.60 | 3.64 | 19.33 | 2.99 | 16.73 | 3.43 | 16.73 | 3.41 | 77.40 | 9.82 |
| Posttest | 26.80 | 3.96 | 21.86 | 2.92 | 19.40 | 3.50 | 20.93 | 1.83 | 91.00 | 1.05 | |
| Follow-up | 28.86 | 3.79 | 22.20 | 2.56 | 19.80 | 3.64 | 21.26 | 1.86 | 92.13 | 1.04 | |
The analysis of covariance was used to examine the following research question: Is emotion regulation training with a positive thinking approach effective in promoting quality of life and its dimensions (physical functioning, emotional functioning, social functioning, and school functioning) among children with cancer? All the presumptions of carrying out the analysis of covariance were initially examined; then, the analysis was conducted.
Kolmogorov-Smirnov test was used to determine the normality of the data related to physical functioning, in the pretest (Kolmogorov-Smirnov Z = 0.687, P ≥ 0.732), posttest (Kolmogorov-Smirnov Z = 0.708, P ≥ 0.698), and follow-up (Kolmogorov-Smirnov Z = 0.696, P ≥ 0.718), emotional functioning, in the pretest (Kolmogorov-Smirnov Z = 0.842, P ≥ 0.478), posttest (Kolmogorov-Smirnov Z = 0.935, P ≥ 0.346), and follow-up (Kolmogorov-Smirnov Z = 1.010, P ≥ 0.259), social functioning, in the pretest (Kolmogorov-Smirnov Z = 0.498, P ≥ 0.965), posttest (Kolmogorov-Smirnov Z = 0.656, P ≥ 0.783), and follow-up (Kolmogorov-Smirnov Z = 0.949, P ≥ 0.329), and school functioning, in the pretest (Kolmogorov-Smirnov Z = 0.594, P ≥ 0.872), posttest (Kolmogorov-Smirnov Z = 1.170, P ≥ 0.129), and follow-up (Kolmogorov-Smirnov Z = 1.150, P ≥ 0.142). The results of this test indicate that significances of values related to the normality tests are all greater than 0.05. Therefore, the data related to physical functioning, emotional functioning, social functioning, and school functioning are normally distributed.
To investigate the homogeneity of variances in both groups, Levene’s test for equality of variances was used for physical functioning (the pretest: F (1, 28) = 0.514, P = 0.47 > 0.05, the posttest: F (1, 28) = 0.723, P = 0.40 > 0.05, and the follow-up: F (1, 28) = 2.800, P = 0.105 > 0.05), emotional functioning (the pretest: F (1, 28) = 0.438, P = 0.513 > 0.05, the posttest: F (1, 28) = 0.015, P = 0.90 > 0.05, and the follow-up: F (1, 28) = 0.303, P= 0.586 > 0.05), social functioning (the pretest: F (1, 28) = 1.238, P = 0.27 > 0.05, the posttest: F (1, 28) = 4.490, P = 0.43 > 0.05, and the follow-up: F (1, 28) = 12.563, P = 0.10 > 0.05), and school functioning (the pretest: F (1, 28) = 0.227, P = 0.63 > 0.05, the posttest: F (1, 28) = 0.058, P = 0.81 > 0.05, and the follow-up: F (1, 28) = 12.563, P = 0.10 > 0.05). The results demonstrate that none of the variables under study are statistically significant. Therefore, the assumption of homogeneity of variances is confirmed.
Furthermore, another presumption for carrying out the analysis of covariance is the homogeneity of regression slopes. In terms of physical functioning, results indicate that the pretest-posttest interaction (f = 2.46, P = 0.12) and the pretest-follow-up interaction (f = 6.86, P = 0.15) are significant (P > 0.05). In terms of emotional functioning, the pretest-posttest interaction (f = 0.148, P = 0.70) and the pretest-follow-up interaction (f = 2.08, P = 0.16) are significant (P > 0.05). In terms of social functioning, the pretest-posttest interaction (f = 5.46, P = 0.27) and the pretest-follow-up interaction (f = 7.03, P = 0.13) are significant (P > 0.05). In terms of school functioning, the pretest-posttest interaction (f = 1.539, P = 0.226) and the pretest-follow-up interaction (f = 2.173, P = 0.152) are significant (P > 0.05). The results of examining the homogeneity of regression slopes confirm the assumption of the homogeneity of regression slopes.
Considering the confirmation of the 3 presumptions of conducting the analysis of covariance, this analysis can be used.
The results of Table 4 demonstrates that, as a result of the independent variable (emotion regulation training with a positive thinking approach), there is a significant difference between the scores on physical functioning, emotional functioning, social functioning, and school functioning in the posttest and follow-up (P < 0.05). 0.83 of the variance in the physical dimension of quality of life in the posttest and 0.87 of the variance in the physical dimension of quality of life in the follow-up, 0.87 of the variance in the emotional dimension of quality of life in the posttest and 0.91 of the variance in the emotional dimension of quality of life in the follow-up, 0.82 of the variance in the social dimension of quality of life in the posttest and 0.86 of the variance in the social dimension of quality of life in the follow-up, and 0.87 of the variance in the school dimension of quality of life in the posttest and 0.87 of the variance in the school dimension of quality of life in the follow-up can be determined by the independent variable (emotion regulation training with a positive thinking approach).
Table 4.Covariance of the Effect of Emotion Regulation Training with a Positive Thinking Approach on Quality of Life and Its Dimensions (Physical Functioning, Emotional Functioning, Social Functioning, and School Functioning) in the Posttest and Follow-Up
| Variable | Index | Sum of Squares | Df | Mean of Squares | F | Sig (P) | Eta-Squared | |
|---|---|---|---|---|---|---|---|---|
| Physical dimension | Pretest | Posttest | 726.169 | 1 | 726.169 | 133.326 | 0.000 | 0.83 |
| Physical dimension | Pretest | Follow-up | 1005.313 | 1 | 1005.313 | 191.935 | 0.000 | 0.87 |
| Emotional dimension | Pretest | Posttest | 844.867 | 1 | 844.867 | 195.554 | 0.000 | 0.87 |
| Emotional dimension | Pretest | Follow-up | 1044.691 | 1 | 1044.691 | 308.064 | 0.000 | 0.91 |
| Social dimension | Pretest | Posttest | 727.697 | 1 | 727.697 | 127.870 | 0.000 | 0.82 |
| Social dimension | Pretest | Follow-up | 950.544 | 1 | 950.544 | 169.508 | 0.000 | 0.86 |
| School dimension | Pretest | Posttest | 433.322 | 1 | 433.322 | 189.475 | 0.000 | 0.87 |
| School dimension | Pretest | Follow-up | 572.033 | 1 | 572.033 | 198.557 | 0.000 | 0.87 |
5. Discussion
The purpose of this study was to examine the effectiveness of emotion regulation training with a positive thinking approach in quality of life and its dimensions among children with cancer. The results indicated that emotion regulation training, with a positive thinking approach, improved the quality of life and its dimensions among children with cancer in the posttest and follow-up (Tables 4). This finding is somehow in line with results of other studies (16, 28-36). Ciuluvica, Amerio, and Fulcheri (21) demonstrated that emotion regulation training promoted quality of life among patients. Moreover, children with cancer recognized more negative images compared to healthy children. Accordingly, through providing essential training for children with cancer and ignoring negative stimuli, these children’s tolerance can be promoted. This leads to a significant improvement in their emotion regulation (17). A study carried out by Cameron, Booth, Schlatter, Ziginskas, and Harman revealed that emotion regulation training can affect a person’s emotional experiences and make him/her calm (30).
Among other factors affecting the quality of life among cancer patients are strategies applied for cognitive control of emotions, which are used after experiencing a threatening event like cancer to adjust emotions. Therefore, special attention should be paid to cognitive strategies, especially adaptive strategies including positive reappraisal, in therapeutic programs (31). Results of a study carried out by Diener and Chan showed that training positive thinking was effective in promoting quality of life among adolescents (32). In addition they showed that practicing the use of strengths that adolescents have may lead to an increase in their life satisfaction and well-being (33). Garnefski and Kraaij argued that training positive thinking led to a decrease in negative emotions and an increase in positive emotions as well as adaptive behaviors (34).
Furthermore, positive psychological interventions with an Islamic approach were effective in increasing the quality of life and hope among women (35). Wojtyna, Zycinska, and Stawiarska demonstrated that cognitive-behavioral therapy improved the quality of life and self-esteem among women with breast cancer. Moreover, cognitive-behavioral therapy enables people to maintain their ideal selves in a constant form and constantly improves their actual selves during a treatment (36). To explain these findings (16, 28-35), it can be noted that emotion regulation plays a key role in adapting to cancer and being aware of emotions aids children with cancer to improve their mental health. Accordingly, by applying emotion regulation strategies, patients with cancer can deal with their issues and respond adaptively to them. Additionally, through employing positive thinking, they can control or decrease negative emotions and can effectively cope with them. Positive thinking training can increase people’s compatibility, life satisfaction, and well-being. No studies results of which are in contradiction with the results of the current study were found.
6. Conclusion
In this regard, patients can apply emotion regulation strategies and positive thinking to cheer themselves up and decrease the mental suffering caused by the disease. This can be a great step toward improving these people’s quality of life. Hence, emotion regulation and positive thinking interventions provide the ground for patients with cancer to reassess their goals and priorities. By applying psychological treatments along with medical treatments, children with cancer can be helped to restore their health more quickly. The present study examined the effectiveness of emotion regulation training with a positive thinking approach among children with cancer. This is while no such studies had previously been carried out. This study can be a starting point for conducting other studies.
6.1. Limitations and Recommendations
Among limitations of the present study, disruptive factors, which distracted children’s attention in the hospital, including the presence of nurses and hospital staff and the noises of children who were hospitalized in other rooms, can be mentioned. Moreover, different types of cancer were not examined. Therefore, it is suggested that further studies be conducted to examine the effectiveness of emotion regulation training with a positive thinking approach in various types of cancer and compare the results with each other.