


1. Background
2. Objectives
3. Methods
3.1. Study Design
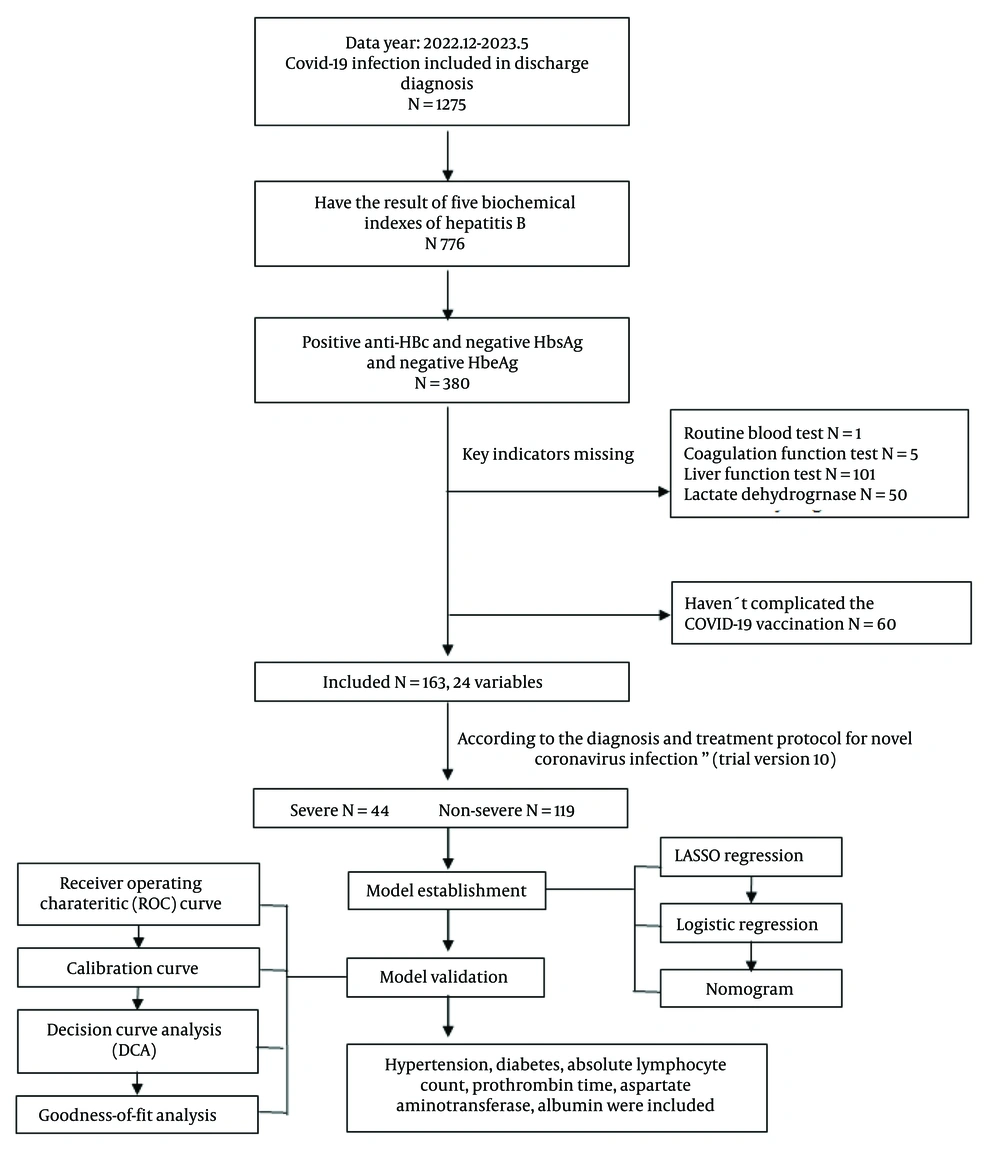
Flowchart outlining the study protocol
3.2. Case Selection
3.4. Statistical Analysis
4. Results
4.1. Statistical Analysis of Study Data
| Characteristics | All; (N = 166) | Non-severe; (N = 119) | Severe; (N = 44) | P-Value |
|---|---|---|---|---|
| Cardiovascular disease | 0.353 | |||
| No | 118 (72.4) | 89 (74.8) | 29 (65.9) | |
| Yes | 45 (27.6) | 30 (25.2) | 15 (34.1) | |
| Renal disease | 0.290 | |||
| No | 153 (93.9) | 110 (92.4) | 43 (97.7) | |
| Yes | 10 (6.13) | 9 (7.56) | 1 (2.27) | |
| Hypertension | 0.046 | |||
| No | 63 (38.7) | 52 (43.7) | 11 (25.0) | |
| Yes | 100 (61.3) | 67 (56.3) | 33 (75.0) | |
| Diabetes | 0.127 | |||
| No | 99 (60.7) | 77 (64.7) | 22 (50.0) | |
| Yes | 64 (39.3) | 42 (35.3) | 22 (50.0) | |
| Gender | 0.473 | |||
| Male | 102 (62.6) | 72 (60.5) | 30 (68.2) | |
| Female | 61 (37.4) | 47 (39.5) | 14 (31.8) | |
| Age (y) | 78.0 [69.0; 85.0] | 77.0 [69.0; 84.5] | 82.0 [71.8; 87.0] | 0.117 |
| WBC count (× 109/L) | 7.53 [5.15; 9.71] | 6.88 [5.01; 9.04] | 8.27 [5.94; 10.6] | 0.046 |
| RBC count (× 1012/L) | 4.02 (0.74) | 4.04 (0.74) | 3.98 (0.75) | 0.642 |
| ALC (× 109/L) | 0.92 [0.64; 1.21] | 0.95 [0.71; 1.26] | 0.66 [0.34; 1.02] | < 0.001 |
| ANC (× 109/L) | 5.92 [3.67;7.92] | 5.24 [3.46;7.31] | 6.94 [5.46;9.20] | 0.002 |
| AEC (× 109/L) | 0.02 [0.00; 0.08] | 0.02 [0.01; 0.09] | 0.00 [0.00; 0.03] | 0.001 |
| ABC (× 109/L) | 0.01 [0.01; 0.02] | 0.01 [0.01; 0.02] | 0.01 [0.00; 0.02] | 0.288 |
| AMC (× 109/L) | 0.46 [0.31; 0.60] | 0.47 [0.32; 0.61] | 0.42 [0.29; 0.52] | 0.170 |
| PT(s) | 12.0 [11.2; 12.8] | 11.7 [11.0; 12.6] | 12.1 [11.8; 13.1] | 0.015 |
| APTT (s) | 30.5 [27.8; 33.6] | 30.3 [28.0; 33.6] | 31.0 [26.8; 33.0] | 0.707 |
| ALT (U/L) | 20.0 [14.9; 30.5] | 20.0 [14.7; 30.5] | 21.5 [15.0; 31.0] | 0.599 |
| AST (U/L) | 27.0 [20.0; 39.0] | 27.0 [20.0; 35.5] | 33.0 [23.8; 53.2] | 0.020 |
| T.Bil (μmol/L) | 9.80 [7.55; 13.8] | 9.80 [7.50; 13.9] | 9.60 [7.75; 13.3] | 0.914 |
| ALP (U/L) | 73.0 [60.0; 92.0] | 72.0 [60.5; 97.0] | 76.4 [59.0; 89.0] | 0.952 |
| TP (g/L) | 60.2 [56.6; 67.0] | 61.8 [57.7; 67.8] | 57.6 [53.9; 60.7] | < 0.001 |
| ALB (g/L) | 32.5 (4.93) | 33.3 (4.96) | 30.3 (4.13) | < 0.001 |
| γ.GT (U/L) | 29.0 [19.0; 43.5] | 27.0 [19.0; 43.5] | 32.0 [20.5; 43.2] | 0.619 |
| GLB (g/L) | 29.0 [25.0; 31.0] | 29.0 [26.0; 32.0] | 28.2 [24.0; 30.9] | 0.151 |
| LDH (U/L) | 273 [229; 382] | 258 [218; 324] | 326 [274; 468] | < 0.001 |
Abbreviations: WBC, white blood cell count; RBC, red blood cell count; ALC, absolute lymphocyte count; ANC, absolute neutrophil count; AEC, absolute eosinophil count; ABC, absolute basophil count; AMC, absolute monocyte count; PT, prothrombin time; APTT, activated partial thromboplastin time; ALT, alanine aminotransferase; AST, aspartate aminotransferase; T.Bil, total bilirubin; ALP, alkaline phosphatase; TP, total protein; ALB, albumin; γ.GT, gamma-glutamyl transferase; GLB, globulin; LDH, lactate dehydrogenase.
a Values are expressed as No. (%) unless otherwise indicated.
4.2. Construction of Predictive Model
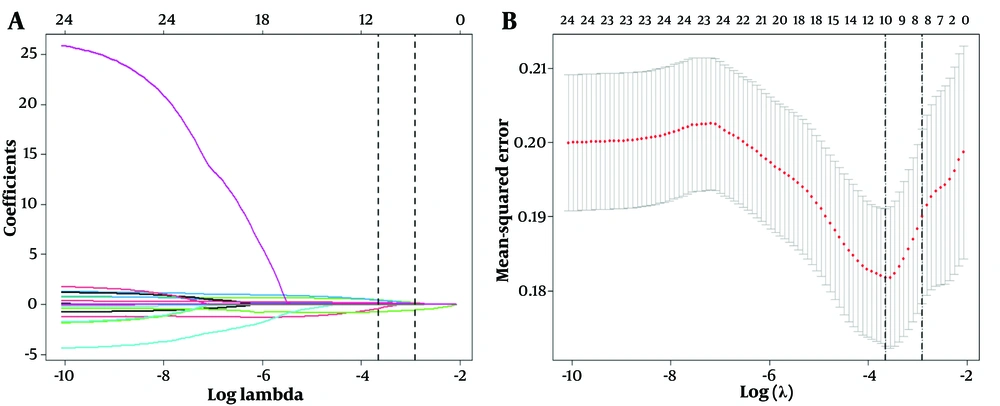
Feature selection using LASSO binary logistic regression model with ten-fold cross-validation. A, a coefficient profile plot of the logarithmic (Lambda) sequence, displaying the Log (Lambda) values of 24 features in the LASSO model; B, a ten-fold cross-validation curve of the LASSO model. Using the minimum criterion (left dotted line) and the minimum criterion with one standard error (right dotted line) a vertical dotted line was drawn at the optimal value. The minimum criterion with one standard error was used to select 8 non-zero coefficients. LASSO is the abbreviation for Least Absolute Shrinkage and Selection Operator.
| Characteristics | B | SE | OR | CI | Z | P |
|---|---|---|---|---|---|---|
| Intercept | -0.711 | 2.068 | 0.491 | 0.491 (0.008 - 27.46) | -0.344 | 0.731 |
| Hypertension | 0.728 | 0.441 | 2.071 | 2.071 (0.891 - 5.084) | 1.652 | 0.099 |
| Diabetes | 0.714 | 0.419 | 2.041 | 2.041 (0.902 - 4.703) | 1.703 | 0.089 |
| ALC | -1.140 | 0.543 | 0.320 | 0.320 (0.105 - 0.886) | -2.097 | 0.036 |
| PT | 0.213 | 0.107 | 1.238 | 1.238 (1.018 - 1.559) | 1.996 | 0.046 |
| AST | 0.014 | 0.008 | 1.014 | 1.014 (0.998 - 1.032) | 1.712 | 0.087 |
| ALB | -0.103 | 0.045 | 0.902 | 0.902 (0.823 - 0.985) | -2.275 | 0.023 |
Abbreviations: PT, prothrombin time; AST, aspartate aminotransferase; ALB, albumin; ALC, absolute lymphocyte count.
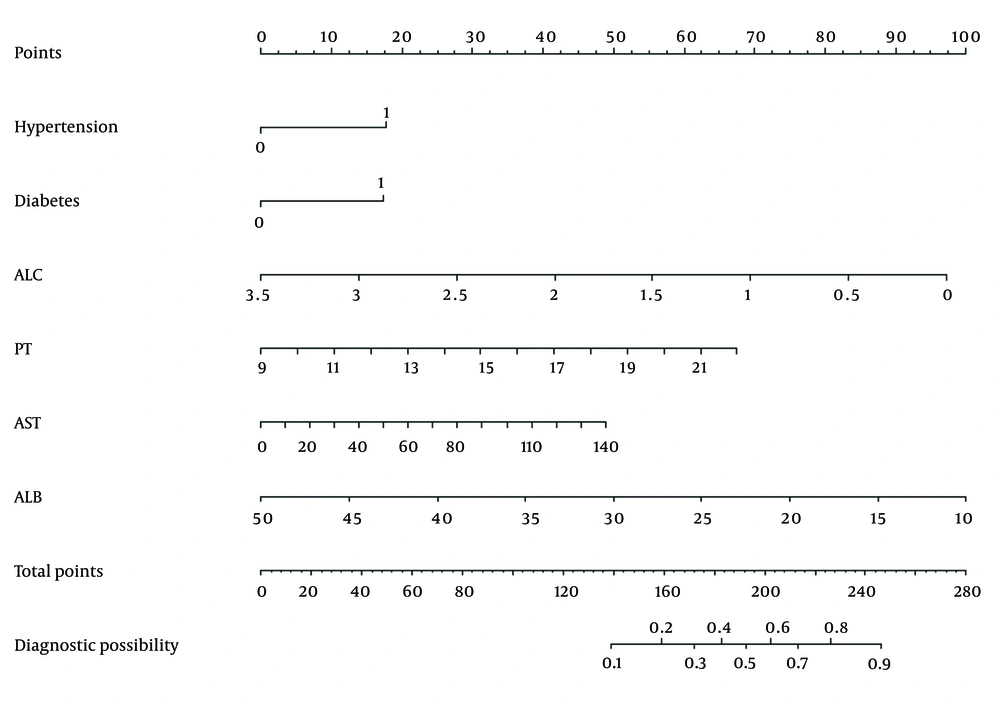
Nomogram for risk prediction of severe COVID-19 infection among patients testing positive for anti-HBc and negative for HBsAg and HBeAg. ALC, absolute lymphocyte count; PT, prothrombin time; AST, aspartate aminotransferase; ALB, albumin.
4.3. Analysis and Validation of the Constructed Model
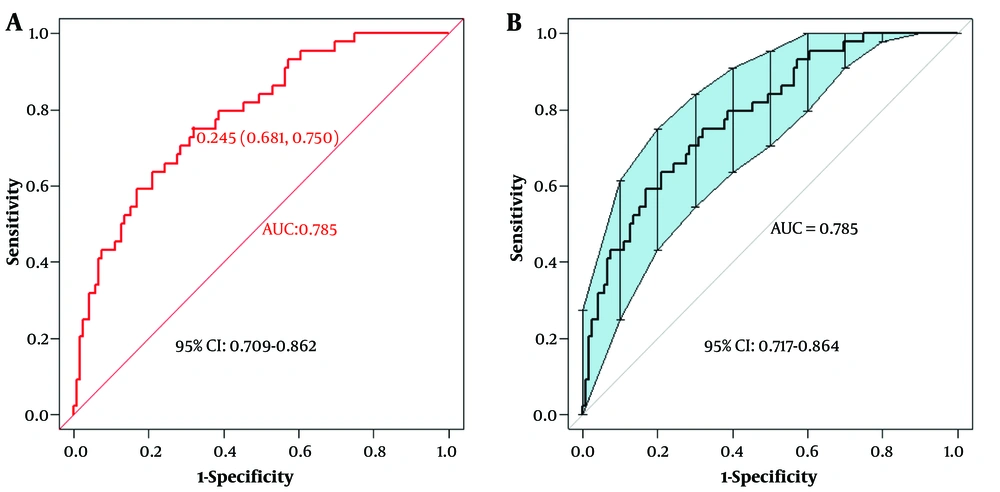
The areas under the curve (AUC) values of the predictive model and the AUC value of the internal validation using the bootstrap method. A, the AUC value of the predictive model was 0.785, with a 95% confidence interval of (0.709 - 0.862); B, the AUC value of the model validated internally via 500-bootstrap method was 0.785, with a 95% confidence interval of (0.717 - 0.864).
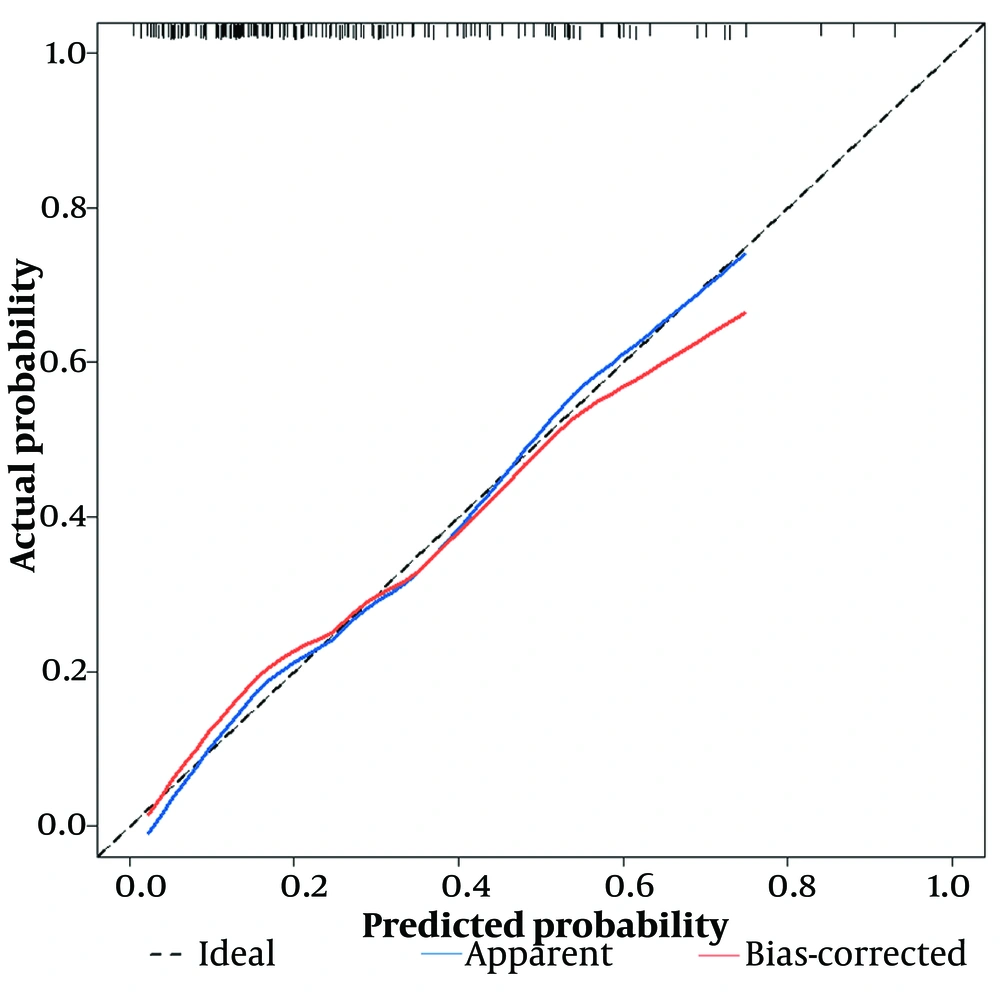
The calibration curve of the predictive model, which was internally validated by the bootstrap sampling method. The black dashed line represents the ideal calibration curve, the blue solid line represents the original calibration curve, and the red solid line represents the calibration curve using 500-bootstrap method.
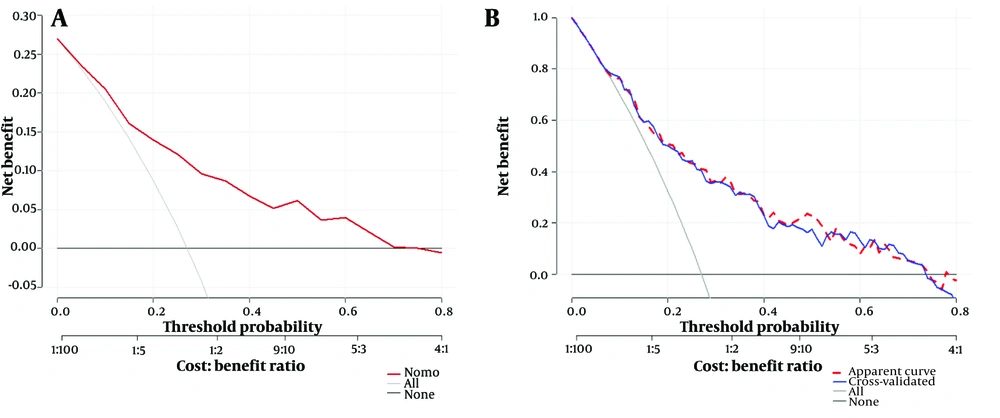
The decision-curve analysis (DCA) and the 5-fold cross-validated DCA of the predictive model. A, the DCA of the predictive model using the 500-bootstrap method. The red line represents the diagnostic curve, the light solid line represents the overall positives, and the dark solid line represents the overall negatives; B, a five-fold cross-validation of the DCA. The red dashed line represents the DCA of the predictive model; the blue solid line is the DCA of cross-validation; the light solid line indicates overall positives, and the dark solid line represents overall negatives.
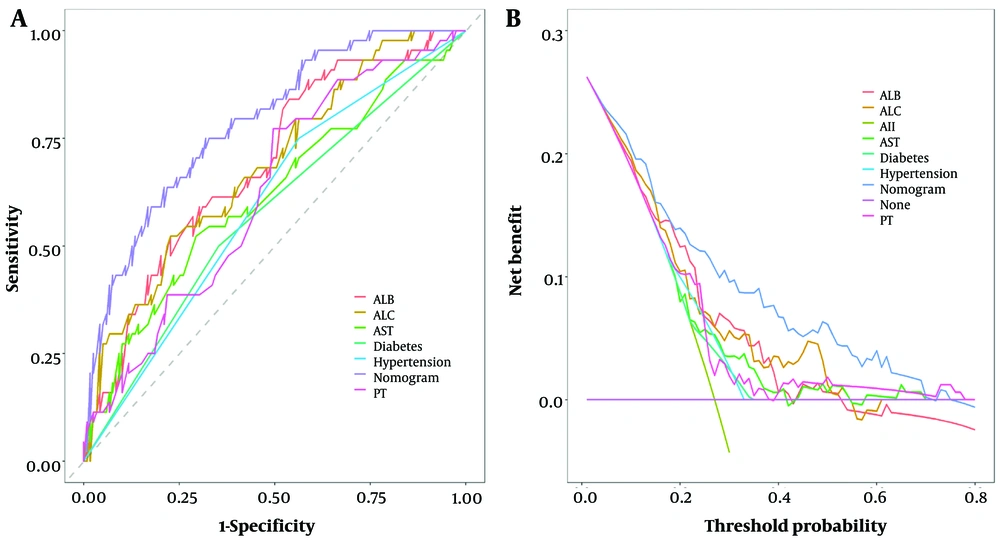
The goodness-of-fit analysis of the predictive model. A, comparison of AUC of the predictive model and individual factors; B, comparison of decision curves using the predictive model and individual factors




