
1. Background
Non-alcoholic fatty liver disease (NAFLD) is a main medical concern affecting up to 32% of American adults (1). It is distinguished by a buildup of lipids in the liver not caused by alcohol consumption and can progress to nonalcoholic steatohepatitis (NASH), a more severe form involving inflammation and liver cell damage. If untreated, NASH can lead to cirrhosis and liver failure (2). The increasing prevalence of NAFLD and NASH is linked to the rise in overweight, type 2 diabetes, and other metabolic disorders (3, 4).
Recent research has focused on the role of pro-inflammatory factors, such as tumor necrosis factor-alpha (TNF-α), interleukin (IL)-1β, and IL-6, in the development of NAFLD and NASH. These cytokines are associated with the inflammatory response and play a significant role in the onset and progression of these conditions (5, 6). For instance, TNF-α promotes insulin resistance and inflammation, contributing to the pathogenesis of NAFLD and NASH. Studies have shown that blocking TNF-α activity improves insulin sensitivity and reduces liver inflammation in animal models (6, 7). Similarly, IL-1β and IL-6 are implicated in liver inflammation, fibrosis, and insulin resistance, and blocking their activity has shown positive results in animal studies (2, 7-9).
Transforming growth factor-beta (TGF-β) regulates immune responses and inflammation in liver diseases such as NAFLD and NASH. This signaling pathway recruits and activates macrophages through the upregulating of chemokines and adhesion molecules and induces pro-inflammatory cytokines, exacerbating liver inflammation. Transforming growth factor-beta/Smad3 signaling contributes to liver fibrosis by activating hepatic stellate cells (HSCs) and promoting their transdifferentiation. This increases the production of extracellular matrix proteins and connective tissue growth factors, thereby accelerating the progression of fibrosis. Transforming growth factor-beta/Smad3 signaling induces hepatocyte damage and apoptosis in NAFLD/NASH by regulating pro- and anti-apoptotic proteins. This leads to an increase in hepatocyte mortality, and the release of damage-associated molecular patterns worsens liver inflammation and fibrosis (10-12).
Peroxisome proliferator-activated receptors (PPARs), specifically PPARα and PPARγ isoforms, play crucial roles in lipid and glucose metabolism regulation and are involved in the development of NAFLD and NASH (13). However, the exact mechanisms of PPARα/γ in these disorders remain unclear, necessitating further research to identify more effective therapeutic targets (14, 15). Saroglitazar (SARO), a dual PPARα/γ agonist, has demonstrated improved liver function and reduced liver fat in NAFLD and NASH patients (16). Resveratrol (RES), a polyphenol found in red grapes and other foods, exhibits anti-inflammatory and antioxidant properties, showing potential as a treatment for NAFLD and NASH (17).
Although RES and SARO have distinct molecular targets and mechanisms of action, they can both modulate the activities of nuclear factor kappa-light-chain-enhancer of activated B cells (NF-κB), PPARs (18, 19), and reactive oxygen species (ROS), which might lead to some common physiological outcomes, such as reduced inflammation factors, such as TGF-β and improved metabolic control. This suggests that these two compounds might have potential synergistic effects or complementary mechanisms for managing conditions such as diabetes, obesity, and inflammation-associated disorders. On the other hand, TGF-β/Smad3 signaling is crucial in NAFLD/NASH pathogenesis, driving liver inflammation, fibrosis, and injury. Targeting this pathway could offer therapeutic strategies for the treatment of NAFLD and NASH and the prevention of progression to severe liver diseases. However, further research is needed to better comprehend the precise mechanisms of action and potential therapeutic applications of these compounds and pathways.
2. Methods
A high-fat emulsion (HF) was prepared for NASH induction, containing 77% of calories from fat, 9% from carbohydrates, and 14% from protein-enriched whole milk powder (Appendix 1 in Supplementary File), following the protocol by Hotamisligil et al. (20). The mixture was stored at 4°C and warmed to 42°C daily for fluidity maintenance.
Resveratrol was sourced from Sigma-Aldrich, USA, and SARO was obtained from Ahmedabad, India. Male Wistar rats (weight: 180 - 200 g) were obtained from the Experimental Animal Center at Ahvaz Jundishapur University of Medical Sciences, Ahvaz, Iran. The rats were acclimated for 1 week in a controlled environment before the study. Animal research followed ethical standards and guidelines.
A total of 40 rats were divided into a normal control group (n = 8) and an HF group (n = 32). The HF group received a high-fat diet (HFD) and 18% saccharose water for 7 weeks to induce NASH. After model validation, pharmacological treatments were initiated in the eighth week and continued for 6 weeks. The HF group was further divided into six subgroups, with the first receiving 0.5% sodium carboxymethyl cellulose (CMC) solution as control and others receiving different treatments. The second group was given an HFD with 100 mg/kg of their weight; the third group was given an HFD with 3 mg/kg/day of their weight of SARO; the fourth group was given an HFD with 100 mg/kg/day of their weight of RES; the fifth group was given an HFD with 3 mg/kg of their weight of SARO plus 100 mg/kg/day of RES. After the treatment, the rats were fasted for 15 hours, anesthetized, and sacrificed. Blood samples and tissues from the liver were collected for gene expression and histological evaluation. The liver score has been determined by dividing liver weight by body weight and multiplying by 100.
2.1. Biochemical Analyses
The serum concentrations of liver enzymes alanine aminotransferase (ALT) and aspartate aminotransferase (AST) and lipid profiles of high-density lipoprotein cholesterol (HDL-C) and low-density lipoprotein cholesterol (LDL-C) were measured with a Roche 6000 auto-analyzer (Switzerland) and related test kits. Total serum AST and ALT levels were determined through enzymatic colorimetric kits based on a kinetic rate reaction that measures the decrease in absorbance of NADH at 340 nm (Pars Azmun, Iran); however, concentrations of LDL-C and HDL-C were measured using an enzymatic colorimetric assay, which is based on cholesterol esterase and cholesterol oxidase. The color change was then measured by the absorbance of NADH at 600 - 700 nm.
2.2. Cellular Detection of Reactive Oxygen Species (ROS) Generation
In the present investigation, a dichlorofluorescein-based ROS detection kit (Kiazist, Iran) was utilized to identify reactive species. This compound permeates living cells, undergoes intracellular esterase enzyme-mediated de-esterification, and becomes entrapped within the cell. Upon reduction by ROS, the compound exhibits fluorescence. The ensuing fluorophore can be detected at excitation and emission wavelengths of 525 nm and 485 nm, respectively, employing a plate fluorimeter.
2.3. Analysis of Gene Expression
Real-time polymerase chain reaction (PCR) was used to investigate gene expression by using the primer sequences (Appendix 2 in Supplementary File). Ribonucleic acid (RNA) was extracted from frozen liver samples using the RNA FastPureTM kit (Takara Bio, Otsu, Japan) and reverse transcribed with the PrimeScript RT reagent kit (Takara Bio, Otsu, Japan). The QuantStudio™ Real-Time PCR System (ABI Applied Biosystems, USA) was employed for real-time PCR. Glyceraldehyde 3-phosphate dehydrogenase (GAPDH) expression was used as an internal reference, and relative quantification was performed using Applied Biosystems software (v 1.3.1).
2.4. Histopathological Assessments
The liver tissue samples were dehydrated, embedded in paraffin wax, and sectioned (6 - 7 μm). The sections were stained with hematoxylin and eosin (H & E). A liver specialist pathologist, blind to experimental details, evaluated histological changes. The NASH activity score (NAS) by Kleiner et al. (21, 22) was used to grade and score steatosis and other pathological alterations.
2.5. Western Blot Analysis
Subsequent to rinsing with phosphate-buffered saline, liver tissue was lysed using radioimmunoprecipitation assay (RIPA) buffer containing protease inhibitors. Protein concentration was ascertained with a bicinchoninic acid (BCA) assay kit (Thermo Fisher Scientific, USA). The isolated proteins were transferred to a polyvinylidene fluoride membrane (Millipore, USA), which was then incubated with antibodies targeting TGF-β and p-Smad3 (Cell Signaling, USA). Protein bands were detected by applying an electrochemiluminescence (ECL) detection kit (GE Healthcare, Chicago, IL, USA).
2.6. Statistical Examination
GraphPad Prism version 8.0.2 (GraphPad Software, USA) was utilized for data analysis. Analysis of variance (ANOVA) was conducted, followed by Tukey’s post-hoc test. A significance level of 0.05 was used, indicating that a P-value less than this threshold was considered statistically significant.
3. Results
3.1. Modifications in Body Mass and Liver Index as a Result of Therapies
The initial body weights of the groups did not show notable differences. However, after 13 weeks of HFD treatment, the rats showed a statistically significant elevation in both body weight and liver triglycerides (TG) compared to the normal control (NC) group. Six weeks of treatment with SARO and RES led to a considerable reduction in body weight and liver weight, with the combination group (RES and SARO) being the most effective, as shown in Figure 1A, B, and C. The examination of liver tissue through histopathological evaluation revealed that rats that were solely nourished with an HFD exhibited a significant increase in the development of hepatic steatosis (P < 0.05). The utilization of the H & E staining technique in the sections of the liver (as depicted in Figure 1D) revealed a noteworthy reversal of steatosis induced by an HFD upon the intragastric administration of RES and SARO.
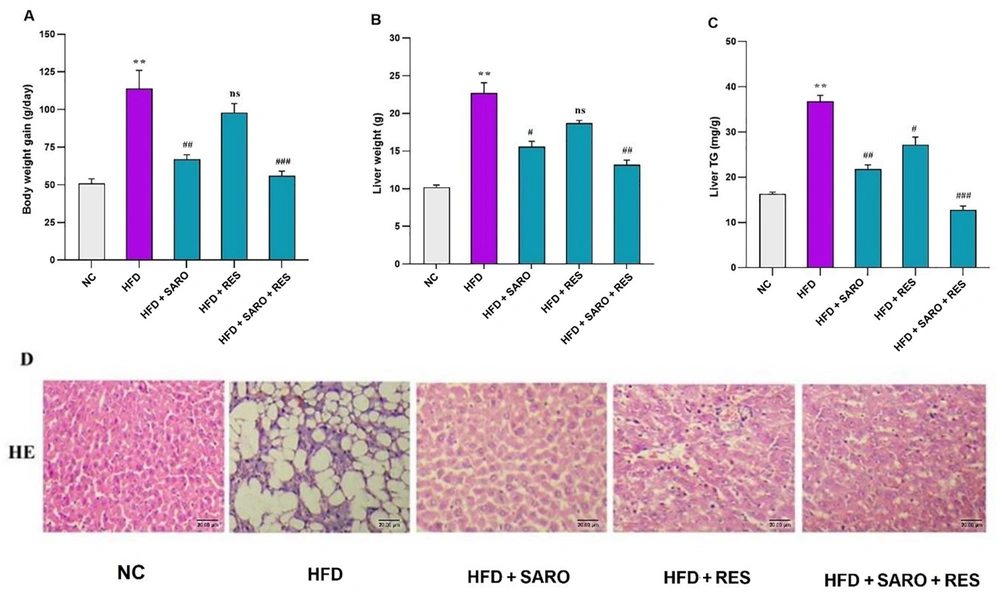
Figure 1.
Effects of saroglitazar (SARO), resveratrol (RES), and the combination of RES and SARO on body weight (A); liver weight (B); and liver triglycerides (C) in rats after high-fat emulsion and drug administration; hematoxylin and eosin staining of liver tissue samples (D). The data values are presented as mean ± standard deviation (SD) (n = 8). Significant differences between HFD and NC (P < 0.05) are indicated by *, and significant differences between HFD and other groups are indicated by #P < 0.05, ##P < 0.01, and ###P < 0.001. NC, control group; HFD, high-fat diet; SARO, saroglitazar; RES, resveratrol.
3.2. Decrease in Liver Enzymes and Lipids by the RES and SARO Combination in the NASH Model
The combination group (RES and SARO) significantly reduced ALT and AST levels (Figure 2A and B) and HDL-C and LDL-C in rats (Figure 2C and D), compared to the HFD group. The combined treatment was more effective in restoring normal levels of ALT, AST, and lipid profiles (P < 0.05).
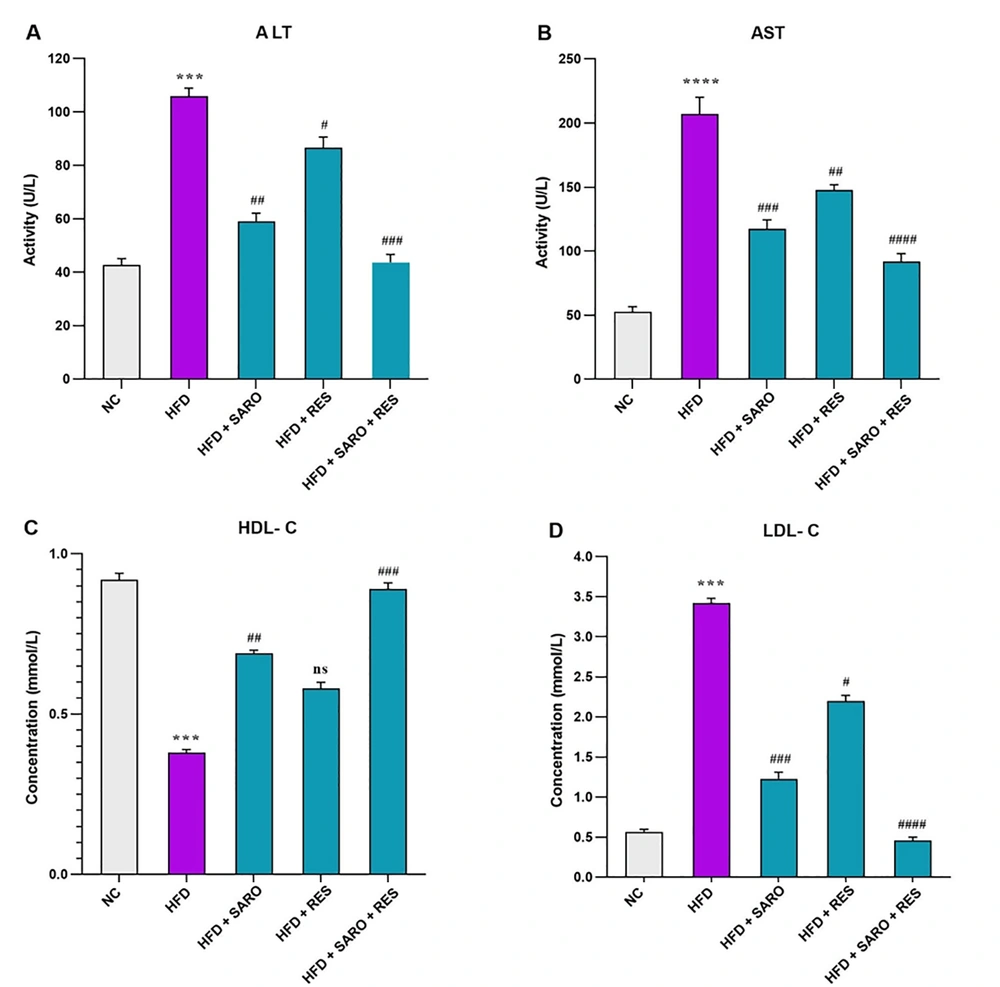
Figure 2.
Serum levels of alanine aminotransferase (ALT), aspartate aminotransferase (AST), high-density lipoprotein (HDL), and low-density lipoprotein (LDL) after high-fat emulsion and drug administration. Mean values between different groups were analyzed using the one-way analysis of variance (ANOVA) with the Tukey-Kramer post-hoc test. Data values are presented as mean ± standard deviation (SD). Significant differences between HFD and NC (P < 0.05) are indicated by *, and significant differences between HFD and other groups are indicated by #P < 0.05, ##P < 0.01, ###P < 0.001, and ####P < 0.0001. NC, control group; HFD, high-fat diet; SARO, saroglitazar; RES, resveratrol; AST, aspartate aminotransferase; ALT, alanine aminotransferase; HDL-C, high-density lipoprotein cholesterol; LDL-C, low-density lipoprotein cholesterol.
3.3. Regulation of Lipid-Related Gene Expression by the RES and SARO Combination
In the group treated with the combination (RES and SARO), there was a substantial decrease in the hepatic messenger RNA (mRNA) expression of genes that are involved in the storage and mobilization of lipids, including SREBP-1C (fold change: 1.92), FAS (fold change: 1.43), ACC (fold change: 1.6) (Figure 3A, B, and C), PPARγ (fold change: 1.1), and CPT-1 α (fold change: 0.93), and an increase in the gene expression of PPARα (fold change: 0.91) (Figure 3D, E, and F), as indicated by statistical significance. Gene expression analysis was conducted by comparing the HFD group to the control group. Furthermore, the FAS and ACC gene expressions in the SARO group were also observed to be statistically significant. The PPARγ gene expression displayed notably lower levels in both the RES and SARO groups; however, PPARα showed higher levels in these groups. However, the RES group did not show any significant differences in the gene expression of SREBP-1C, FAS, ACC, and CPT-1 α (P < 0.05).
![Expression of SREBP-1c, FAS, ACC, PPARγ, PPARα, and CPT-1α in liver tissue after high-fat emulsion and drug administration. Relative gene expression at mRNA levels was evaluated by real-time PCR, and results were normalized to the GAPDH signal. The 2<sup>-ΔΔCT</sup> formula was used to determine fold change in each group (mean ± standard deviation [SD]). Significant differences between HFD and NC (P < 0.05) are indicated by *, and significant differences between HFD and other groups are indicated by #P < 0.05, ##P < 0.01, ###P < 0.001, and ####P < 0.0001. NC, control group; HFD, high-fat diet; SARO, saroglitazar; RES, resveratrol.](https://brieflands.com/journals/hepatmon/articles/138237/figures/hepatmon-138237-i003-F3-preview.webp "Expression of SREBP-1c, FAS, ACC, PPARγ, PPARα, and CPT-1α in liver tissue after high-fat emulsion and drug administration. Relative gene expression at mRNA levels was evaluated by real-time PCR, and results were normalized to the GAPDH signal. The 2<sup>-ΔΔCT</sup> formula was used to determine fold change in each group (mean ± standard deviation [SD]). Significant differences between HFD and NC (P < 0.05) are indicated by *, and significant differences between HFD and other groups are indicated by #P < 0.05, ##P < 0.01, ###P < 0.001, and ####P < 0.0001. NC, control group; HFD, high-fat diet; SARO, saroglitazar; RES, resveratrol.")
Figure 3.
Expression of SREBP-1c, FAS, ACC, PPARγ, PPARα, and CPT-1α in liver tissue after high-fat emulsion and drug administration. Relative gene expression at mRNA levels was evaluated by real-time PCR, and results were normalized to the GAPDH signal. The 2-ΔΔCT formula was used to determine fold change in each group (mean ± standard deviation [SD]). Significant differences between HFD and NC (P < 0.05) are indicated by *, and significant differences between HFD and other groups are indicated by #P < 0.05, ##P < 0.01, ###P < 0.001, and ####P < 0.0001. NC, control group; HFD, high-fat diet; SARO, saroglitazar; RES, resveratrol.
3.4. Modulation of Pro-inflammatory mRNA Expression by the RES and SARO Combination
The combined treatment of RES and SARO led to a notable reduction in inflammatory factors, such as IL-1β (fold change: 1.44), IL-6 (fold change: 1.89) (Figure 4A and B), and TNF-α (fold change: 1.7), and TGF-β1 (fold change: 1.62) (Figure 4C and D). The gene expression profiles were compared between the HFD and control groups, revealing no significant change in IL-1β and TNF-α gene expression in the RES group. However, in both groups, the IL-1β and SARO groups, there was a significant decrease in the gene expression of IL-1β, TNF-α, IL-6, and TGF-β1. The results indicated that the combined treatment group showed a more pronounced decrease in the expression of IL-6 and IL-1β genes than the groups receiving individual treatments (P < 0.05).
![Expression of pro-inflammatory cytokines interleukin (IL)-1β, IL-6, tumor necrosis factor-alpha (TNF-α), and transforming growth factor-beta 1 (TGF-β1) in liver tissue following high-fat emulsion and drug administration. Relative gene expression at mRNA levels was evaluated by real-time PCR, and results were normalized to the GAPDH signal. The 2<sup>-ΔΔCT</sup> formula was used to determine fold change in each group (mean ± standard deviation [SD]). Significant differences between HFD and NC (P < 0.05) are indicated by *, and significant differences between HFD and other groups are indicated by #P < 0.05, ##P < 0.01, ###P < 0.001, and ####P < 0.0001. NC, control group; HFD, high-fat diet; SARO, saroglitazar; RES, resveratrol; TNF-α, tumor necrosis factor-alpha; TGF-β1, transforming growth factor-beta 1; IL-1β, interleukin 1beta; IL-6, interleukin 6.](https://brieflands.com/journals/hepatmon/articles/138237/figures/hepatmon-138237-i004-F4-preview.webp "Expression of pro-inflammatory cytokines interleukin (IL)-1β, IL-6, tumor necrosis factor-alpha (TNF-α), and transforming growth factor-beta 1 (TGF-β1) in liver tissue following high-fat emulsion and drug administration. Relative gene expression at mRNA levels was evaluated by real-time PCR, and results were normalized to the GAPDH signal. The 2<sup>-ΔΔCT</sup> formula was used to determine fold change in each group (mean ± standard deviation [SD]). Significant differences between HFD and NC (P < 0.05) are indicated by *, and significant differences between HFD and other groups are indicated by #P < 0.05, ##P < 0.01, ###P < 0.001, and ####P < 0.0001. NC, control group; HFD, high-fat diet; SARO, saroglitazar; RES, resveratrol; TNF-α, tumor necrosis factor-alpha; TGF-β1, transforming growth factor-beta 1; IL-1β, interleukin 1beta; IL-6, interleukin 6.")
Figure 4.
Expression of pro-inflammatory cytokines interleukin (IL)-1β, IL-6, tumor necrosis factor-alpha (TNF-α), and transforming growth factor-beta 1 (TGF-β1) in liver tissue following high-fat emulsion and drug administration. Relative gene expression at mRNA levels was evaluated by real-time PCR, and results were normalized to the GAPDH signal. The 2-ΔΔCT formula was used to determine fold change in each group (mean ± standard deviation [SD]). Significant differences between HFD and NC (P < 0.05) are indicated by *, and significant differences between HFD and other groups are indicated by #P < 0.05, ##P < 0.01, ###P < 0.001, and ####P < 0.0001. NC, control group; HFD, high-fat diet; SARO, saroglitazar; RES, resveratrol; TNF-α, tumor necrosis factor-alpha; TGF-β1, transforming growth factor-beta 1; IL-1β, interleukin 1beta; IL-6, interleukin 6.
3.5. Decrease in Oxidative Stress and Related Gene Expression due to the Combination of RES and SARO
The combined RES and SARO group showed significant alterations in the gene expression of oxidative stress and ROS, including nicotinamide adenine dinucleotide phosphate oxidases (NOX), NOX1 (fold change: 1.56), NOX2 (fold change: 1.34), NOX4 (fold change: 2.23), and ROS (fold change: 1.23) (Figure 5). The gene expression data from the HFD group were contrasted with those of the control group. Notably, NOX2 gene expression was substantially reduced in the combined RES and SARO group (Figure 5B). The NOX4 and NOX1 gene expression was significant in the combined RES and SARO group (Figure 5C and A). Furthermore, NOX2 gene expression was significant in both the SARO and RES groups independently (Figure 5B), akin to ROS levels in the SARO group (Figure 5D) (P < 0.05).
![Gene expression levels of related genes and detection of reactive oxygen species (ROS) in the combination group (saroglitazar [SARO] + resveratrol [RES]) treatment. Hepatic mRNA levels were evaluated using quantitative real-time PCR and normalized to GAPDH mRNA expression. Values are presented as the mean ± standard deviation of fold changes compared to the NC. Analysis of variance (ANOVA), followed by the Tukey-Kramer multiple comparisons test, was used to examine between-group differences. Significant differences between HFD and NC (P < 0.05) are indicated by *, and significant differences between HFD and other groups are indicated by #P < 0.05, ##P < 0.01, ###P < 0.001, and ####P < 0.0001. NC, control group; HFD, high-fat diet; SARO, saroglitazar; RES, resveratrol; ROS, reactive oxygen species; NOX1, 2, 4 (nicotinamide adenine dinucleotide phosphate oxidase)](https://brieflands.com/journals/hepatmon/articles/138237/figures/hepatmon-138237-i005-F5-preview.webp "Gene expression levels of related genes and detection of reactive oxygen species (ROS) in the combination group (saroglitazar [SARO] + resveratrol [RES]) treatment. Hepatic mRNA levels were evaluated using quantitative real-time PCR and normalized to GAPDH mRNA expression. Values are presented as the mean ± standard deviation of fold changes compared to the NC. Analysis of variance (ANOVA), followed by the Tukey-Kramer multiple comparisons test, was used to examine between-group differences. Significant differences between HFD and NC (P < 0.05) are indicated by *, and significant differences between HFD and other groups are indicated by #P < 0.05, ##P < 0.01, ###P < 0.001, and ####P < 0.0001. NC, control group; HFD, high-fat diet; SARO, saroglitazar; RES, resveratrol; ROS, reactive oxygen species; NOX1, 2, 4 (nicotinamide adenine dinucleotide phosphate oxidase)")
Figure 5.
Gene expression levels of related genes and detection of reactive oxygen species (ROS) in the combination group (saroglitazar [SARO] + resveratrol [RES]) treatment. Hepatic mRNA levels were evaluated using quantitative real-time PCR and normalized to GAPDH mRNA expression. Values are presented as the mean ± standard deviation of fold changes compared to the NC. Analysis of variance (ANOVA), followed by the Tukey-Kramer multiple comparisons test, was used to examine between-group differences. Significant differences between HFD and NC (P < 0.05) are indicated by *, and significant differences between HFD and other groups are indicated by #P < 0.05, ##P < 0.01, ###P < 0.001, and ####P < 0.0001. NC, control group; HFD, high-fat diet; SARO, saroglitazar; RES, resveratrol; ROS, reactive oxygen species; NOX1, 2, 4 (nicotinamide adenine dinucleotide phosphate oxidase)
3.6. Inhibition of Expression of TGF-β1 and p-Smad3 Proteins by the RES and SARO Combination
In the combined group, a markedly significant decrease in TGF-β (fold change: 0.41) and p-Smad3 protein expression (fold change: 1.26) was detected (Figure 6A, B, and C). Protein expression was also reduced in the SARO group for TGF-β1 and p-Smad3, and similar decreases were apparent in the RES group for TGF-β1 and p-Smad3 expression (P < 0.05).
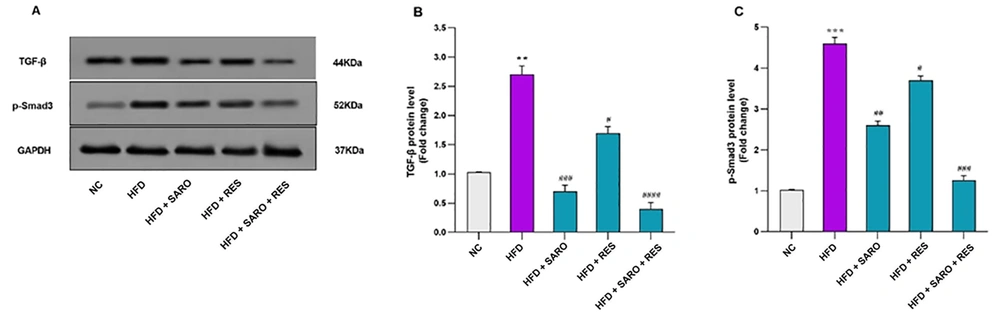
Figure 6.
Protein expression levels of transforming growth factor-beta 1 (TGF-β) and P-Smad3. Glyceraldehyde 3-phosphate dehydrogenase (GAPDH) was used as the loading control. Protein levels of p-Smad3 in control and treated cells were quantified using ImageJ software (v1.52) and normalized to GAPDH band intensity. Values are expressed as mean ± standard deviation (SD). Significant differences between HFD and NC (P < 0.05) are indicated by *, and significant differences between HFD and other groups are indicated by #P < 0.05, ##P < 0.01, ###P < 0.001, and ####P < 0.0001. NC, control group; HFD, high-fat diet; SARO, saroglitazar; RES, resveratrol; TGF-β1, transforming growth factor-beta 1; GAPDH, glyceraldehyde 3-phosphate dehydrogenase.
4. Discussion
The PPARs perform important roles in altering inflammation, lipid and glucose homeostasis, and fibrosis, all of which are closely associated with NASH (23). Moreover, the AMPK-PPAR axis is vital for lipid metabolism (15, 24). The present study showed that combining RES and SARO might activate this axis, resulting in a significant reduction in the activity of SREBP-1c, FAS, ACC, and PPAR γ; however, it elevated the activity of PPAR α and CPT-1α. These findings align with the findings of Kumar et al., who demonstrated that the use of SARO, a PPAR α/γ agonist, can effectively decrease insulin resistance and steatohepatitis in an animal model of NFLD induced by following a diet (25).
The intricate and multifactorial relationship between inflammatory agents, including IL-1β, TNF-α, IL-6, and TGF-β, and the pathogenesis of NAFLD and NASH involves promoting insulin resistance, inflammation, and fibrosis (26, 27). Additional investigation is required to enhance the comprehension of the role of these cytokines in NAFLD and NASH and to identify novel therapeutic targets (25, 28). The current study’s results indicated that RES and SARO significantly inhibit the production of these cytokines in a mouse model of NASH, which is consistent with the results of a study by Akbari et al., who demonstrated that SARO alleviated hepatic steatosis and fibrosis in a NASH animal-model by regulating inflammatory responses (16).
The present study investigated the potential of a RES-SARO combination as a treatment for HFD-induced NAFLD. The combination group showed promising results, including reduced blood and hepatic lipids, attenuated weight gain, and decreased inflammation. These outcomes suggest that the combined effects of RES and SARO might positively impact hepatic lipid metabolism, anti-inflammatory responses, and antioxidation activity. The current study’s results also showed that RES and SARO significantly reduced hepatic lipid accumulation and oxidative stress, with a concomitant decrease in TGF-β1 gene expression and protein and its downstream effectors, indicating a potential role for the combination group in mitigating fibrosis in NAFLD, in line with previous research (16). These findings highlight the RES-SARO combination as a promising therapeutic agent for NAFLD management and suggest that the next phase of the study should concentrate on elucidating the underlying molecular mechanisms of RES and its effects on hepatic lipid metabolism and fibrosis.
The present investigation into cytokine gene expression also yielded promising results, suggesting that a group of cytokines might have the potential to reverse NAFLD and restore hepatic function. Notably, the rate-regulating enzyme ACC plays a crucial role in fatty acid production and oxidation within hepatocytes, as it is downstream of AMPK. Resveratrol has been shown to activate AMPK, leading to increased phosphorylation of ACC and decreased enzyme activity (29). These effects result in reduced fatty acid production and increased fat burning. Additionally, SREBP-1c, FAS, and CPT-1α are involved in de novo lipogenesis, fatty acid production, and the transfer of fatty acids to the oxidation apparatus, respectively, consistent with previous findings by Andrade et al., who reported the impact of RES on NFLD (30).
Quantitative histological evaluations and H & E staining revealed significant antisteatotic and antifibrotic effects of RES and SARO. The elimination of lipid droplets and collagen aggregates in the liver further supported the aforementioned findings. Although SARO is a PPAR agonist and each treatment group could provide some benefits independently, the combined group’s effects were considerably more pronounced, aligning with previous studies by Akbari et al. and Andrade et al. (16, 30).
In the current study, a notable reduction in the serum concentrations of AST and ALT, which are NASH indicators, was observed after 6 weeks of combination group (RES and SARO) treatment, compared to individual treatments with RES or SARO. The aforementioned results are consistent with the results of previous clinical investigations (31, 32) reporting that the dual agonist SARO reduced liver enzyme levels in individuals with NAFLD and diabetic dyslipidemia. Furthermore, the current study’s findings showed that the combined therapy stabilized body weight, liver weight, and liver index. In rats with NAFLD, the glycemic index, blood lipids, and body weight improved following treatment with the combined group. The present study’s results concur with previous findings (33), indicating that the dual PPAR α/γ agonist SARO improves liver histology and biochemistry in animal NASH models.
A direct association exists between ROS and HSC activation. Reactive oxygen species are primarily produced by NOX and the cytochrome P450 (CYP450) family of enzymes. Reactive oxygen species participate in the TGF-β signaling system, facilitating a vicious cycle that promotes fibrosis. Elevated ROS levels contribute to the activation of the TGF-β/SMAD3 pathway, subsequently causing an upregulation of extracellular matrix proteins and enhancing fibrosis. Furthermore, ROS plays a role in the TGF-β/SMAD3 signaling pathway mechanism, perpetuating a detrimental cycle that exacerbates fibrotic processes. Non-alcoholic fatty liver disease has been linked to increased NOX1 expression, which impairs hepatic microcirculation. The present study’s findings showed that ROS and the NOX family were reduced in the combined treatment group, suggesting that the RES-SARO combination protected liver cells from damage by decreasing oxidative stress and restoring antioxidant enzymes. The current study’s findings are consistent with the findings of another study (34), which demonstrated that polyphenols decrease the activity of ROS and the NOX family.
Kupffer cells (KCs) are known to have a crucial function in the advancement of NAFLD toward NASH by generating inflammatory factors and oxidative stress. In HFD-induced rat models, activated KCs are correlated with hepatic lipid accumulation. Transforming growth factor-beta, a growth factor produced by KCs is a key factor in promoting fibrosis through the activation of Smad3 signaling pathways (35-37). The present study indicates that the combination of RES and SARO can attenuate systemic inflammation by inhibiting the TGF-β pathway. The combination group demonstrated the ability to decrease TGF-β gene expression and protein and inhibit the TGF-β pathway by suppressing Smad3 phosphorylation in HFD-induced rats, resulting in reduced NASH. The current study’s results showed that the downregulation of TGF-β-Smad3 signaling aligns with the findings of a study by Qian Chen et al. in an HFD-induced in vivo model (38).
4.1. Conclusions
The current study highlights the potential of a RES-SARO combination as an effective therapeutic approach for HFD-induced NAFLD. The combined treatment demonstrated significant improvements in hepatic lipid metabolism, anti-inflammatory responses, antioxidation, and fibrosis attenuation. The results of the present study indicated that the synergistic effects of RES and SARO might provide a promising strategy for NAFLD management by targeting multiple underlying molecular mechanisms. This synergistic effect could be due to the suppression of TGF-β-Smad3 signaling pathways. Future studies should focus on elucidating the specific molecular interactions of RES and SARO and validating these results in clinical settings. Ultimately, this study has the potential to aid in the development of innovative therapeutic approaches aimed at preventing and treating NAFLD and its progression to NASH.