
1. Background
Herbal medicines have been used for centuries to prevent and treat a wide range of diseases, and their global acceptance has grown significantly in recent years because of increasing interest in natural and safer therapeutic alternatives. To ensure the quality, safety, and efficacy of herbal drugs, proper standardization of medicinal plants is essential. This involves a systematic assessment of morphological, anatomical, physicochemical, and phytochemical parameters, which together serve as reliable tools for quality control of both raw plant materials and finished herbal formulations (1).
Crataeva nurvala Buch.-Ham., commonly known as Varuna, is a well-established medicinal plant in Ayurveda and is traditionally used for the management of urinary disorders, renal ailments, and inflammatory conditions (2). Its therapeutic effects are mainly attributed to a diverse range of bioactive phytoconstituents, including flavonoids, alkaloids, tannins, and phenolic compounds, which collectively contribute to its pharmacological properties (3). Among these, quercetin is considered an important flavonoid marker because of its proven antioxidant and anti-inflammatory activities and is widely used in phytochemical standardization studies (4).
Despite strong traditional use and experimental evidence supporting the medicinal value of Varuna, detailed pharmacognostical and analytical standardization of its leaves remains limited, highlighting the need for systematic evaluation. HPTLC is a widely used tool for developing chemical fingerprints of herbal drugs and plays an important role in quality assessment (5, 6). It helps generate characteristic extract profiles that can serve as reference standards for authentication and comparative phytochemical analysis.
2. Objectives
This study addressed the limited integrated standardization of C. nurvala (Varuna) leaves by combining pharmacognostic evaluation, physicochemical analysis, preliminary phytochemical screening, and HPTLC fingerprinting using quercetin as a marker, thereby providing a basis for quality control.
3. Methods
3.1. Plant Material Collection and Authentication
Varuna leaves (C. nurvala Buch.-Ham.) were obtained from a local merchant in Wardha, Maharashtra. A herbarium specimen was prepared to ensure accurate identification and authentication of the plant material. The Botanical Survey of India, Western Regional Centre, Pune, taxonomically recognized and authenticated the sample under Authentication No. BSI/WRC/PII/Id.2025/MYK/20, dated May 21, 2025.
All physicochemical parameters were analyzed using standard pharmacopoeial methods. HPTLC fingerprinting was carried out in a single run for qualitative profiling. The results are presented as obtained from the accredited laboratory report. No statistical analysis was performed because the study focused on standardization and qualitative evaluation.
3.2. Sample Preparation of Plant Material
The plant material and its powdered forms were stored in sealed, light-protected containers at room temperature according to the guidelines of the Ayurvedic Pharmacopoeia of India (7, 8). Both coarse and fine powders were then used for further analysis, including powder microscopy, physicochemical evaluation, phytochemical screening, and chromatographic studies using standard methods.
3.3. Pharmacognostic Evaluation
3.3.1. Macroscopic Examination of Plant Material
3.3.2. Transverse Section Microscopy
The leaf sample was thoroughly washed and sectioned using a sharp diamond-edged blade. Temporary mounts were prepared and observed under a digital trinocular compound microscope (Olympus CX21i with Magcam DC14), and photomicrographs were captured to document key diagnostic features (9).
3.3.3. Powder Microscopic Analysis
Diagnostic features were identified according to standard pharmacognostic references and compared with previous reports on Crataeva species. After passage through an 80-mesh screen, approximately 2 g of finely dried leaf powder was mounted using the smearing technique as both dry and wet preparations (50% glycerine). Photomicrographs were taken to record diagnostic microscopic features, and the mounts were inspected at 10x and 40x magnifications using a Zeiss AxioCam ICc5 microscope (9).
3.4. Physicochemical Evaluation of Varuna (Crataeva nurvala Buch.-Ham.) Leaf
The shade-dried leaves were powdered using a mechanical grinder. Physicochemical parameters were determined according to WHO (7) and Ayurvedic Pharmacopoeia of India guidelines. All determinations were performed in triplicate (10, 11).
3.4.1. Estimation of Moisture Content (Loss on Drying)
Five grams of the powdered sample were dried in an oven at 105 °C for 5 hours and weighed at 30-minute intervals until a constant weight was obtained (difference < 0.25%). Moisture content was calculated as the percentage loss in weight based on the difference between the initial and final weights.
3.4.2. Estimation of Ash Value
3.4.2.1. Total Ash
Acid-soluble ash was calculated by subtracting the acid-insoluble ash value from the total ash value. This represents the portion of inorganic constituents, mainly mineral matter, that is soluble in dilute acid.
3.4.2.2. Acid-Insoluble Ash
The total ash was treated with 25 mL of 2 M HCl and boiled for 5 minutes. The insoluble portion was filtered, washed with hot water, and ignited at ≤ 450 °C for 15 minutes. After cooling in a desiccator, it was weighed, and the acid-insoluble ash (%) was calculated with respect to the air-dried plant material.
3.4.2.3. Acid-Soluble Ash
The acid-soluble ash value was calculated by subtracting the acid-insoluble ash from the total ash percentage. This value indicates the proportion of inorganic constituents, mainly mineral matter, present in the sample that can dissolve in dilute acid.
3.4.2.4. Water-Soluble Ash
Total ash was boiled in 25 mL of water for 5 minutes; the insoluble residue was filtered, washed with hot water, ignited at ≤ 450 °C for 15 minutes, and weighed after cooling. Water-soluble ash was calculated as total ash minus insoluble residue. The percentage was then calculated as:
3.4.3. Estimation of Extractive Value
3.4.3.1. Alcohol-Soluble Extractive
Five grams of coarsely powdered, air-dried material were macerated in 100 mL of 95% ethanol for 24 hours, with shaking during the first 6 hours and standing for the remaining time. The extract was filtered, evaporated on a water bath, and oven-dried at 105 °C to a constant weight. The percentage alcohol-soluble extractive was calculated using the following formula:
3.4.3.2. Water-Soluble Extractive
Except for the substitution of distilled water for alcohol as the solvent, the process was identical to that used to determine the alcohol-soluble extractive value.
3.4.4. Estimation of Foreign Matter and pH
Foreign matter was determined by visual inspection and weighing. The pH of a 10% aqueous suspension was measured using a calibrated pH meter.
3.5. Preliminary Phytochemical Tests
3.5.1. Preparation of Plant Extract (Methanolic Extract)
Shade-dried Varuna leaves were finely powdered using a mechanical grinder. Approximately 5 g of the powder was macerated with 50 mL of methanol at room temperature for 24 - 48 hours with occasional shaking to ensure efficient extraction of phytoconstituents. The mixture was then filtered through Whatman No. 1 filter paper to obtain the methanolic extract for further qualitative analysis.
3.5.2. Tests for Alkaloids (Dragendorff's Test)
Two milliliters of Dragendorff's reagent, a combination of potassium iodide and bismuth subnitrate solution, were added to a test tube containing 2 mL of a 10% solution of powdered plant material. The presence of alkaloids was indicated by an orange precipitate.
3.5.3. Tests for Carbohydrates (Fehling's Test)
Reducing sugars were tested using Fehling's test. Fresh Fehling's reagent was prepared by mixing equal parts of copper sulfate solution and sodium potassium tartrate solution. After adding the aqueous plant extract and heating it in a water bath for 5 - 10 minutes, a reddish-brown precipitate indicated the presence of reducing sugars.
3.5.4. Tests for Saponins (Foam Test)
To test for saponins, 1 mL of the aqueous extract was combined with 10 mL of distilled water in a graduated cylinder and shaken for 15 minutes. Formation of a stable 1-cm foam layer confirmed the presence of saponins.
3.5.5. Tests for Tannins (Ferric Chloride Test)
A test solution was prepared with 90% alcohol and 5% ferric chloride. A few drops were added to 2 mL of the plant powder-water mixture; a deep blue or dark green color indicated the presence of tannins.
3.5.6. Tests for Flavonoids (Shinoda Test)
A small amount of magnesium metal was added to 1 mL of the methanol extract, followed by strong HCl. The appearance of a pink, red, or orange color indicated the presence of flavonoids.
3.5.7. Tests for Glycosides (Keller-Killiani Test)
To test for cardiac glycosides, 2 mL of extract was combined with 2 mL of glacial acetic acid plus a trace of ferric chloride. Strong sulfuric acid was gently added along the wall of the tube to create two layers. If deoxy sugars were present, a brown ring formed at the interface, and bluish-green tints appeared in the upper layer.
3.5.8. Tests for Steroids (Salkowski Test)
One milliliter of 10% plant powder solution was mixed with 2 mL of chloroform and 2 mL of concentrated sulfuric acid, which was poured gently down the side of the tube. The mixture was shaken for a few minutes. Development of a red color confirmed the presence of sterols.
3.5.9. Tests for Amino Acids (Ninhydrin Test)
The ninhydrin test detects free amino groups in amino acids and proteins. Heating the mixture produces a characteristic deep blue, or occasionally pale yellow, color as ninhydrin reacts with the nitrogen of the amino group.
3.5.10. Tests for Proteins (Biuret Test)
A lead acetate test was used to check for sulfur-containing amino acids in the plant proteins. After mixing 1 mL of 10% plant extract with 2 mL of 10% NaOH and a few drops of lead acetate, followed by brief heating on a water bath, a dark precipitate formed, indicating that sulfur-containing amino acids, such as cysteine, were present.
3.5.11. Tests for Fats and Oils (Filter Paper Test)
A small amount of the extract residue was applied to a piece of filter paper and allowed to dry. The presence of fats and oils was confirmed when a permanent transparent or greasy patch appeared.
3.6. Fingerprint Analysis by HPTLC
HPTLC analysis of Varuna leaf extract was performed using CAMAG equipment to study its phytochemical pattern and compare it with standard quercetin. The samples (extract and quercetin) were applied as narrow bands on silica gel 60 F254 TLC plates with a Linomat 5 applicator, using 2 µL and 4 µL volumes. The plates were developed in a twin-trough chamber with toluene:ethyl acetate (7:3) as the mobile phase up to 70 mm and scanned at 254 nm and 366 nm using a CAMAG TLC scanner (12-14). Chamber saturation time was 20 minutes; plate activation was performed at 110 °C for 5 minutes; and the controlled temperature was 25 ± 2 °C.
3.7. Ethical Statement
This study analyzed plant material (Crataeva nurvala) only and did not involve human or animal subjects; therefore, ethical approval was not required.
3.8. Statistical Analysis
Physicochemical parameters were determined using standard methods and reported as single values from an accredited laboratory (Qualichem Laboratories, Report No. M/1873/25-26). HPTLC densitometric analysis was performed at 254 nm and 366 nm using CAMAG winCATS software. Identification of quercetin was based on comparison of Rf values and peak area. Percentage relative standard deviation (%RSD) was not calculated because the analysis was conducted as a single qualitative run.
4. Result
4.1. Macroscopic Characters
Crataeva nurvala (Varuna) is a medium-sized deciduous tree with rough gray bark and a smooth inner surface. It has trifoliate leaves, white to cream-colored flowers, and ovoid fruits containing seeds in yellow pulp. Detailed features are shown in Table 1 and Figure 1 (15).
Table 1.
Organoleptic Features of Varuna (C. nurvala Buch.-Ham.) Leaf and Its Powder
| No. | Character | Varuna Leaf | Leaf Powder |
|---|---|---|---|
| 1 | Shabda | - | - |
| 2 | Sparsha | Soft and leathery | Fine to moderately coarse powder |
| 3 | Roopa | Green to dark green | Greenish brown |
| 4 | Rasa | Bitter and slightly astringent | Bitter |
| 5 | Gandha | Mild, characteristic, slightly pungent | Slightly aromatic, characteristic |
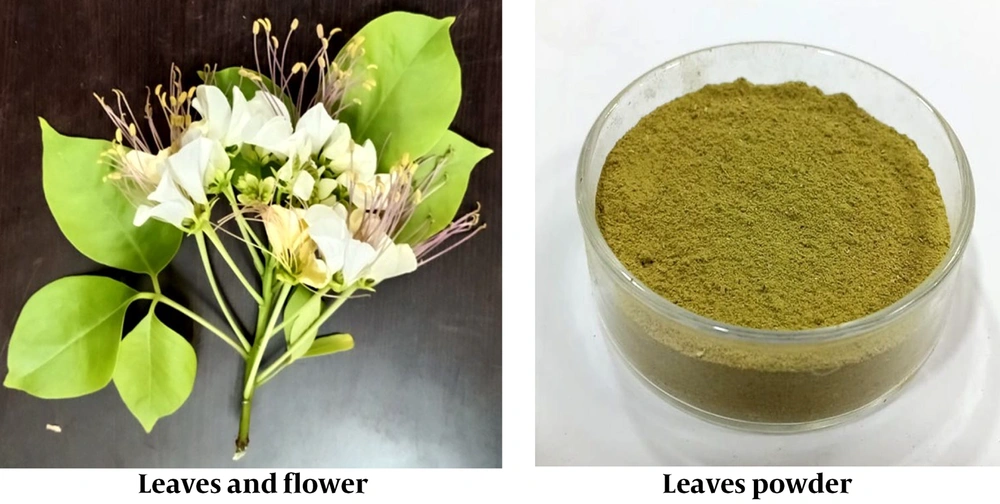
Figure 1.
Macroscopic features of varuna
4.2. Transverse Section Microscopy of Varuna (Crataeva nurvala Buch.-Ham.) Leaf
The transverse section of the leaf midrib showed a triangular upper midrib with a thick cuticular epidermis, elongated upper lamina cells, and lignified lower epidermal cells, along with underlying irregular parenchyma (Figure 2).
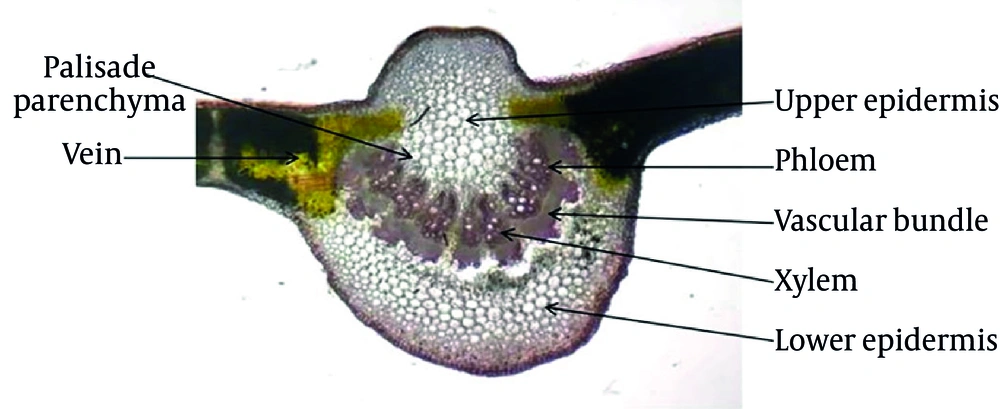
Figure 2.
Transverse section of varuna leaf showing palisade parenchyma, vein, upper epidermis, phloem, vascular bundle, xylem, and lower epidermis
4.3. Powder Microscopy
Microscopic examination of Varuna leaf powder confirmed its authenticity by showing characteristic features such as spiral xylem vessels, fibers, prismatic crystals, trichomes, palisade and spongy tissues, starch grains, and epidermal fragments (Figure 3).
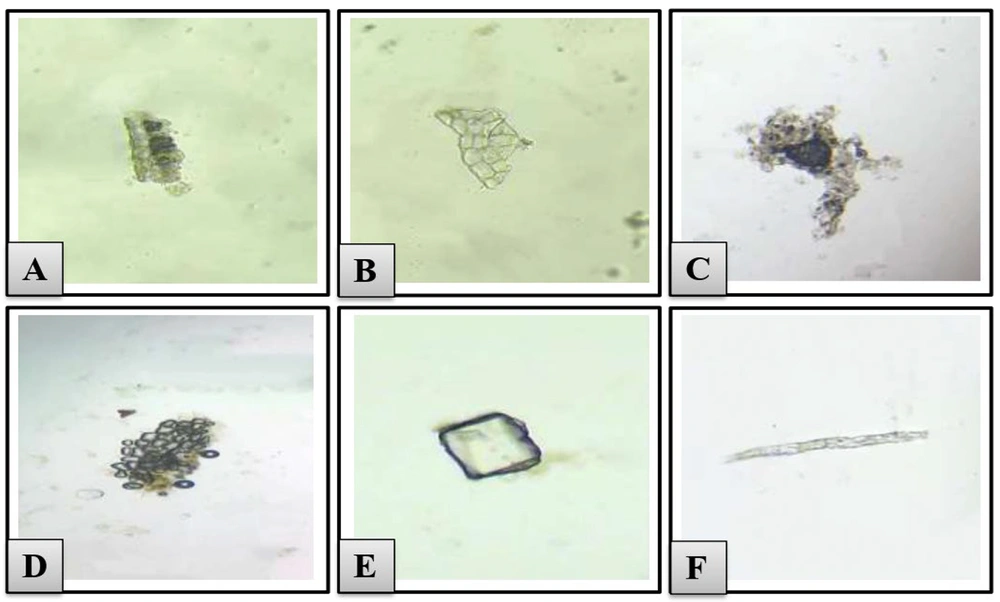
Figure 3.
Varuna leaf powder at 10× and 40× showing A, epidermis and palisade layer; B, parenchyma cells; C, spongy parenchyma tissue; D, starch grains; E, prismatic crystal; G, fibers.
4.4. Physicochemical Parameters
The physicochemical parameters for quality control of the plant material are presented in Table 2.
Table 2.
Physicochemical Observations of Varuna Leaf
| No. | Tests | Results (% w/w) |
|---|---|---|
| 1 | Acid-soluble ash | 16.46 |
| 2 | Total ash | 17.31 |
| 3 | Acid-insoluble ash | 0.85 |
| 4 | Foreign matter | 0.25 |
| 5 | Water-soluble extractive | 34.37 |
| 6 | Alcohol-soluble extractive | 19.82 |
| 7 | Water-soluble ash | 16.57 |
| 8 | Loss on drying at 105oC | 6.16 |
| 9 | pH of 10% aqueous solution | 7.01 |
4.5. Preliminary Phytochemical Analysis
Phytochemical screening of Varuna leaf extract was performed, and the results are shown in Table 3.
Table 3.
Phytochemical Observations of Varuna Leaf
| No. | Tests | Results |
|---|---|---|
| 1 | Test for alkaloids | +VE |
| 2 | Test for carbohydrate | +VE |
| 3 | Test for saponins | +VE |
| 4 | Test for tannins | +VE |
| 5 | Test for flavonoids | +VE |
| 6 | Test for glycosides | +VE |
| 7 | Test for steroids | +VE |
| 8 | Test for amino acids | +VE |
| 9 | Test for proteins | +VE |
| 10 | Test for fats and oils | +VE |
4.6. HPTLC Densitometric Fingerprint Profile
The HPTLC profiles of the Varuna leaf extract recorded at 254 and 366 nm showed multiple peaks. At 254 nm, Track 1 showed a prominent peak at Rf ~0.40 (43.10% area), and Track 2 showed a prominent peak at Rf ~0.73 (59.99% area). The quercetin standard showed bands in the Rf range of 0.36 - 0.39. At 366 nm, a strong dominant peak at Rf ~0.05 was observed in both Varuna tracks (90.44% and 75.13% area) and in the quercetin standard (~89% - 91%). The results suggest the presence of compounds with chromatographic behavior similar to quercetin (Figure 4 and Table 4).
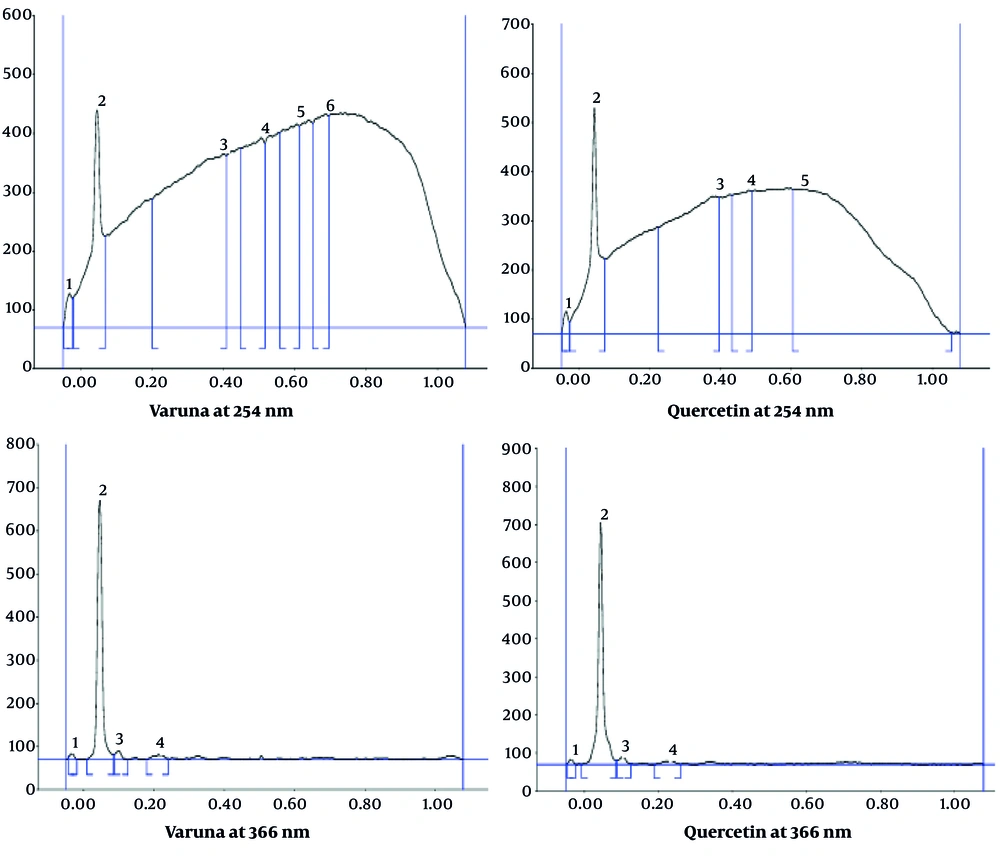
Figure 4.
HPTLC densitometric fingerprint profile
Table 4.
Densitometric HPTLC Fingerprint Profile of Varuna Leaf Extract Compared with the Quercetin Marker a
| Wavelengths and Tracks | Sample | No. of Peaks | Major (± 0.02) | Max Peak Area (%) | Remark |
|---|---|---|---|---|---|
| 254 nm | |||||
| T1 | Varuna | 6 | 0.40 | 43.10 | Predominant phytoconstituent |
| T2 | Varuna | 4 | 0.73 | 59.99 | Highly concentrated compound |
| T3 | Quercetin | 7 | 0.36 - 0.39 | 21.80 | Quercetin reference standard |
| T4 | Quercetin | 5 | 0.39 | 27.69 | Quercetin reference standard |
| 366 nm | |||||
| T1 | Varuna | 4 | 0.05 | 90.44 | A prominent fluorescent band was observed, suggesting the possible presence of flavonoids |
| T2 | Varuna | 5 | 0.05 | 75.13 | Major phytochemical constituent |
| T3 | Quercetin | 4 | 0.05 | 88.95 | Quercetin reference standard |
| T4 | Quercetin | 4 | 0.05 | 91.09 | Quercetin reference standard |
a Abbreviations: Rf, retardation factor; T, track. HPTLC analysis of Varuna leaf extract showed multiple peaks at 254 nm and a distinct band at Rf ~0.05 at 366 nm, with an Rf value comparable to that of the quercetin marker, suggesting the presence of related flavonoid-like phytoconstituents.
5. Discussion
The findings of this study on C. nurvala leaves are consistent with earlier reports on related species such as Crataeva magna and Crataeva religiosa, which showed similar pharmacognostic and phytochemical features. The slightly high total ash value may be due to the natural mineral content of the leaves. The low acid-insoluble ash value suggests minimal contamination. Overall, all physicochemical parameters were within acceptable limits, indicating good purity and quality of the sample. The toluene:ethyl acetate (7:3) solvent system showed clear HPTLC separation, with Rf values close to those of the quercetin marker, indicating the possible presence of flavonoids. Similar fluorescence under 366 nm further supports this finding. These flavonoids may contribute to the antioxidant and anti-inflammatory properties of Varuna, supporting its traditional use.
5.1. Limitations
The study was limited by single-batch analysis, lack of quantitative phytochemical estimation, absence of HPTLC validation, and no spectral confirmation.
5.2. Conclusions
This study provides preliminary pharmacognostic, physicochemical, and phytochemical data for the leaves of C. nurvala (Varuna). Macroscopic, microscopic, and physicochemical parameters were within acceptable limits. Preliminary phytochemical screening confirmed the presence of alkaloids, flavonoids, tannins, glycosides, proteins, steroids, and saponins. HPTLC fingerprinting produced a qualitative chemical profile showing multiple peaks with Rf values comparable to those of the quercetin marker, suggesting the possible presence of flavonoid-like compounds. These findings may serve as reference data for the identification and quality assessment of Varuna leaves. Further studies are required for quantitative estimation and full validation of the HPTLC method.