
1. Background
Chronic obstructive pulmonary disease (COPD) is a heterogeneous lung condition characterized by persistent and often progressive airflow obstruction due to airway abnormalities, including bronchitis and bronchiolitis, and/or alveolar abnormalities, such as emphysema. It results from gene-environment interactions (GETomics) and long-term exposure to risk factors such as smoking and environmental pollutants (1). In recent years, COPD has emerged as a major global public health challenge. The global prevalence among adults is estimated to range from 6% to 10%, and approximately 391.9 million people aged 30 to 79 years were diagnosed with COPD in 2019 (2). In 2021, COPD accounted for 3.5 million deaths worldwide, representing nearly 5% of all global deaths, and ranked as the fourth leading cause of mortality globally. In 2021, COPD accounted for 8,084 deaths among individuals aged 70 years or older in Iran, with an age-standardized death rate of 221.4 per 100,000 (3).
Patients with COPD experience multiple persistent symptoms that often occur in distinct clusters rather than in isolation. Three interrelated symptom clusters—respiratory, psychological, and sleep-related—have been identified and are significantly associated with health-related quality of life, highlighting the clinical importance of sleep disturbances in COPD (4). Respiratory symptoms can disrupt sleep, and sleep disorders are a major complication of COPD (5). The estimated prevalence of sleep disturbance in COPD ranges from 34% to 78% (6). Adequate sleep plays a crucial role in regulating inflammatory processes, promoting tissue repair and immune function, improving treatment adherence, and enhancing the effectiveness of pulmonary rehabilitation programs (7).
Given the progressive and irreversible course of COPD, combining pharmacological therapy with nonpharmacological strategies such as pulmonary rehabilitation is essential to reduce complications and slow disease progression (1). The Global Initiative for Chronic Obstructive Lung Disease (GOLD) identifies pulmonary rehabilitation as the most effective nonpharmacological strategy and a key component of COPD management, defining it as a comprehensive, patient-centered intervention that incorporates education, self-management, and exercise training to enhance both physical and mental health (1). As key members of the health care team, nurses have the highest level of therapeutic interaction with patients because of their continuous and close contact compared with other health care professionals. In collaboration with other multidisciplinary team members, rehabilitation nurses are responsible for implementing comprehensive pulmonary rehabilitation programs and ensuring ongoing follow-up (8). In this process, rehabilitation nurses function not only as caregivers but also as facilitators of change and sources of motivation and hope. By establishing meaningful and accountable therapeutic relationships, they are recognized as a fundamental and inseparable component of the rehabilitation process (9).
Pulmonary rehabilitation programs have been reported to improve sleep quality and reduce daytime sleepiness in patients with COPD (10). However, despite inconsistent evidence regarding the impact of pulmonary rehabilitation on sleep quality, sleep disturbances in patients with COPD are frequently underrecognized and insufficiently addressed (11). Although nurse-led interventions have been reported in COPD management, evidence specifically evaluating structured pulmonary rehabilitation programs delivered under nursing leadership remains limited (12). Given the considerable prevalence of COPD in Iran, partly attributable to lifestyle factors and environmental pollution (3), further investigation in this context is warranted.
2. Objectives
This study aimed to determine the effect of implementing a nurse-led hybrid pulmonary rehabilitation program on sleep quality in patients with COPD.
3. Methods
3.1. Study Design
This study was designed as a single-blind randomized controlled trial in which participants were not informed of their group assignment. The study protocol was developed based on internationally recognized guidelines for randomized clinical trials, including the SPIRIT 2025 statement and the ICH M11 guideline, to ensure methodological rigor, transparency, and ethical compliance (13).
3.2. Participants and Sampling
The study included patients with COPD who attended the outpatient clinic of Masih Daneshvari Hospital, Tehran, Iran, between November 2024 and April 2025. The randomization sequence was generated using the Sealed Envelope online randomization website (https://www.sealedenvelope.com/simple-randomiser/v1/lists), with a fixed block size of 4. Assignments were labeled A for the intervention group and B for the control group. To ensure allocation concealment, the randomization sequence was generated by an independent researcher who was not involved in recruitment, intervention delivery, outcome assessment, or data analysis. Group assignments were placed in identical, opaque, sealed, tamper-proof, and sequentially numbered envelopes. The envelopes were opened strictly in numerical order only after participant enrollment, and each envelope was removed from the sequence after use to prevent prediction of future allocations.
An earlier study was used to determine the sample size (14), and the formula for comparing the means of 2 independent groups was used:
With a confidence factor of 95% and
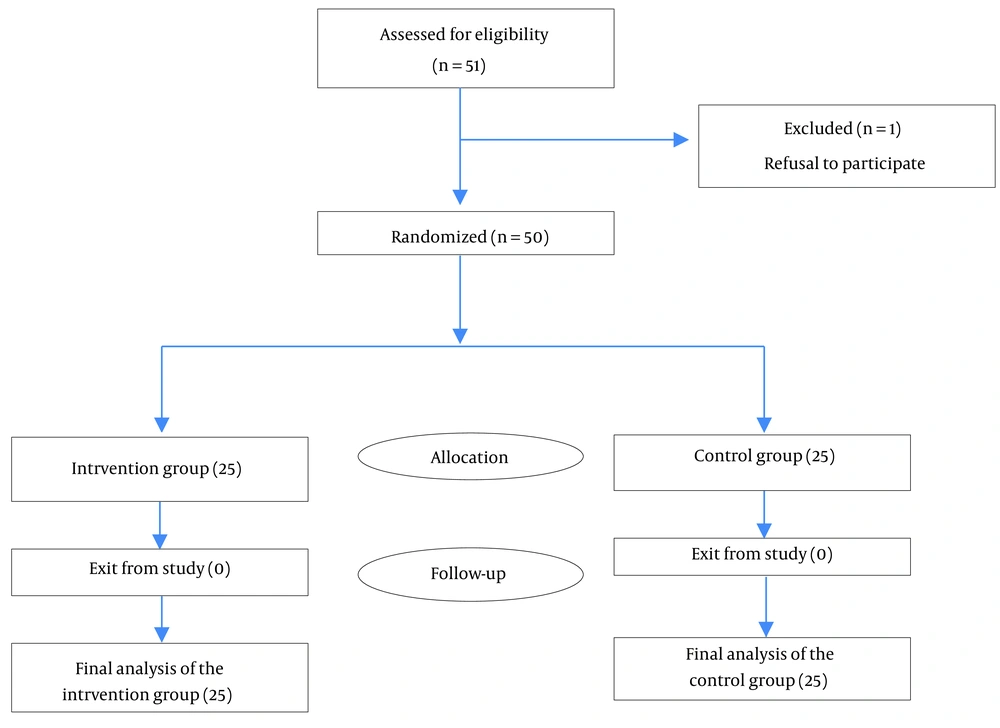
Figure 1.
Enrollment of participants in the study
Participants were included if they had a confirmed diagnosis of COPD documented by a physician, were classified as stage II or III according to the GOLD criteria (16), were aged at least 18 years (17), lived with a family member (without family involvement in the intervention) (18), had no severe or debilitating comorbidities, and owned a smartphone and were able to use mobile applications (19). The exclusion criteria were deterioration in health status requiring hospitalization due to disease exacerbation, death, or voluntary withdrawal from the study.
3.3. Data Collection
Data collection included the PSQI and a demographic data form that captured age, sex, marital status, education level, employment status, disease duration, smoking habits of the patient and family members, and regular medication use. The PSQI, developed by Buysse et al. in 1989 at the University of Pittsburgh, is a self-report instrument that assesses sleep quality and habits over the previous 4 weeks. It comprises 9 questions with 19 individual items, grouped into 7 component scores: subjective sleep quality (item 9), sleep latency (items 1 - 5 and 2), sleep duration (item 4), habitual sleep efficiency (calculated as the ratio of total sleep time to time spent in bed, derived from items 1 and 3), sleep disturbances (assessed based on nocturnal awakenings; items 5 - 2 to 5 - 10), use of sleep medication (item 6), and daytime dysfunction (defined as difficulties experienced during the day as a consequence of poor sleep; items 7 and 8). Each component is rated on a 4-point Likert scale ranging from 0 (no difficulty) to 3 (severe difficulty), where scores of 0, 1, 2, and 3 correspond to normal status and mild, moderate, and severe impairment, respectively. The overall PSQI score ranges from 0 to 21, with a score above 5 indicating poor sleep quality. Completing the PSQI generally takes 5 to 10 minutes. Buysse et al. reported a sensitivity of 89.6%, specificity of 86.5%, internal consistency (Cronbach α) of 0.83, and test-retest reliability of 0.85 for the PSQI (20). In Iran, Farrahi Moghaddam et al. reported a Cronbach α of 0.89 for the PSQI among patients with psychiatric disorders, supporting its reliability and validity in local populations (21).
3.4. Intervention
The researcher initiated the rehabilitation program after obtaining certification. The intervention content was initially compiled from reputable sources (1) and validated by the research team. It was subsequently approved by the academic committee of the Faculty of Nursing at the University of Rehabilitation Sciences and Social Health. The researcher, in collaboration with respiratory specialists at the clinic, reviewed the intervention content and incorporated their expert recommendations. Eligible patients diagnosed with COPD by a specialist were invited to participate on different days of the week during both morning and afternoon shifts. Participants received a full explanation of the study purpose and provided written informed consent to participate.
At baseline (preintervention), both the intervention and control groups completed the demographic data form and PSQI individually under the researcher's supervision in the clinic examination room. Both groups received routine care, including education on the proper use of prescribed medications and follow-up visits. In addition, the intervention group received a nurse-led, multidimensional hybrid pulmonary rehabilitation program over 4 weeks. During the first week, 3 educational sessions, each lasting 30 to 45 minutes, were delivered, and patients were asked to continue the interventions daily for 3 weeks. The first session, conducted in person at the outpatient clinic, focused on COPD education, including the nature of the disease, common symptoms, causative factors, and strategies for managing stress and anxiety.
The second and third sessions were delivered entirely online through mobile applications. These sessions covered diet, medication adherence, daily activity management, physical exercises, and respiratory exercises, with communication and confirmation with patients also conducted through phone calls. Educational materials, including text, audio, images, videos, and PDF files, were provided to participants. All participants performed the interventions daily. Respiratory exercises were performed 3 times per day for 10 minutes each, and walking sessions were performed 3 times per week for 6 minutes each. Ongoing follow-up was conducted via telephone and mobile applications, including Telegram, WhatsApp, and Eitaa, to enable daily monitoring, support adherence, address questions, and reinforce learning (Table 1).
Table 1.
Study Procedure and Content of the Pulmonary Rehabilitation Nursing Program for Improving Sleep Quality in Patients with COPD a
| Time/Session | Educational Content and Actions |
|---|---|
| Pre-test | Call for the study and introduction of the researcher, building trust, providing full explanations to volunteers about the research objectives and implementation method, obtaining written informed consent, and completing questionnaires (demographic data form and PSQI) |
| Week 1 (Session 1) | Question-and-answer session regarding patients' awareness of their disease; enhancing awareness about the nature of COPD, symptoms (cough, shortness of breath, etc.), complications (heart problems, fatigue, anxiety, and sleep problems), and risk factors (smoking, air pollution, and occupational exposures); and stress and anxiety control (expressing concerns and positive visualization) |
| Week 1 (Session 2) | Question-and-answer session and review of the previous session; enhancing awareness about medication use, including introduction to main medications (bronchodilators, corticosteroids, vaccines, etc), side effects, correct use of inhaler sprays, and the importance of regular medication intake; and enhancing awareness about diet, including the importance of sufficient energy intake, important food groups (proteins, dairy products, vegetables, fruits, and grains), management of common problems (dry mouth, fatigue, and shortness of breath during eating), and weight control (appropriate weight gain or loss) |
| Week 1 (Session 3) | Question-and-answer session and review of the previous session; management of daily activities, including maintaining a balance between activity and rest, avoiding activity in polluted air or very cold or hot weather, and exercising at least 3 times per week (6-minute walking); and teaching breathing exercises, including pursed-lip breathing and diaphragmatic breathing |
| Weeks 2 to 4 | Follow-up and daily evaluation of patients. Daily virtual follow-up by the researcher: question-and-answer sessions about the content of previous educational sessions and patients' problems. Implementation and compliance were monitored daily. |
| End of Week 4 (Post-test) | Recompletion of the PSQI questionnaire |
a Abbreviations: COPD, chronic obstructive pulmonary disease; PSQI, Pittsburgh Sleep Quality Index.
3.5. Statistical Analysis
Statistical analyses were performed using SPSS version 26, and the threshold for significance was set at P < 0.05. Quantitative variables were presented as mean ± SD, whereas categorical variables were presented as frequencies and percentages. Categorical data were compared between groups using the chi-square test, whereas numerical data were evaluated using the independent t-test or Mann-Whitney U test, depending on the distribution of variables. The effect size indices reported were Cohen d for mean differences and partial eta squared for analysis of covariance. Paired t-tests were used to compare preintervention and postintervention values in the intervention group, whereas the Wilcoxon signed-rank test was applied for within-group comparisons in the control group. In addition, an independent t-test was used to analyze between-group differences in mean change scores. Normality of variables was examined using the Shapiro-Wilk test.
3.6. Ethical Considerations
This study was based on a master's thesis in rehabilitation nursing approved by the University of Rehabilitation Sciences and Social Health and has the ethics code IR.USWR.REC.1403.108. All patients provided written informed consent and were assured that all their information would remain confidential and accessible only to the researcher. This article was approved by the Iranian Registry of Clinical Trials with the code IRCT20240901062922N1.
4. Results
The intervention and control groups were comparable in demographic and baseline clinical characteristics, with no significant differences (P > 0.05) (Table 2). Normality assessment using the Shapiro-Wilk test indicated that all demographic variables were normally distributed, except for disease duration in the intervention group (P = 0.001). Sleep-quality scores were normally distributed in the intervention group at baseline and postintervention and in the control group at postintervention; however, baseline scores in the control group deviated from normality (Shapiro-Wilk = 0.916, P = 0.042). Therefore, the Mann-Whitney U test was used for the baseline comparison and showed no significant between-group difference (P = 0.172) (Table 3). The Levene test confirmed the homogeneity of variances (F = 1.052, P = 0.310). An independent t-test demonstrated a significant postintervention difference between groups (t = -4.278, P < 0.001), with a very large effect size (Cohen d = 3.60) favoring the intervention group. Within the intervention group, PSQI scores decreased significantly from preintervention (M = 10.56) to postintervention (M = 4.84) (paired t-test: t = -14.223, P < 0.001), indicating improved sleep quality, because lower PSQI scores reflect better sleep. No significant change was observed in the control group (Wilcoxon test: P = 0.432). Change-score analysis showed homogeneity of variances (Levene P = 0.09) and a significant between-group difference (t = -8.37, P < 0.001), with a mean difference of -6.28 in favor of the intervention group (Table 3). Using analysis of covariance to adjust for baseline PSQI scores, the intervention group showed significantly better postintervention sleep quality than the control group (F = 80.78, P < 0.001; partial eta squared = 0.632), with 63.2% of the variance in posttest scores attributable to the intervention, indicating a very large effect (Table 3).
Table 2.
Demographic Characteristics of Patients with COPD a
| Variables | Pulmonary Rehabilitation Program Group | Control Group | P-Value |
|---|---|---|---|
| Gender | 1.000 b | ||
| Male | 23 (92) | 23 (92) | |
| Female | 2 (8) | 2 (8) | |
| Marital status | 0.095 b | ||
| Single | 0 (0) | 3 (12) | |
| Married | 24 (96) | 20 (80) | |
| Divorced | 1 (4) | 0 (0) | |
| Widowed | 0 (0) | 2 (8) | |
| Education level | 0.801 b | ||
| Below diploma | 19 (76) | 17 (68) | |
| Diploma | 5 (20) | 7 (28) | |
| Bachelor's degree | 1 (4) | 1 (4) | |
| Employment status | 0.822 b | ||
| Unemployed | 15 (60) | 15 (60) | |
| Employee | 1 (4) | 2 (8) | |
| Self-employed | 9 (36) | 8 (32) | |
| Place of residence | 0.269 b | ||
| Urban | 19 (76) | 22 (88) | |
| Rural | 6 (24) | 3 (12) | |
| Smoking | 0.552 b | ||
| Yes | 24 (96) | 23 (92) | |
| No | 1 (4) | 2 (8) | |
| Family smoking | 0.225 b | ||
| Yes | 6 (24) | 10 (40) | |
| No | 19 (76) | 15 (60) | |
| Age, y | 62.80 ± 9.47 | 63.36 ± 11.55 | 0.852 c |
| Duration of disease, y | 6.84 ± 6.40 | 5.88 ± 3.71 | 0.946 d |
a Values are expressed as No. (%) or mean ± SD. Abbreviation: COPD, chronic obstructive pulmonary disease.
b Chi-square test.
c Independent samples t-test.
d Mann-Whitney U test.
Table 3.
Comparison of Mean Sleep Quality Scores Before and After the Intervention in Intervention and Control Groups Among Patients with COPD a
| Group | Pre-test | Post-test | Mean Change (Δ) ± SD | Within-Group Test and P-Value |
|---|---|---|---|---|
| Pulmonary rehabilitation program | 10.56 ± 4.84 | 4.84 ± 3.26 | -5.72 ± 2.01 | t = -14.223; P < 0.001 b |
| Control | 8.64 ± 4.08 | 9.20 ± 3.92 | +0.56 ± 3.16 | Z = -0.786; P = 0.432 c |
| Between-group comparison | Z = -1.365; P = 0.172 d | t = -4.278; P < 0.001 e | Mean difference = -6.28; t = -8.37; P < 0.001 e | - |
| ANCOVA (pulmonary rehabilitation program) | F = 80.78; P < 0.001; partial eta squared = 0.632 | F = 80.78; P < 0.001; partial eta squared = 0.632 | F = 80.78; P < 0.001; partial eta squared = 0.632 | F = 80.78; P < 0.001; partial eta squared = 0.632 |
a Values are expressed as mean ± SD unless otherwise indicated. Abbreviations: ANCOVA, analysis of covariance; COPD, chronic obstructive pulmonary disease.
b Paired t-test.
c Wilcoxon signed-rank test.
d Mann-Whitney U test.
e Independent t-test.
5. Discussion
This study demonstrated that a nurse-led hybrid pulmonary rehabilitation program significantly improved sleep quality in patients with COPD. Participants in the intervention group showed substantial improvements from baseline, and comparisons with the control group confirmed the intervention’s effectiveness. The beneficial effects on sleep may be mediated through several mechanisms. Pulmonary rehabilitation can reduce dyspnea and anxiety, improve exercise tolerance, provide structured breathing exercises, and enhance symptom self-management (1). By addressing both physiological and psychological factors that commonly disrupt sleep in patients with COPD, the program likely contributed to the observed improvements in sleep quality.
One study showed that a structured pulmonary rehabilitation intervention led to measurable improvements in subjective sleep quality among patients with COPD, as assessed by the PSQI (22). The similarity between those findings and the results of the present study may be attributed to a comparable target population and the use of a standardized, structured, and multidimensional pulmonary rehabilitation program. In contrast, differences between the two studies may be related to the lack of actigraphy in the present study and the use of a hybrid intervention model rather than a purely face-to-face format.
Previous studies have shown that multidimensional rehabilitation and health coaching can improve sleep and overall quality of life. However, these studies primarily investigated the feasibility of home-based, technology-supported health coaching interventions rather than nurse-led pulmonary rehabilitation programs (23). In the present study, a similar multidimensional rehabilitation program was implemented, and sleep quality was assessed using the validated and standardized PSQI. A recent study reported that respiratory exercises, such as diaphragmatic and pursed-lip breathing, significantly improved sleep quality in elderly patients (24). The consistency of these findings with those of the present study highlights the role of respiratory exercises as an effective nonpharmacological method for enhancing sleep quality in patients with COPD. Both studies used the PSQI to assess outcomes. Whereas the present study was multidimensional, the referenced study focused specifically on breathing exercises.
The findings of some studies are not consistent with those of the present study. Some studies found no significant changes in subjective or objective sleep measures despite improvements in exercise capacity and reduced dyspnea (25). These discrepancies may be attributed to differences in intervention type (clinic-based exercise versus a multidimensional home-based nursing intervention), assessment methods (objective and subjective versus subjective only), a high dropout rate (49%), and lower adherence, possibly due to the longer intervention duration (30 sessions).
This study has several limitations. It was conducted at a single site with a relatively small number of female participants, which may introduce selection bias. The follow-up period was short, outcomes were self-reported, and objective sleep measures were not used. In addition, the potential effects of comorbidities or medications on sleep were not fully characterized. The study employed a single-blind design, with participants unaware of their group allocation at enrollment; however, because of the structured, nurse-led nature of the pulmonary rehabilitation program, full blinding throughout the intervention was not feasible.
5.1. Conclusions
This randomized controlled trial suggests that a nurse-led pulmonary rehabilitation program may improve sleep quality in patients with COPD, as reflected by changes in PSQI scores. These findings indicate a potential benefit of structured nursing interventions for sleep disturbances in this population. However, given the relatively small sample size, single-center design, and short follow-up period, the results should be interpreted with caution. Further large-scale studies with longer follow-up are needed to confirm these findings.