


1. Background
Children and adolescents have the highest mental disorders (MD) prevalence, yet most children do not have access to timely, effective treatment (1). Although utilization of children's mental healthcare services has increased, many children with MD are still not in treatment with these services (2). In addition, children do not seek treatment from a mental health professional, and the stigma and poor access to health providers are leading barriers to care (3). Access to treatment is more difficult for rural youth due to the limited availability of resources such as child and adolescent psychiatrists and having to travel long distances to receive care (4).
Consequently, the weighted mean treatment gap in the Americas for serious mental disorders in the younger population was over 50%. In fact, it has been reported that up to 80% of Latin America had not received treatment (5). Therefore, untreated mental illness among adolescents is a serious public health concern, and mental healthcare services should strengthen access to treatment and ensure that children diagnosed with MD receive quality care (6, 7).
To provide patient-centered care for children and adolescents with MD and adapt the treatment to their needs, efficient and ongoing collaboration between different professions and sectors of healthcare is necessary (8). The success of treatments depends on their continued implementation outside of the clinical context, where patient and family attitudes about healthcare are the main aspects associated with adherence (9). Non-adherence to medication among children and adolescents with MD is highly frequent. However, few studies have reported protective factors associated with therapeutic adherence. Likewise, there is an unknown risk profile of non-adherence among children with MD (10).
2. Objectives
The present study examines the association between the level of medication adherence in children and adolescents with mental disorders and the perception of satisfaction with the medical care received.
3. Methods
3.1. Setting and Participants
Data collection for this study takes place in two mental health settings: (1) the Children's Psychiatric Hospital (CPH), a tertiary mental health setting and teaching facility located in Mexico City. It has an 80-bed inpatient ward and specialized outpatient clinics. In 2019, it provided approximately 105,379 annual outpatient consultations to youth between 1 and 18 years of age; (2) the National Institute of Psychiatry (NIP), a major research center for mental health in Mexico, provided approximately 97,393 annual outpatient consultations in 2019; almost 10% were for adolescents (11).
Children and adolescents of both sexes between the ages of 5 and 20 and their caregivers, who received mental healthcare for a mental disorder in outpatient settings between January 2018 and January 2020, were included in this study.
3.2. Design and Procedure
A cross-sectional, descriptive, and analytical study was conducted; a random selection was made, and the data were obtained through the survey method. The CPH and NIP Ethics and Research Committees approved the project. Primary caregivers and children were identified who were given accurate information about the study and invited to participate; those participants who accepted and gave their consent were included.
The Morisky-Green test (12), also known as Medication Adherence Questionnaire (MAQ), was applied (13). The Spanish version (14) used in this study consists of four dichotomous (yes/no) questions about attitudes and behaviors toward medication. The questions are: (1) do you ever forget to take medicine to treat your illness?; (2) do you take medications at the indicated times?; (3) when you feel well, do you stop taking the medication?; (4) if it ever feels bad, do you stop taking it?
Adherence is considered if the patient answers correctly (no/yes/no/no) to the four questions that make up the questionnaire (13). Additionally, an ad hoc questionnaire was applied in a semi-structured interview with five closed questions and a dichotomous answer (yes/no) to know the attitudes regarding the care provided in the institution. The questions considered the patient's perception of their overall improvement (improvement), improvement in their functioning (function), improvement in their quality of life (quality), presence or absence of side effects from the treatment provided (side effects), as well as satisfaction with the care received by the institution (satisfaction). In those participants who answered yes, the reasons for their satisfaction were investigated with an open-ended question where the patient or their caregiver could explain, in their own words, the reason for their attitude towards the care received by the medical service.
3.3. Statistical Analysis
Descriptive statistics for the sample characteristics and all instrument variables were analyzed using IBM-SPSS Statistics V21.0. Inferential statistics with Spearman's correlation were performed between the adherence and variables on the patient's perception of improvement. The analyses were statistically significant at the 0.05 level.
To analyze the causes of satisfaction of the patients participating in this study, the responses to the question "what is the reason for your satisfaction with this hospital?" were collected. For this, an analysis of linguistic content was carried out, obtaining the frequencies of appearance of all the words (nouns, verbs, adverbs, and adjectives) that made up each answer to the question. For the delimitation of grammatical categories, the Spanish Royal Academy was used (15, 16).
4. Results
Data from 400 dyads (children and their caregivers) were analyzed. The children's sample included 148 girls (37%) and 252 boys (63%) between 5 and 20 years of age (M = 12.23 years; SD = 3.7). Table 1 shows the generic diagnosis of the children based on the international classification of diseases 10th revision (17). Of the 91% who reported being a student, 50% were in primary education, 47% were in secondary, and the rest were in preschool (3.0%) or preparatory (1.5%).
Table 1.Diagnosis of the Participant Children
| Diagnosis | Frequency (%) |
|---|---|
| Personality disorders | 2 (0.5) |
| Anxiety disorders | 31 (7.8) |
| Depressive disorder | 135 (33.8) |
| Bipolar disorder | 2 (0.5) |
| Schizophrenia | 1 (0.3) |
| Otherpsychoticdisorders | 3 (0.8) |
| Unspecified mental disorder | 7 (1.8) |
| Hypercineticdisorders | 204 (51.0) |
| Disocialbehavioraldisorder | 4 (1.0) |
| No diagnosis | 8 (2.0) |
| Psychoactive substance use disorders | 1 (0.3) |
| Asperger | 2 (0.5) |
| Total | 400 (100) |
Regarding the type of treatment, 86.8% of children received a prescription, 48.22% had treatment with stimulant medications, followed by 40.23% who took antidepressants, the rest of the subjects reported having treatment with antipsychotics (5.32%), benzodiazepines (2.36%) and antiepileptic drugs (2.36%). Furthermore, children received psychotherapy in 44% of cases, but only 3.5% received any psychosocial intervention.
Once the Morisky-Green test was qualified, 27.3% of the sample was classified as adherent. Table 2 shows the percentage of responses to each of the test questions. Therapeutic adherence is different by the type of diagnosis of children, and we can observe a high prevalence of non-adherence in children with depressive disorders (22%) and hyperkinetic disorders (39.5%) (Table 3).
Table 2.Percentage of Responses in the Morisky-Green Test a
| Forget to Take Medicine | Take it at the Indicated Time | Leave it When You Are Feeling Well | Leave it When You Are Feeling Bad | |
|---|---|---|---|---|
| No | 153 (38.3) | 49 (12.3) | 298 (74.5) | 308 (77.0) |
| Yes | 193 (48.3) | 297 (74.3) | 47 (11.8) | 36 (9.0) |
| No response | 54 (13.5) | 54 (13.5) | 55 (13.8) | 56 (14) |
a Values are expressed as No. (%).
Table 3.Percentage of Pharmacological Adherence by Diagnosis a
| Diagnosis (Children) | Adherence | ||
|---|---|---|---|
| No | Yes | Total | |
| Personality disorders | 0 (0.0) | 2 (0.5) | 2 (0.5) |
| Anxiety disorders | 21 (5.3) | 10 (2.5) | 31 (7.8) |
| Depressive disorder | 88 (22.0) | 47 (11.8) | 135 (33.8) |
| Bipolar disorder | 2 (0.5) | 0 (0.0) | 2 (0.5) |
| Schizophrenia | 1 (0.3) | 0 (0.0) | 1 (0.3) |
| Other psychotic disorders | 3 (0.8) | 0 (0.0) | 3 (0.8) |
| Unspecified mental disorder | 6 (1.5) | 1 (0.3) | 7 (1.8) |
| Hyperkinetic disorders | 158 (39.5) | 46 (11.5) | 204 (51.0) |
| Social and behavioral disorder | 3 (0.8) | 1 (0.3) | 4 (1.0) |
| No diagnosis | 6 (1.5) | 2 (0.5) | 8 (2.0) |
| Psychoactive substance use disorders | 1 (0.3) | 0 (0.0) | 1 (0.3) |
| Asperger | 2 (0.5) | 0 (0.0) | 2 (0.5) |
| Total | 291 (72.8) | 109 (27.3) | 400 (100.0) |
a Values are expressed as frequency (% of total).
Table 4 shows the results of the Spearman analysis; positive correlations were found between adherence and perception of improvement in functionality (rs = 0.550, P < 0.001) and quality of life (rs = 0.206, P < 0.001). Furthermore, there was a negative correlation between satisfaction and side effects (rs = -0.137, P = 0.006) (Table 5).
Table 4.Perceived Improvement in Functioning, Quality of Life, Satisfaction, and Side Effects a
| Improvement | Functioning | Quality | Satisfaction | Side Effects | |
|---|---|---|---|---|---|
| No | 32 (8.0) | 94 (23.5) | (18.8) | 15 (3.8) | 323 (80.8) |
| Yes | 325 (81.3) | 262 (65.5) | (70.0) | 385 (96.2) | 77 (19.3) |
| No response | 43 (10.8) | 44 (11.0) | (11.2) | 0 (0.0) | 0 (0.0) |
a Values are expressed as No. (%).
Table 5.Spearman's Correlation Between Adherence and Perception of Improvement a
| Adherence | Improvement | Function | Satisfaction | Quality | Side Effects | |
|---|---|---|---|---|---|---|
| Adherence | ||||||
| r | 1.000 | |||||
| P | ||||||
| Improvement | ||||||
| r | 0.048 | 1.000 | ||||
| P | 0.366 | |||||
| Function | ||||||
| r | 0.038 | 0.550 b | 1.000 | |||
| P | 0.474 | < 0.001 | ||||
| Satisfaction | ||||||
| r | 0.091 | -0.027 | 0.019 | 1.000 | ||
| P | 0.068 | 0.607 | 0.717 | |||
| Quality | ||||||
| r | 0.097 | 0.206 b | 0.198 b | 0.064 | 1.000 | |
| P | 0.068 | < 0.001 | < 0.001 | 0.335 | ||
| Side Effects | ||||||
| r | 0.043 | 0.038 | -0.026 | -0.137 b | 0.045 | 1.000 |
| P | 0.391 | 0.476 | 0.627 | < 0.001 | 0.393 |
a r: Correlation coefficient.
b P: Significant at the 0.01 level (P < 0.001).
Regarding the qualitative analysis of satisfaction, Figure 1 shows the words with the highest frequency of appearance in the study participants' responses. At first, the program found a total of 3551 words, but only 1540 of them were in the functional grammatical categories. The font size of every word is proportional to its frequency of appearance: The largest words are those with the highest frequency of appearance, while the smaller words have a lesser frequency. According to the analysis of linguistic content, it can be observed that the main reason for patient satisfaction with the institution lies in the presence of perceptions such as "good attention," "improve," "care," and "help" (Figure 1).
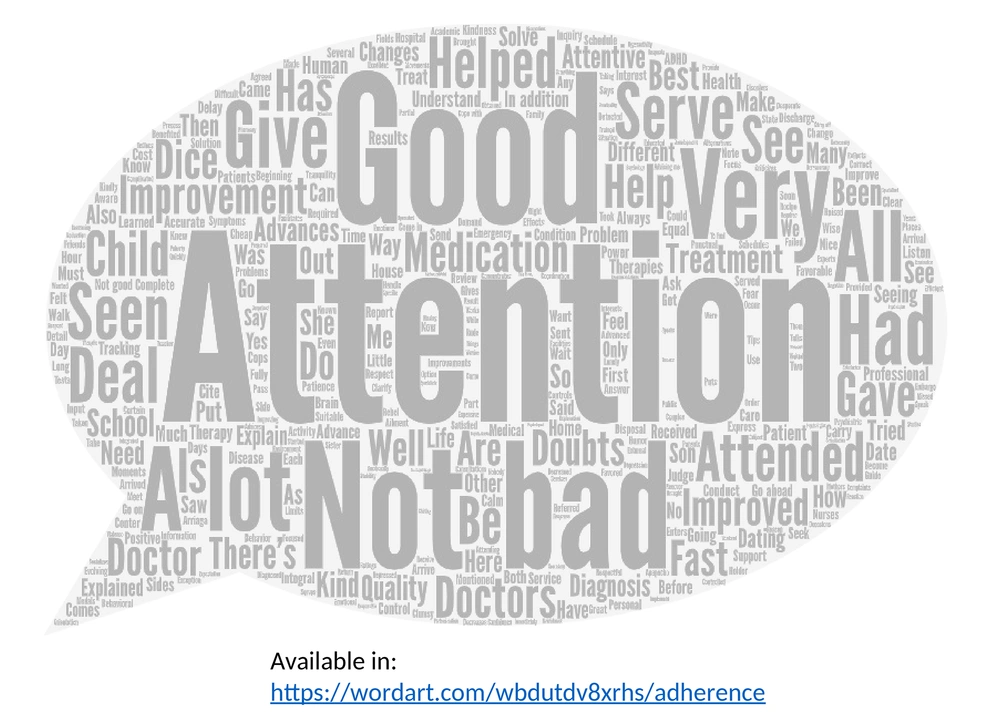
Figure 1.
Functional words expressed by the participants in this study in response to the question, "what is the reason for your satisfaction with this hospital?"
5. Discussion
The results of this study are relevant; they identified the subjective experiences of young people with MD and their caregivers leaving the treatment on the understanding that children and adolescents have problems accessing treatment, and the reasons for the low rates of access to treatment are not well known (18). In reality, less than a third of the study population reported adequate adherence to treatment. This supports that medication non-adherence constitutes a major problem in adolescent psychiatry in Mexico, as is the case in other parts of the world (19). This is especially true when the treatment is long-term (20). Therefore, studies have identified various factors associated with non-adherent behavior (21-23). Furthermore, successful adherence to the treatment of children requires effective communication between patients, families, mental health providers, and school personnel (22).
Adolescents' subjective experiences and health beliefs with MD correlate with medication adherence rates (19). In the present investigation, the results of the correlation analysis show how the perception of satisfaction affects the therapeutic adherence rate, a patient classified as adherent to treatment reports being satisfied with the services provided by health professionals. Conversely, less satisfaction with health services correlates with side effects caused by the prescribed treatment. Moreover, the fact that the patients consider that they obtained an improvement at a global level from the care in the institution positively impacts the improvement of their functioning and quality of life; this result is similar to the reported by Tsujii et al. (21). This statement is very important in the understanding that the mental disorder itself affects the child's quality of life (24).
The results of this article are in accordance with reports from the literature in relation to depressive moods and attention-deficit/hyperactivity disorder (ADHD) being among the most prevalent psychopathologies in children; however, a high proportion of them have not access to effective treatments (25); and when they get to access the treatment, it could be incomplete (26). For example, our results show that the treatment was mainly medication; just over half received psychotherapy, but a marginal number received the social intervention. These findings demonstrate that it is imperative to implement strategies to increase adherence to various treatment regimens (27, 28).
Further, it is necessary to improve access to psychosocial treatments, which help reduce gaps in mental health service use by groups currently less likely to receive treatment additionally, to ensure that they receive quality treatment (7).
On the other hand, the investigation of evidence-based methods for publicly reporting therapeutic adherence in children with MD, the mental health quality measures, and validation of these measures should be a national priority for healthcare research (29).
Another strategy to support adherence and safe treatment is pharmacological monitoring. Our results showed that more than 90% of children who stopped the medication did so due to feeling bad, and in the quantitative analysis, a negative correlation was reported between satisfaction perception and the presence of treatment side effects. As reported in another study, adherence is a process that can change over time in response to experiences with treatment (30).
In conclusion, despite the research on children and parents' experiences with MD have increased in the last years, this study is a pioneer in the approach to therapeutic adherence in children with mental disorders in Mexico.
Although the initial perception of care determines the acceptance of the treatment, as we reported, improving the function in children with MD and successful adherence requires medications along with effective communication between patients, families, mental health providers, and school personnel subjective, psychotherapy or social intervention. Nevertheless, this research focused on perceived satisfaction with care and its correlation with adherence to pharmacological treatment. These items must be considered a limitation of our study because we have not checked their effect.
Additionally, future prospective research is needed to approach the specific interventions needed to improve adherence to treatment by diagnosis.


