


1. Background
A significant element in the health care system is the role of nurses, who are one of the largest providers of health care in public and private sectors, and their interaction with patients is more than other caregiving staff. Due to their significant role in recovering the patients, their failure will end in irreversible consequences. In order to achieve health sector goals, effective and motivated nursing staff are needed (1). One of the most significant motivating factors in nurses is enhancing their job engagement (2). Job engagement has become one of the significant concepts in management and has generally replaced traditional concepts, such as job engagement, motivation, and commitment (3).
Job engagement, referred to as a positive organizational behavior, is a psychological state and is the opposite of job burnout, and refers to the penetrating, sustained, and positive mental state associated with work, characterized by three components of the sense of vigor, dedication, and absorption (4). The first component, i.e. vigor, refers to having high levels of mental flexibility and full energy, associated with the tendency to attempt and persist in fulfilling the tasks. The second component, namely, job engagement, refers to dedication to engagement and full involvement with one’s job, such that the person feels they play a crucial role in the organization and is full of feelings, such as passion, pride, and honor. As the third component of job engagement, absorption is a description of the individual’s complete focus on their job, in which the person is so delightedly absorbed to his occupation that he fails to realize the passage of time (4).
Employees are integrated in their work and will have a strong incentive, when they have a high job engagement. Such employees have great passion for their work, express mobility and creativity, and feel that their participation contributes to the progress of the organization (5). Despite the immense significance of job engagement in nurses, Perinin, in his study on 16 countries during years 2003 to 2007 indicated that 24% of the staff around the world, lack job engagement, 62% have moderate job engagement, and 14% have high job engagement (6). In the study of Vagharseyyedin and Salmani Mud , the results also indicated that job engagement of nurses, working at six hospitals in South Khorasan province, was moderate (64.09 out of 102) (7).
In academic approaches, emphasis is placed on factors affecting job engagement, and researchers are interested in determining the role of individual and organizational factors affecting job engagement, namely, psychological capital. Psychological capital is considered as a positive construct that can be used to effectively manage emotional, motivational, attitudinal, cognitive, and behavioral dimensions at the workplace (8), and has four components of self-efficacy (having self-confidence for necessary commitment and endeavor for success in challenging tasks), hope (sustainability towards the goal and, if necessary, changing the path towards the goal for achieving success), optimism (having a positive citation on present and future successes), and resiliency (sustainability when faced with problems and hardships for achieving success) (9).
One psychological state is psychological capital, and contrary to personal traits and features that are fixed and unchangeable, they have the ability to change and develop, and using educational programs, in-work activities, and focused and short-term intervention programs, one can lay the groundwork for development and improvement (10). The Luthans’s Psychological Capital intervention (PCI) model is an interventional model that emphasizes the growth and development of positive components. In Luthans’s intervention program, there are plans to promote psychological capital, focusing on each of the psychological capital components (11).
Psychological capital interventions increase the psychological capital level in individuals (12, 13). Moreover, the results of various studies indicated that there is a positive and significant relationship between psychological capital and job engagement (14, 15).
This model led to occupational promotion in a number of organizations (13) and state universities (16), however, no study was found evaluating the effect of this model on nurses. This is while nurses suffer intense stress and job burnout due to problems, such as work pressure, long work shifts, wanted and unwanted overtime work, issues with nursing care, and communication with ill patients (17). Investigating the effect of this program on nurses’ job engagement seems to be necessary and this study was conducted to determine the effectiveness of the implementation of the Luthans psychological program on job engagement of nurses in the Khaf county.
2. Methods
In the present semi-experimental study, 64 nursing staff working at 22nd of Bahman Hospital in Khaf, during year 2017, with the inclusion criteria, were selected through convenience sampling and randomly assigned to experimental (N = 32) and control groups (N = 32).
The sample size in each group was obtained as 20 based on the following Equation:
Equation 1.
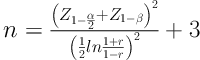
According to Sihag and Sarikwal (18), the effect of psychological capital on job engagement obtained an r of 0.66, significance level of 0.05, and test power of 90% (in this study 32 patients were considered in each group).
The inclusion criteria consisted of having at least one year of work experience, being employed at nursing clinical units, holding a bachelor’s or higher degree, having no mental illness, no experience of severe stressful incident in the last six months (the death of a close relative or divorce), no history of receiving a training program in the field of psychological capital, or any program promoting job engagement and its components, and willingness to collaborate in the study, and the exclusion criteria were absence of more than two sessions.
After obtaining a letter of introduction from Birjand University of Medical Sciences and coordinating with the 22nd of Bahman Hospital in Khaf, the researchers referred to a hospital and after explaining the goals of the study and obtaining informed consents, the demographic questionnaire and job engagement questionnaire were completed by nurses in both groups. Then, for the experimental group, the Luthans’s Psychological Capital training program was conducted in ten 2-hour sessions (two sessions a week), divided to four dimensions of self-efficacy, hope, optimism, and resiliency, with the sessions including slides, pictures, and videos, conducted by a psychologist and researcher (Table 1). However, the control group did not receive any intervention. The job engagement questionnaire was completed again by nurses in both groups two months after the completion of the training sessions. In order to observe the ethics, the training content was provided to the control group after the completion of the research.
Table 1.The Content of Training Sessions
| Sessions Content | |
|---|---|
| Self-efficacy dimension | Providing definitions of self-efficacy concept and characteristics of self-efficient people, the role of taught desperation in reducing self-efficacy, the relationship between motivation, will and self-confidence with self-efficacy and the use of feedback technique, how to increase self-confidence and self-efficacy, and using positive feedback technique, using the mental imagery technique to create positive experiences and strengthen it to increase self-efficacy etc. |
| Hopedimension | Providing definitions of hope and disappointment, and investigating the amount of hope and life satisfaction of participants and creating motivation, informing participants on the role of goals in creating and increasing hope etc. |
| Optimism dimension | Providing definitions of concepts such as optimism, pessimism, etc., familiarity with the concept of desperation and its role in optimism and pessimism etc. |
| Resiliency dimension | Providing definitions of perseverance and resilience concepts and discussing the characteristics of resilient people, providing definitions of the concept of hardiness and introducing its components (commitment, challenge, and control) and ... |
The data collection instrument was a demographic data form (gender, age, marital status, and work experience), and the Work Engagement Scale was developed by Schaufeli and Salanova (2001). The Work Engagement Scale was designed by Schaufeli and Salanova (2001) and contains 17 questions and three dimensions of vigor (six items), dedication (five items), and absorption (six items). Scoring this questionnaire was based on a 5-point Likert scale from strongly disagree (Score one) to strongly agree (score five). The score of each dimension and the general score of the questionnaire was obtained from the total scores for each of its items and the entire items of the questionnaire. The minimum and maximum score in this questionnaire were 17 and 85, respectively, with a higher score indicating greater engagement. In the study of Molaey et al. (19) in general and in dimensions of vigor, dedication, and absorption, scores of 0.88, 0.86, 0.92 and 0.81 were reported, respectively, by using Cronbach’s alpha coefficient.
Data were analyzed using SPSS 22 software. First, using the Kolmogrov-Smirnov test, the normal distribution of variables was investigated. T-test and pairwise t-test were used to compare the variables with normal distribution (job engagement and its components), and Mann-Whitney U test was used for variables without normal distribution (mean changes in variables). Chi-square and Fisher’s exact test were used in order to compare the frequency distribution of demographic characteristics. Two-way variance analysis test was used to compare the variables in two groups in terms of gender.
3. Results
Among 64 subjects, 32 (50%) were in the experimental group and 32 (50%) in the control group. The staff of the experimental and control groups did not differ significantly in terms of age, marital status, and service experience (P > 0.05). However, the frequency distribution of gender in the staff of the experimental and control groups was significantly different (P = 0.04) (Table 2).
Table 2.Frequency Distribution of Different Variables Studied in two Experimental and Control Groupsa
| Variable | The Experimental Group | Control Group | P Value |
|---|---|---|---|
| Gender | 0.04b | ||
| Male | 22 (68.8) | 14 (43.8) | |
| Female | 10 (31.3) | 18 (56.3) | |
| Age, y | 0.27b | ||
| 30 and lower | 8 (25) | 13 (40.6) | |
| 31 - 35 | 8 (25) | 9 (28.1) | |
| More than 35 | 16 (50) | 10 (31.3) | |
| Marital status | 0.26c | ||
| Single | 2 (6.2) | 6 (18.2) | |
| Married | 30 (93.8) | 26 (81.8) | |
| Service experience, y | 0.35b | ||
| 5 and lower | 5 (15.6) | 9 (1.28) | |
| 6 - 10 | 10 (31.3) | 12 (37.5) | |
| 11 - 15 | 8 (25) | 7 (21.9) | |
| More than 15 | 9 (28.1) | 4 (12.5) |
aValues are expressed as No. (%).
bChi square.
cFisher exact test.
Based on the results, there was no significant difference between the mean job engagement score and its components before and after the intervention in the staff of the two experimental and control groups (P > 0.05), however, after the intervention, it was significantly higher in the experimental group than the control group (P < 0.05). In the experimental group, the mean job engagement in general and Its components after the intervention was significantly higher than before (P < 0.001), however, there was no significant difference in the staff of the control group before and after the intervention (P > 0.05). The mean variation in the job engagement score in general and its components before and after the intervention in the experimental group was significantly higher than the control (P < 0.001) (Table 3).
Table 3.Comparison of the Mean Score of Job Engagement in General and its Components Before and After the Intervention in the Staff of the Two Experimental and Control Groupsa
| Variable | Before Intervention | After Intervention | P Value on the Comparison Before and After | Mean of Variations |
|---|---|---|---|---|
| Vigor | ||||
| Experimental group | 21.6 ± 4.46 | 24.13 ± 4.18 | < 0.001b | 3.06 ± 2.96 |
| Controls | 20.59 ± 5.60 | 19.72 ± 5.82 | 0.09b | -0.88 ± 2.78 |
| P value on comparing the two groups | 0.71c | 0.001c | - | 0.001d |
| Self-sacrifice | ||||
| Experimental group | 19.41 ± 3.86 | 21.69 ± 3.85 | < 0.001b | 2.28 ± 2.75 |
| Controls | 19.28 ± 5 | 18.31 ± 5.67 | 0.15b | -0.97 ± 2.19 |
| P value on comparing the two groups | 0.91c | 0.006c | - | 0. 001d |
| Absorption | ||||
| Experimental group | 19.38 ± 4.05 | 23.19 ± 4.06 | < 0.001b | 3.81± 2.75 |
| Controls | 20.63 ± 5.10 | 19.84 ± 6.02 | 0.23b | -0.78 ± 3.64 |
| P value on comparing the two groups | 0.28c | 0.01c | - | 0.001d |
| Job excitement in total | ||||
| Experimental group | 59.84 ± 10.86 | 69 ± 10.68 | < 0.001b | 9.16 ± 7.90 |
| Controls | 60.5 ± 14.43 | 57.88 ± 16.28 | 0.17b | -2.63 ± 8.22 |
| P value on comparing the two groups | 0.84c | 0.003c | - | 0.001d |
aValues are expressed as mean ± SD.
bt pairwise.
ct independent.
dMann-Whitney U.
Considering the fact that the staff of the two experimental and control groups were heterogeneous in terms of gender (P = 0.04), the two-way ANOVA was used to control the effect of this variable on the results, and the results of this test indicated that the mean job engagement score in general and its components were significantly higher in the experimental group than in the control group after the intervention (P < 0.01). However, the mean job engagement score in general and its components after the intervention were not significant in terms of gender (P > 0.05). There was also no interaction between the group and gender (P > 0.05), thus, gender could not influence the test results (Table 4).
Table 4.Comparing the Mean Score of Job Engagement in General and Its Components After the Intervention in the Staff of the Two Experimental and Control Groups in Terms of Gender
| Variable | The Experimental Group | Controls | The Result of the Two-Way ANOVA Test | ||||
|---|---|---|---|---|---|---|---|
| Male | Female | Male | Female | P Related to the Group | P Related to the Gender | P Related to Group and Gender Interactions | |
| Vigor | 23.59 ± 4.17 | 25.30 ± 4.16 | 18.43± 6.76 | 20.72 ± 4.94 | < 0.001 | 0.13 | 0.83 |
| Dedication | 20.68 ± 3.82 | 23.90 ± 1.45 | 17.43 ± 6.71 | 19.00 ± 4.80 | 0.001 | 0.06 | 0.50 |
| Absorption | 22.68 ± 4.10 | 24.30 ± 3.95 | 18.50 ± 5.89 | 20.89 ± 6.08 | 0.006 | 0.14 | 0.77 |
| General job engagement | 66.95 ± 11.30 | 73.50 ± 7.88 | 54.36 ± 18.13 | 60.61 ± 61.14 | 0.001 | 0.08 | 0.97 |
4. Discussion
Based on the results of the present study, in the experimental group, the mean score of job engagement in general and its components after the intervention was significantly higher than before, however, in the control group, there was no significant difference in the score, before and after the intervention. The mean score of job engagement and its components before and after the intervention in the experimental group were significantly higher than the control group.
In a study aimed at investigating the effect of training psychological capital on job performance and job engagement, Shahbazi concluded that the training intervention of psychological capital had a positive and significant effect on job engagement, yet it did not have a significant effect on job performance (20). The results of the study conducted by Sihag and Sarikwal on the effect of psychological capital on the staff’s engagement indicated that employees with a higher level of psychological capital (in terms of hope, self-confidence, resiliency, and optimism) showed a higher level of job engagement at work (18). Hodges, in a study with experimental groups, selected 503 financial staff from the US government and randomly assigned them to the control and experimental groups. The results indicated that training courses in psychological capital had a significant effect on staff’s job engagement (13). The results of these studies are consistent with the findings of the present study.
Based on the results of various studies, the interventions of psychological capital increase the level of individuals’ psychological capital (12, 13). In addition, Sweetman and Luthans concluded that psychological capital had a positive and significant relationship with job engagement, and their argument was based on the needs-job resource model. Based on this model, it is stated that personal/occupational resources in mutual effect with job requirements, predict job engagement and, consequently, staff performance (15). Sengers also found in a study that there was a significant relationship between hope and self-efficacy (as components of psychological capital) with job engagement (21). The results of the study conducted by Nigah et al. in the field of staff socialization indicated that the employees’ psychological capital predicts their job engagement (14).
In a study that investigated the relationship amongst psychological capital and perceived organizational commitment with job engagement on 180 nurses, Matoori concluded that there was a significant relationship between the components of psychological capital, namely, hope, self-efficacy, optimism, and resiliency, with job engagement, such that with increased psychological capital in nurses, their job engagement also increased (22).
Based on the results of the above studies, it can be concluded that psychological capital interventions increase the level of psychological capital in individuals and, as a result, job engagement is increased in them, which is consistent with the results of the present study.
Based on the results of various studies, it can be said that having psychological capital enables individuals to better cope with stressful situations, have a high level of vigor to deal with problems, and gain a clear perspective about themselves, and be less affected by daily events, thus, they have higher psychological health (23). Increased psychological capital, especially resilience among nurses, is important because resilient nurses are less likely to have job stress and burnout, have better health, have higher levels of job engagement and intention to stay in the organization (24-26). Also, the amount of optimism and self-efficacy are related to lower level of depression among nurses, and psychological capitals (hope, optimism, resilience, and self-efficacy) are generally related to nurses’ commitment to hospital missions (27).
4.1. Conclusion
Considering the results of the present study, i.e. the effect of training psychological capital on nurses’ job engagement, it is suggested to implement psychological capital training program for nurses in order to improve their job engagement and thus increase their job satisfaction.


