1. Background
Anemia is a frequent finding in patients admitted with acute ischemic stroke (AIS), with prevalence estimates reaching up to 40% of cases (1). This condition has been consistently associated with poorer outcomes, including higher mortality rates and less favorable functional recovery (2-5). These effects are likely multifactorial, involving altered blood viscosity, impaired oxygen delivery, and reduced efficiency of cerebral autoregulation mechanisms (6).
Recent systematic reviews and meta-analyses have reinforced the prognostic significance of anemia in AIS. Desai et al. (1) and Li et al. (3) found that anemic patients have significantly increased short- and long-term mortality risks (1, 3). These findings underscore the clinical importance of prompt recognition of anemia in the acute stroke setting.
Recent advances in medical imaging have increasingly expanded the role of radiology from purely visual interpretation to quantitative image analysis and biomarker extraction (7, 8). Radiomics and related quantitative image-analysis approaches enable the extraction of numerical features from routinely acquired images and have contributed to the development of imaging biomarkers (7). Artificial-intelligence-assisted imaging has further broadened this field by supporting image analysis, image processing, and diagnostic assistance (8). These developments have reinforced the concept that standard clinical images may contain clinically relevant quantitative information beyond conventional visual assessment (7). In this context, CT attenuation measurements represent a simple, reproducible, and clinically accessible quantitative imaging marker that can be derived from routine stroke imaging before considering more specialized technologies such as photon-counting CT.
While anemia is primarily diagnosed through laboratory testing, there has been growing interest in non-invasive, imaging-based estimation of hemoglobin concentration. Prior studies have established a strong linear relationship between hemoglobin levels and computed tomography (CT) attenuation values, especially on unenhanced CT scans (9-13). More recently, spectral and photon-counting CT technology have enabled the generation of virtual non-contrast (VNC) reconstructions from contrast-enhanced datasets. These VNC images, generated by subtracting the iodine signal, have demonstrated promise in detecting anemia, particularly in the thoracic and abdominal vasculature (14).
In neurological imaging, however, the role of attenuation-based hemoglobin estimation remains less explored. Some studies have suggested that cranial venous sinus attenuation on true non-contrast (TNC) CT correlates with hemoglobin concentration (15, 16). However, artifacts and anatomical variability often limit measurement accuracy (17).
Several studies have investigated whether VNC imaging could reliably substitute for native CT across different anatomical regions. Herpe et al. (18) showed promising results for replacing TNC with VNC in acute stroke protocols using dual-energy CT (18), and Risch et al. (19) demonstrated that photon-counting CT allows accurate differentiation between blood and contrast media in cranial phantom models (19). Similarly, Dane et al. (20) reported superior VNC image quality from photon-counting CT compared with dual-energy integrating detector CT (20), while Lehti et al. (21) confirmed the overall reliability of VNC reconstructions in vascular protocols (21). Additionally, Almqvist et al. (22) emphasized the advantages of second-generation silicon-based photon-counting CT (PCD-CT) systems in neurovascular imaging (22).
In a prior study, we validated the use of VNC reconstructions from photon-counting CT angiography (PCD-CTA) for estimating anemia via attenuation values in the supra-aortic venous system (23). However, that study did not compare native cranial CT/TNC attenuation with CTA-derived VNC attenuation in intracranial venous structures available on both acquisitions. Therefore, it remains unclear how native intracranial venous attenuation compares with VNC-derived attenuation measurements in the acute stroke setting.
2. Objectives
This study aimed to address three questions: 1) whether anemia detection is feasible using native non-contrast PCD-CT; 2) how attenuation measurements compare between TNC and VNC reconstructions within corresponding intracranial venous structures; and 3) whether the best-performing VNC-derived venous marker may provide a pragmatic alternative to the best-performing TNC-based marker in acute stroke imaging workflows. Collectively, these analyses may help clarify the diagnostic potential and practical role of VNC in streamlined stroke protocols.
3. Methods
3.1. Study Design and Ethical Considerations
This single-center retrospective observational study was conducted at Ludwig-Maximilian-University of Munich, Germany, and was approved by the local Institutional Review Board (reference number: 22 - 0456). All procedures were performed in accordance with the Declaration of Helsinki and its later amendments. Because only retrospectively collected and irreversibly anonymized data were analyzed, the Institutional Review Board waived the requirement for written informed consent.
3.2. Patients
All consecutive patients examined between July 1, 2021, and May 30, 2022, were screened for eligibility if both an unenhanced head CT and an arterial-phase CT angiography of the supra-aortic brain-supplying vessels had been acquired on the same PCD-CT system (NAEOTOM Alpha, Siemens Healthineers, Erlangen, Germany). Exclusion criteria were missing or outdated hemoglobin values (> 7 days), severe beam-hardening artifacts due to foreign material after cervical spine surgery, and incomplete scan coverage of the supra-aortic brain-supplying vessels.
Exclusions were applied before statistical analysis. Laboratory availability and scan-protocol eligibility were assessed first, followed by image-quality review and evaluation of the anatomical coverage required for region-of-interest (ROI) placement. ROI feasibility exclusions were made before attenuation measurements were entered into the final diagnostic dataset and before receiver operating characteristic (ROC) analysis or threshold derivation.
Complete blood count values were accepted if obtained within seven calendar days of CT acquisition. The time interval between CT and hemoglobin measurement was calculated as the absolute difference in calendar days between the two examinations. Exact intraday timestamps were not available for all patients; therefore, same-day examinations were classified as occurring on the same calendar day rather than as strictly simultaneous. Because of the retrospective design, hemoglobin measurements reflected clinically available laboratory testing and were not repeated solely for research purposes.
This study represents a secondary analysis of a previously investigated institutional AIS cohort (23). In contrast to the prior publication, which focused on VNC attenuation measurements in supra-aortic vessels, the present analysis was restricted to the subset of patients who also had a true non-contrast head CT acquired on the same PCD-CT system, thereby allowing direct comparison between TNC- and VNC-based attenuation metrics.
Anemia was classified according to World Health Organization (WHO) criteria. For women, hemoglobin levels were categorized as no anemia (≥ 12.0 g/dL), mild anemia (< 12.0 - 11.0 g/dL), moderate anemia (< 11.0 - 8.0 g/dL), and severe anemia (< 8.0 g/dL). For men, the corresponding thresholds were no anemia (≥ 13.0 g/dL), mild anemia (< 13.0 - 11.0 g/dL), moderate anemia (< 11.0 - 8.0 g/dL), and severe anemia (< 8.0 g/dL). For diagnostic-accuracy reporting, the index tests were the predefined venous attenuation measurements on TNC and VNC images, whereas the reference standard was laboratory hemoglobin-based anemia classification according to sex-specific WHO criteria.
3.3. Scanning Protocol
All examinations were performed on a photon-counting detector CT scanner (NAEOTOM Alpha, Siemens Healthineers, Erlangen, Germany) as part of routine clinical imaging. For unenhanced cranial CT, acquisitions were obtained using spectral information readout (QuantumPlus, Siemens Healthineers), a tube voltage of 120 kVp with automatic tube current modulation (Care DOSE 4D, Siemens Healthineers), a pitch of 0.35, and a collimation of 144 × 0.4 mm2. Scanning was performed in a caudocranial direction, extending from the skull vertex to the foramen magnum. Full-volume spectral datasets were reconstructed with a parenchymal kernel (Hr40), and an additional axial reconstruction was generated using a bone kernel (Hr68). Quantum iterative reconstruction (QIR) level 2 was applied. Images were stored in enhanced Digital Imaging and Communications in Medicine (DICOM) format containing the full spectral information. The reconstructed slice thickness was 1 mm.
For contrast-enhanced CT angiography (CTA) of the head and neck, a monophasic injection protocol was used. A total of 60 mL of iodinated contrast material (iopromide; Ultravist 300 mgI/mL, Bayer, Leverkusen, Germany) was injected through an antecubital venous access, followed by a 20 mL saline flush. Both contrast material and saline were administered at a flow rate of 4.5 mL/s. Bolus tracking was performed in the ascending aorta, and image acquisition was initiated when an attenuation threshold of 120 Hounsfeld units (HU) was reached. CTA coverage extended in a caudocranial direction from the ascending aorta to the vertex.
CTA acquisitions were performed with a rotation time of 0.25 s, a pitch of 0.8, and a collimation of 144 × 0.4 mm2. VNC reconstructions were generated from the contrast-enhanced spectral CTA data using a dual-energy material decomposition approach. This algorithm separates iodine from soft tissue and subtracts the iodine component to approximate non-contrast image information while preserving tissue attenuation. CTA spectral datasets were reconstructed with a soft-tissue kernel (Qr40f) and Quantum iterative reconstruction level 3 and were saved in enhanced DICOM format with full spectral information. The reconstructed slice thickness was 0.8 mm, with an increment of 1 mm.
3.4. Image Processing and Analysis
Image evaluation was performed on a dedicated workstation (Syngo.via VB60A, MM reading workflow; Siemens Healthineers, Erlangen, Germany). Measurements were obtained by a radiology resident with 1.5 years of experience in head and neck CTA interpretation (GAQ), who was blinded to laboratory and clinical information.
ROIs were placed in predefined venous structures selected to enable reproducible attenuation measurements while minimizing the influence of artifacts and partial-volume effects. The evaluated intracranial venous locations were the sigmoid sinuses, confluence of sinuses, superior sagittal sinus, and great cerebral vein (VCM), which have previously been investigated in the context of CT-based anemia assessment (17) (Figure 1). ROIs were drawn to include approximately two-thirds of the vessel diameter while avoiding the vessel wall, adjacent bone, and surrounding tissue. Mean ROI areas were 0.3 cm2 for the sigmoid sinus, 0.4 cm2 for the confluence of sinuses, 0.2 cm2 for the great cerebral vein, and 0.3 cm2 for the superior sagittal sinus.
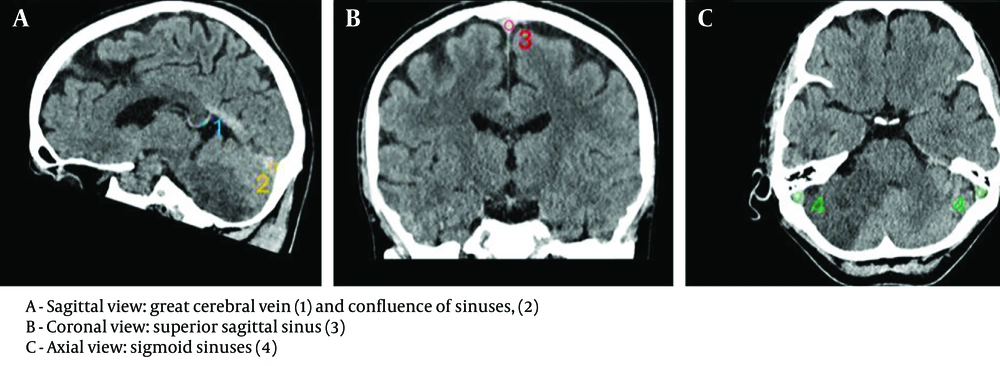
Figure 1.
Representative ROI placement for venous attenuation measurements. Regions of interest were placed in predefined venous structures, including the sigmoid sinus, confluence of sinuses, superior sagittal sinus, and great cerebral vein, avoiding adjacent bone and partial-volume effects. ROI = region of interest.
After ROI placement on the spectral post-processing series, attenuation values were automatically generated by the software for both the 70-keV virtual monoenergetic image series and the corresponding VNC reconstruction. The 70-keV virtual monoenergetic image series was selected because it has been reported to most closely approximate conventional 120-kVp polychromatic CT images while providing improved signal-to-noise and contrast-to-noise characteristics (22, 24).
A vessel-matched comparison between TNC and VNC measurements in the internal jugular veins was not possible because the unenhanced CT acquisition was limited to the head and did not routinely cover the cervical venous system. Therefore, direct TNC-versus-VNC comparisons were restricted to intracranial venous structures included in both datasets. Analyses involving the internal jugular vein were interpreted as a separate pragmatic comparison, representing the best-performing extracranial VNC marker available from routine CTA rather than a vessel-matched modality comparison.
3.5. Statistical Analysis
Statistical analyses were performed in Python version 3.11.8 using the SciPy, pandas, numpy, scikit-learn, statsmodels, and matplotlib packages. Associations between hemoglobin concentration and attenuation measurements were initially assessed using Pearson correlation coefficients for each predefined anatomical region, including the internal jugular veins, great cerebral vein, sigmoid sinuses, confluence of sinuses, and superior sagittal sinus. Linear regression was then used to quantify the relationship between attenuation values and hemoglobin concentration, with R2 values reported to describe the proportion of explained variance. For the main attenuation markers, multivariable linear regression models were additionally fitted using hemoglobin concentration as the dependent variable and attenuation value as the independent variable of interest. Age and sex were selected a priori as adjustment variables because hemoglobin concentration and anemia prevalence differ by sex and may vary with age. Adjusted regression coefficients were reported as the expected change in hemoglobin concentration per 1-HU increase in attenuation, with corresponding 95% confidence intervals (CIs). Other clinically plausible covariates, such as hydration status, renal function, inflammatory parameters, intravenous fluid administration, and comorbidities, were not consistently available in this retrospective dataset and were therefore not included in the adjusted models.
ROC analysis was used to assess the ability of each attenuation marker to distinguish anemic (hemoglobin < 12 g/dL for women and < 13 g/dL for men) from non-anemic patients, with the area under the curve (AUC) used to measure diagnostic accuracy. Optimal attenuation thresholds were selected exploratorily using the Youden index. Sensitivity and specificity were calculated for each Youden index-derived threshold.
To assess the potential influence of temporal mismatch between CT acquisition and the laboratory reference standard, a sensitivity analysis was performed in the subgroup of patients with hemoglobin measurements obtained within one calendar day of CT acquisition. ROC analyses and Youden index-derived thresholds were recalculated in this subgroup and compared descriptively with the results from the full cohort.
Because of the exploratory nature and small sample size of the cohort, emphasis was placed on effect estimates, confidence intervals, and diagnostic accuracy measures rather than on P values alone. Nevertheless, a P value ≤ 0.05 was considered statistically significant for all tests.
4. Results
4.1. Patient Characteristics and Cohort Flow
Of the initial cohort of 111 patients, 66 were excluded based on predefined criteria: missing or outdated laboratory hemoglobin values (> 7 days, n = 15), limited scan coverage to intracranial (n = 1) or extracranial regions only (n = 1), severe image artifacts due to prior cervical spine surgery (n = 3), incomplete depiction of venous ROIs (n = 11), and unenhanced head CT performed on non-PCD scanners (n = 35). A STARD-style participant flow diagram is provided in Figure 2. A total of 45 patients were included in the final analysis. A complete comparison between included and excluded patients was not feasible because laboratory values, compatible imaging data, or complete ROI availability were missing by definition in several excluded groups. After application of the predefined image-quality and ROI-feasibility criteria, no indeterminate or non-evaluable index-test results remained in the final diagnostic dataset. The mean age of the final cohort was 72.2 ± 11.4 years (range, 39 - 92 years). Of the 45 patients, 25 (55.6%) were male (mean age: 71.1 ± 13.6 years) and 20 (44.4%) were female (mean age: 73.6 ± 8.2 years). Patient demographics and anemia classification are summarized in Table 1.
Table 1.
Patient Characteristics a
| Characteristic | Total patients (n = 45) |
|---|---|
| Age (y) | 72.2 ± 11.4 |
| Gender | |
| Male | 25 (55.6) |
| Female | 20 (44.4) |
| Anemia | |
| No anemia | 29 (64.4) |
| Mild anemia | 4 (8.9) |
| Moderate anemia | 9 (20.0) |
| Severe anemia | 3 (6.7) |
a Values are expressed as mean ± SD or No. (%).
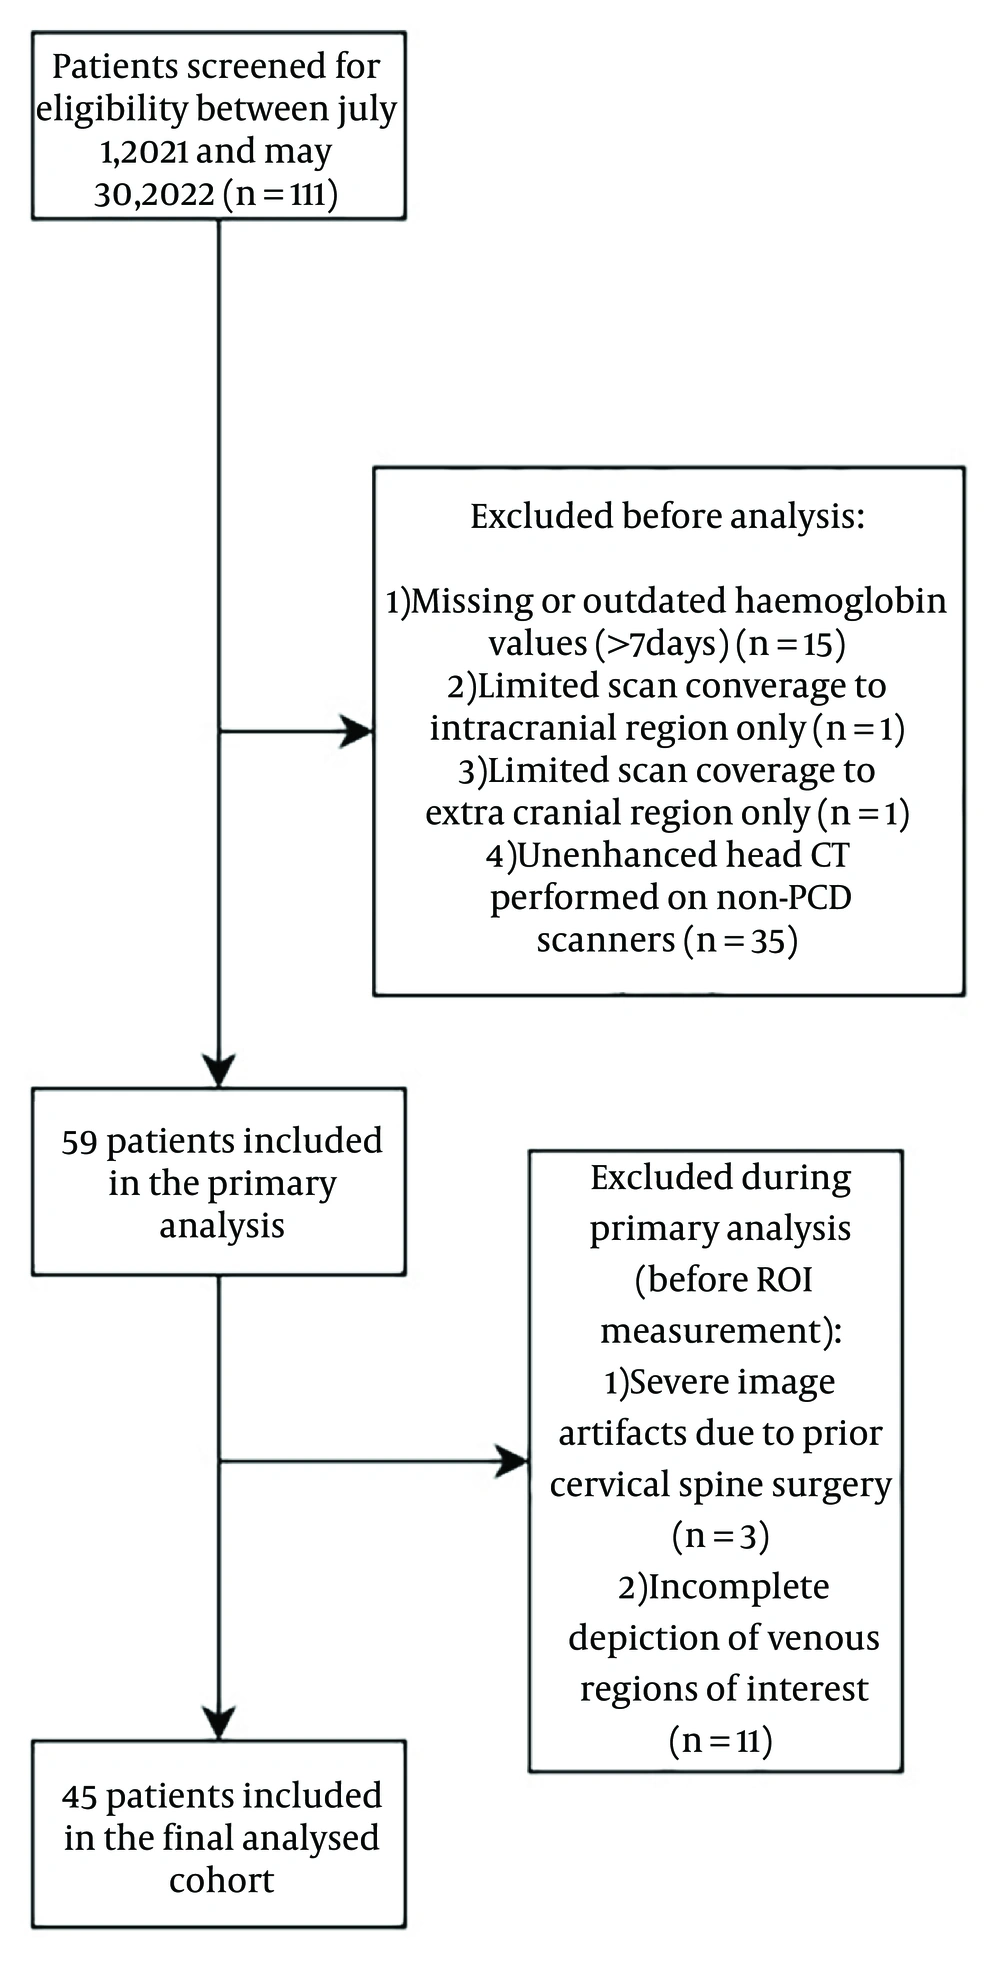
Figure 2.
STARD-style participant flow diagram. Of 111 screened patients, 52 were excluded during initial eligibility assessment and 14 during image-quality and ROI-feasibility review. The final cohort included 45 patients for statistical analysis.
Anemia was present in 35.6% of the cohort. Based on WHO criteria, 29 patients (64.4%) had no anemia, whereas 4 (8.9%), 9 (20.0%), and 3 (6.7%) were classified as having mild, moderate, and severe anemia, respectively.
The distribution of time intervals between CT acquisition and hemoglobin measurement is summarized in Table 1 in the Supplementary File. Hemoglobin values were obtained on the same calendar day as CT acquisition in 24 patients (53.3%), within one calendar day in 35 patients (77.8%), within two calendar days in 38 patients (84.4%), and within three calendar days in 39 patients (86.7%). In 14 patients (31.1%), hemoglobin measurement was performed before CT acquisition; in 24 patients (53.3%), it was obtained on the same calendar day; and in 7 patients (15.6%), it was obtained after CT acquisition. Exact intraday timing was not available for all same-day examinations.
4.2. Vessel-Matched Intracranial TNC-Versus-VNC Comparisons
Correlations varied across anatomical regions. Among the intracranial venous structures evaluated, VCM attenuation on TNC images demonstrated the strongest correlation with hemoglobin (r = 0.75, R2 = 0.56, P < 0.001). The corresponding VCM measurement on VNC images also showed a significant but weaker correlation (r = 0.51, R2 = 0.26, P < 0.001). Overall, within matched intracranial venous structures, TNC consistently showed stronger associations with hemoglobin than the corresponding VNC reconstructions. The relationships between hemoglobin levels and attenuation values at all points of interest are summarized in Table 2.
Table 2.
Correlation and Diagnostic Performance of Venous Attenuation Markers for Anemia Detection a
| Region | Correlation (r) | 95% CI for r | R2 | AUC | 95% CI for AUC | Optimal threshold, HU | Sensitivity (%) | Specificity (%) | P Value |
|---|---|---|---|---|---|---|---|---|---|
| SIG - TNC | 0.44 | 0.17 - 0.65 | 0.19 | 0.60 | 0.43 - 0.78 | ≤38.50 | 31.25 | 96.55 | < 0.01 |
| SIG - VNC | 0.48 | 0.22 - 0.68 | 0.23 | 0.84 | 0.70 - 0.97 | ≤ 32.50 | 81.25 | 79.31 | < 0.01 |
| CONF - TNC | 0.48 | 0.21 - 0.68 | 0.23 | 0.70 | 0.54 - 0.87 | ≤ 49.00 | 81.25 | 55.17 | < 0.01 |
| CONF - VNC | 0.48 | 0.22 - 0.68 | 0.24 | 0.70 | 0.53 - 0.86 | ≤ 28.00 | 62.50 | 82.76 | < 0.01 |
| SSS - TNC | 0.38 | 0.09 - 0.60 | 0.14 | 0.70 | 0.54 - 0.87 | ≤ 53.50 | 75.00 | 68.97 | 0.01 |
| SSS - VNC | 0.34 | 0.05 - 0.57 | 0.11 | 0.71 | 0.54 - 0.87 | ≤ 33.00 | 87.50 | 51.72 | 0.02 |
| VCM - TNC | 0.75 | 0.58 - 0.85 | 0.56 | 0.87 | 0.74 - 0.99 | ≤ 42.00 | 81.25 | 75.86 | < 0.01 |
| VCM - VNC | 0.51 | 0.26 - 0.70 | 0.26 | 0.72 | 0.55 - 0.88 | ≤ 36.00 | 87.50 | 62.07 | < 0.01 |
a Abbreviations: CI, confidence interval; R2, coefficient of determination; AUC, area under the receiver operating characteristic curve; SIG, sigmoid sinus; CONF, confluence of sinuses; SSS, superior sagittal sinus; VCM, great cerebral vein; TNC, true non-contrast; VNC, virtual non-contrast; HU, Hounsfield units. Optimal thresholds were selected exploratorily using the Youden index. Sensitivity and specificity refer to anemia classification using attenuation values at or below the indicated threshold.
In multivariable linear regression adjusted for age and sex, the association between attenuation values and hemoglobin concentration remained significant for the main attenuation markers. Full adjusted regression results are provided in Table 2 in the Supplementary File.
ROC analysis showed the highest diagnostic performance for anemia detection for VCM attenuation on TNC images, with an AUC of 0.87. Using the Youden index, the exploratory optimal threshold was ≤ 42 HU, yielding a sensitivity of 81.3% and specificity of 75.9% for anemia detection. Among the intracranial VNC measurements, the sigmoid sinus achieved the highest performance, with an AUC of 0.84 (95% CI: 0.70 - 0.97). The exploratory optimal threshold for sigmoid sinus attenuation on VNC images was ≤ 32.50 HU, yielding a sensitivity of 81.3% and specificity of 79.3%. For VCM attenuation on VNC images, the exploratory optimal threshold was ≤ 36.00 HU, with a sensitivity of 87.5% and specificity of 62.1% (AUC = 0.72; 95% CI: 0.55 - 0.88). Figure 3 summarizes the ROC curves for the intracranial ROIs.
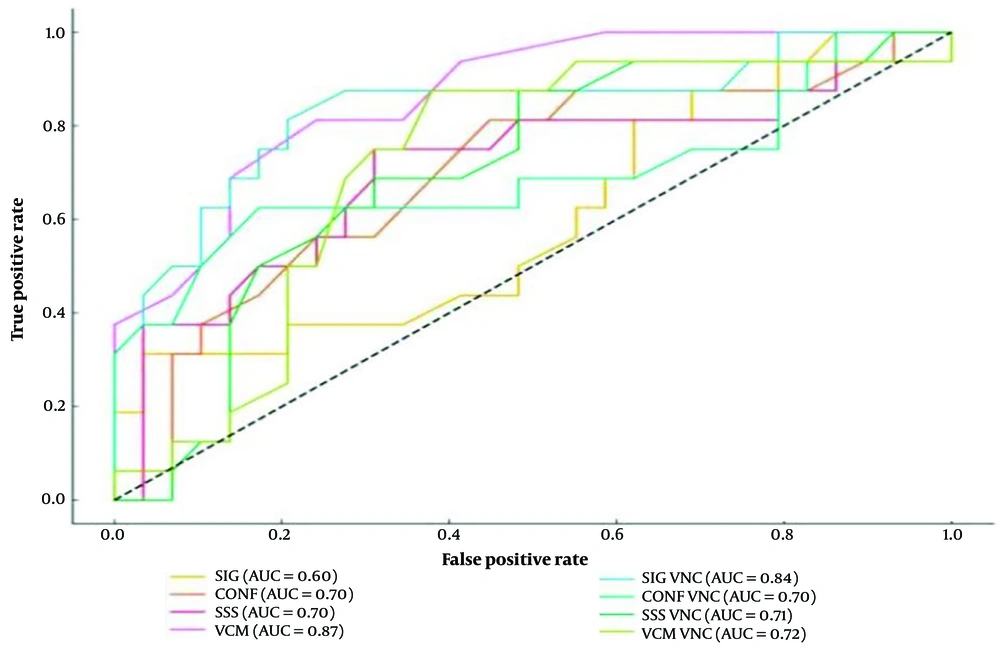
Figure 3.
ROC analysis of intracranial venous attenuation markers for anemia detection. ROC curves plot sensitivity against 1 − specificity for attenuation measurements from the sigmoid sinus, confluence of sinuses, superior sagittal sinus, and great cerebral vein on TNC and VNC images. AUC values are provided in Table 2. ROC = receiver operating characteristic; AUC = area under the curve; TNC = true noncontrast; VNC = virtual non-contrast; SIG = sigmoid sinus; CONF = confluence of sinuses; SSS = superior sagittal sinus; VCM = great cerebral vein.
In the sensitivity analysis restricted to patients with hemoglobin measurements within one calendar day of CT acquisition, the main diagnostic findings remained broadly consistent. In this subgroup of 35 patients, including 15 anemic and 20 non-anemic patients, VCM attenuation on TNC images showed an AUC of 0.85, with a Youden index-derived threshold of ≤ 42 HU, yielding a sensitivity of 86.7% and specificity of 70%. VCM attenuation on VNC images showed an AUC of 0.69, with a threshold of ≤ 36 HU, a sensitivity of 86.7%, and a specificity of 60.0%.
Overall, selected VNC measurements showed relevant diagnostic performance, although TNC remained superior for VCM attenuation. Although several VNC regions demonstrated comparable performance to TNC, VCM attenuation on native imaging remained the most reliable location (Figure 3).
4.3. Pragmatic Best-Marker Comparison
In a separate pragmatic comparison, we evaluated the best-performing TNC marker (VCM on TNC) against the best-performing extracranial VNC marker (internal jugular vein on VNC) for predicting anemia. This comparison was not vessel-matched because the unenhanced head CT did not include the cervical internal jugular veins. Therefore, the comparison combines differences in imaging modality and anatomical location. ROC analysis demonstrated nearly identical diagnostic performance between these two markers (VCM on TNC, AUC = 0.865; internal jugular vein on VNC, AUC = 0.869) (Figure 4). The DeLong test showed no statistically significant difference between these AUCs (difference = -0.003; P = 0.485), indicating similar AUC values in this pragmatic, non-vessel-matched comparison.
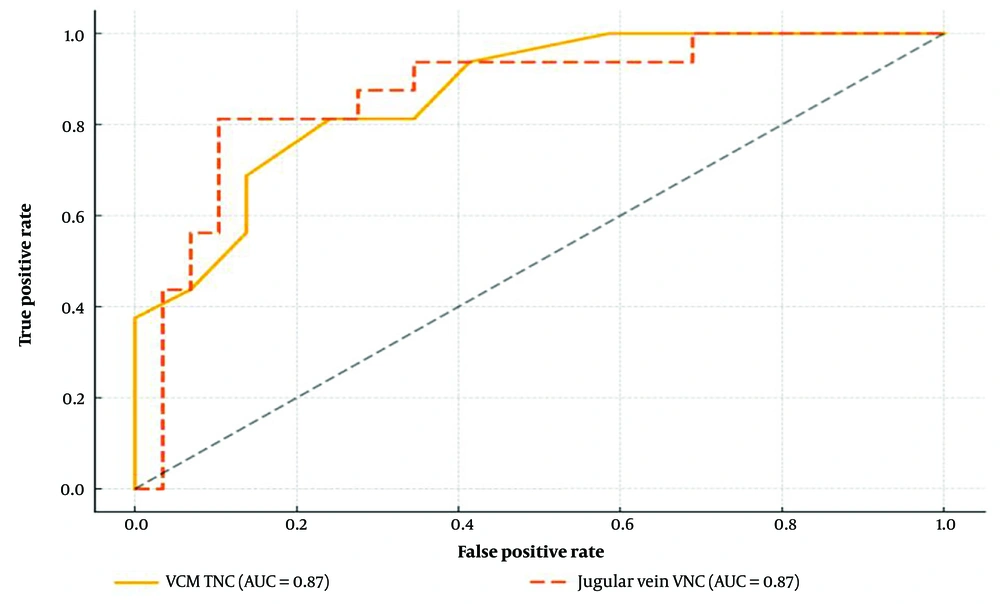
Figure 4.
Pragmatic best-marker ROC comparison. Receiver operating characteristic curves plot the true-positive rate against the false-positive rate for anemia detection, comparing great cerebral vein attenuation on TNC images with internal jugular vein attenuation on VNC images. This comparison was not vessel-matched and combines imaging-modality and anatomical-location effects. ROC = receiver operating characteristic; TNC = true non-contrast; VNC = virtual non-contrast; VCM = great cerebral vein.
All attenuation thresholds were derived within the same retrospective cohort and should therefore be interpreted as exploratory and hypothesis-generating rather than externally validated clinical decision cutoffs.
5. Discussion
This study assessed the diagnostic performance of attenuation measurements from TNC and VNC images obtained using PCD-CT for anemia detection in AIS patients. Among the evaluated anatomical regions, attenuation values measured in the VCM on native TNC images showed the strongest correlation with serum hemoglobin levels. In vessel-matched intracranial comparisons, TNC consistently outperformed the corresponding VNC reconstructions. To our knowledge, no prior study has evaluated both true non-contrast and virtual non-contrast venous attenuation markers for anemia detection in AIS patients on the same PCD-CT platform. Accordingly, the results should be interpreted as two complementary but methodologically distinct analyses: a vessel-matched intracranial TNC-versus-VNC comparison and a separate pragmatic, workflow-oriented comparison using the best-performing extracranial VNC marker. In this pragmatic comparison, attenuation measurements in the internal jugular vein on VNC images demonstrated diagnostic performance similar to that of the best-performing TNC marker, namely the VCM. This jugular VNC marker was included because our prior CTA/VNC-based work identified the internal jugular veins as a reliable VNC measurement site for anemia assessment; however, in the present study, it served only as a pragmatic extracranial comparator, whereas the primary TNC-versus-VNC comparison was restricted to intracranial venous structures available on both acquisitions.
The capability of VNC images derived from CTA datasets to detect anemia has been previously established in thoracic and abdominal imaging contexts (14-16). However, such assessments in neuroimaging settings are limited. This study expands the current understanding by indicating that extracranial structures such as the internal jugular vein may provide diagnostic performance comparable to intracranial venous measurements (VCM), potentially benefiting from fewer artifacts caused by adjacent bony structures and easier practical access in routine clinical settings (14, 19). However, it should be noted that reconstruction settings were not identical between datasets: TNC images were reconstructed using kernel Hr40 with QIR level 2, whereas VNC images were derived from CTA datasets reconstructed with kernel Qr40f and QIR level 3. These differences may have influenced image texture, noise properties, and attenuation stability and should be considered when interpreting direct comparisons between TNC and VNC measurements.
The present cohort partially overlaps with our previously published study on VNC-based anemia assessment in supra-aortic vessels (23). However, the scientific objective differs substantially. While the prior work evaluated VNC attenuation measurements from CTA datasets, including intra- and extracranial vascular regions, the current study specifically addresses whether CTA-derived VNC measurements can approach the diagnostic performance of native cranial CT/TNC attenuation within intracranial venous structures available on both acquisitions. Thus, the present analysis is an incremental comparison between intracranial native TNC and VNC attenuation markers using hemoglobin-based anemia classification as the reference standard.
An important physiological confounder in attenuation-based anemia detection is the influence of acute hemodynamic variability on venous attenuation values. Prior work has demonstrated that venous HU measurements are not solely determined by hemoglobin concentration but are significantly affected by hydration status, renal function, inflammatory parameters, and intravascular volume shifts (25). These effects are particularly relevant in the acute stroke setting, where patients frequently receive intravenous fluids, experience autonomic dysregulation, or present with cardiac comorbidities that alter venous return and intrathoracic pressures. This mechanism may partially explain why VNC-based jugular vein measurements, although showing similar diagnostic performance to native VCM attenuation in the pragmatic comparison, exhibit greater variance. Intracranial venous structures such as the VCM operate under more stable low-flow conditions and are less susceptible to rapid hemodynamic fluctuations, potentially contributing to their stronger correlation with hemoglobin on native imaging.
A key methodological limitation of our study is that the pragmatic comparison between native VCM attenuation and VNC-derived internal jugular vein attenuation does not isolate imaging modality from anatomical location. Accordingly, the observed similarity in diagnostic performance should be interpreted as a pragmatic comparison between the best-performing TNC and VNC markers rather than as proof of full equivalence between TNC and VNC technology. Because intracranial dural venous structures and extracranial neck veins differ in compliance, flow dynamics, and susceptibility to physiological variation, future studies should ideally include vessel-matched comparisons across modalities.
The finding of no statistically significant difference between VCM attenuation on native CT and jugular vein attenuation on VNC images might nevertheless be clinically meaningful. However, this comparison combines both imaging modality and anatomical-location effects: VCM-TNC represents an intracranial venous marker on true non-contrast imaging, whereas internal jugular vein VNC represents an extracranial venous marker derived from contrast-enhanced CTA. Therefore, similar AUC values should not be interpreted as evidence that VNC is generally equivalent to TNC or that VNC can broadly replace native imaging. Rather, the finding suggests that internal jugular vein VNC attenuation may provide a pragmatic anemia-screening marker in selected stroke workflows, provided that this approach is validated prospectively. The VCM-VNC threshold showed relatively high sensitivity but only moderate specificity, suggesting that this marker may be more suitable as a screening-oriented indicator than as a standalone diagnostic cutoff. This further supports the interpretation of the proposed VNC thresholds as exploratory and requiring prospective validation.
The equivalence between VNC and TNC is not uniform across anatomical regions. While extracranial veins benefit from larger ROI placement and reduced susceptibility to beam-hardening, they remain more vulnerable to contrast contamination and hemodynamic instability, which can attenuate correlation strength. These region-specific constraints indicate that the feasibility of using VNC as an alternative to TNC should not be generalized across all vascular territories. Instead, VNC appears most reliable in anatomical sites with low residual iodine content and stable venous flow conditions. Defining such region-specific criteria is essential before VNC can be broadly integrated into streamlined stroke protocols or mobile stroke unit workflows. Prospective validation will be required to determine whether hybrid or region-optimized VNC strategies can serve as an alternative to native scans without compromising diagnostic accuracy.
5.1. Limitations and Conclusions
Several further limitations should be acknowledged. First, the study’s relatively small sample size and single-center retrospective design limit generalizability. Although the main associations remained present after adjustment for age and sex, residual confounding cannot be excluded. Second, although most hemoglobin measurements were obtained close to CT acquisition, with 77.8% available within one calendar day, the study allowed a maximum interval of seven days between CT and laboratory testing. This temporal mismatch is a relevant limitation in acute stroke patients, in whom hemoglobin values may change because of dehydration, intravenous fluid administration, bleeding, or intercurrent clinical events. A sensitivity analysis restricted to patients with hemoglobin measurements within one calendar day showed broadly consistent diagnostic performance, particularly for VCM-TNC. Accordingly, the present findings should be considered exploratory and hypothesis-generating.
Nevertheless, the observed correlations and diagnostic performance support the potential clinical relevance of venous attenuation measurements. Future studies should aim to validate these findings in larger, multicenter prospective cohorts and explore additional factors influencing attenuation-based hemoglobin estimation, including hydration status, renal function, medications, and inflammatory status.